

Read a meeting-room CO₂ graph alongside the room's occupancy and ventilation events, not as a standalone peak. Note the level before people enter, the start and duration of the meeting, how quickly the trace changes while the room remains occupied, and what happens after people leave or the outdoor-air system changes. The same high point can be reached by different combinations of people, starting concentration, room volume and air exchange. Without an event record, a graph cannot tell you which cause dominated. ASHRAE's indoor CO₂ position document warns that interpreting CO₂ as ventilation evidence requires attention to mixing, source generation and measurement conditions.


A meeting room is a particularly useful place to learn this method because occupancy often changes abruptly: a room sits empty, several people arrive, a meeting runs for a defined period, then everyone leaves. That makes event timing visible in the trace. It also creates traps. A late arrival can change the source, a door may be propped open, a ventilation schedule may switch, and a logger beside one participant can react to breath rather than the room. The curve is evidence to investigate, not a verdict about occupants' health, productivity or the compliance of the building.
ال UK HSE workplace guidance describes small meeting rooms with relatively consistent occupancy over a meaningful period as suitable settings for CO₂ monitoring. It also cautions that rapidly changing numbers of people and snapshot readings are harder to interpret. This guide turns those cautions into a practical reading sequence. For the placement decision itself, see our office CO₂ monitor placement plan.
What the meeting-room sensor is actually measuring
People exhale CO₂. The monitor samples concentration at one inlet, after the air has mixed—or failed to mix—with air from the rest of the room, adjacent spaces and outdoors. Concentration at that point reflects the recent balance between occupant generation and removal by outdoor-air exchange or transfer to lower-CO₂ spaces. It also reflects the sensor's response, display smoothing and logging behavior. It does not directly measure the supplied outdoor-air flow rate, and it does not measure all indoor pollutants.
A room can begin a meeting already elevated after a previous group left. It can begin lower after a period of outdoor-air ventilation. A crowded short meeting may end before the room approaches a stable concentration; a less crowded long meeting may reach a flatter segment. Comparing their end points as if they were the same test would be misleading. The useful unit of analysis is an event window with known conditions, not an isolated ppm value.
This also explains why there is no universal, context-free “good office number” that settles every question. Official guidance in a jurisdiction may use CO₂ as a broad screening indicator and may specify action values for that context. It does not turn every monitor into a medical exposure instrument or every point into a ventilation-rate measurement. If a ventilation system is being formally assessed, its design documents, local requirements and competent measurement method matter. أشراي explicitly distinguishes useful CO₂ applications from overly simple interpretations.
Set up the logger before the room fills
Use a monitor that measures actual CO₂, rather than a VOC-derived estimated value. Check its manual for measurement range, accuracy conditions, startup time, response, logging interval, averaging and calibration behavior. The final device matters, not just the name of a sensor component. Our direct CO₂ versus eCO₂ guide explains the measurement distinction; our CO₂ monitor accuracy guide explains why a display's small numerical steps do not prove small uncertainty.
Place the instrument in a stable occupied-zone position with unobstructed air access, away from a speaker's face, the supply diffuser, window, doorway, fan and heat source. A device on the middle of a conference table may be convenient, but if people lean over it or move it to make room for laptops, its trace can contain local effects. A side shelf at a representative position may work better in some rooms; in others it may be too close to the door. The HSE placement advice is a starting point, and a short location trial resolves building-specific uncertainty.
Check the clock and time zone. A graph that is ten minutes late can make the wrong event appear causal. Know whether the plotted data are raw samples, averages, interpolated points or repeated last-known readings. Cloud dashboards can show a smooth line even when communication dropped. A monitor's display may update faster than the saved log. If you cannot retrieve timestamps and missing-data flags, limit the conclusions to broad repeated patterns.
Before the meeting, record the room identifier, monitor position, number of expected participants, door/window state, outdoor-air mode and whether a prior group just left. Begin logging early enough to see the pre-meeting condition. Do not force a “fresh-air calibration” merely to make the display look plausible; follow the manufacturer's procedure. The Sensirion SCD4x datasheet illustrates how calibration algorithms can depend on exposure history for a particular sensor family, but a finished monitor's instructions govern its actual behavior.
Make an event record that can be compared with the curve
A simple note sheet can transform an ambiguous time series into a useful one. Record approximate entry and departure times, head count, any person joining or leaving, whether the door was closed, whether windows changed, and the time any outdoor-air control or fan mode changed. Note projector or equipment use only if it changes temperature or air movement. Do not collect personal identities when a head count and timing answer the ventilation question.
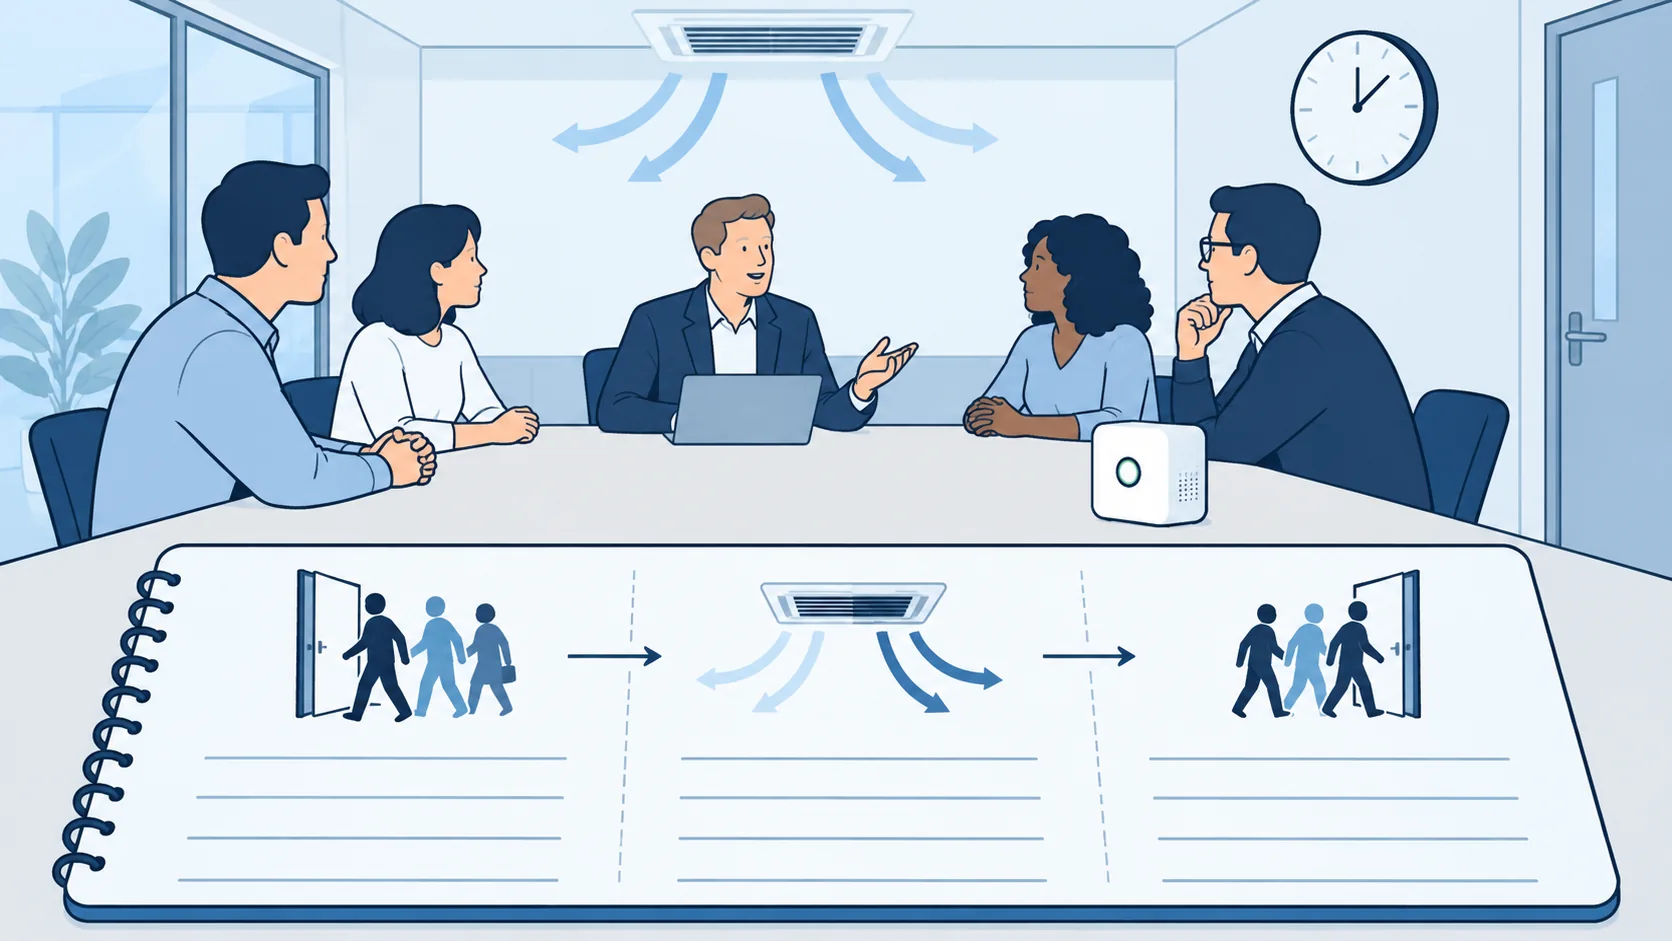
Use clock times rather than “about halfway through.” A chart's response may lag an event because the sensor and room need time to respond. If a door opens at the same moment people leave, mark both. Later you cannot attribute a falling trace solely to the open door. If two groups use the room back-to-back, mark that boundary; the second group starts from the first group's remaining room concentration. Recording the room as “occupied” all afternoon hides the different source strengths and pauses.
| Event to record | Why it matters | What the graph alone cannot say |
|---|---|---|
| People enter or leave | Changes the occupant CO₂ source | Whether a change came from ventilation instead |
| Door opens to a corridor | Changes room-to-corridor mixing | Whether more outdoor air entered the building |
| Window opens | May alter outdoor exchange, dependent on weather | Exact airflow from the opening angle alone |
| Outdoor-air system changes | May change supply or exhaust to the room | Whether the intended flow actually reached occupants |
| Monitor moves or power cycles | Changes sample location or instrument state | Whether a jump was a room-air event |
| Logging or network gap | Removes evidence during an event | The shape of the missing interval |
The notebook is not busywork. It prevents a tidy dashboard from erasing the conditions that made the observation possible. CIBSE Journal's discussion of workplace monitoring similarly emphasizes logging and analysis beyond owning a device; specific technical conclusions here rest on primary guidance and the documented event logic.
Read the time series in phases
Before entry: establish the starting condition
Look at the empty or lightly occupied room before the meeting. Is the reading stable, still falling from a prior session, or already rising because people are setting up? A high starting level can make a later peak look alarming even when the occupied rise is modest; a low starting level can conceal a rapid subsequent rise if only the last number is reported. Note whether the room had a meaningful empty interval and what the outdoor-air system was doing then.
If you use an outdoor reading for context, measure it appropriately rather than assuming a fixed background. Outdoor concentration near exhausts, traffic or a person breathing on the sensor can differ from a regional background. A room-to-outdoor difference can be informative, but ASHRAE's tracer-gas discussion makes clear that turning it into an airflow estimate needs valid assumptions about source generation, mixing and state of the system. For most day-to-day meeting reviews, a direct comparison of repeatable occupied patterns under known conditions is more defensible than a calculated ventilation rate.
Entry and early rise: allow for mixing and sensor response
When people enter, they add a source. The room may not mix instantly, and the monitor itself has a response and averaging behavior. An immediate tall spike when someone stands beside it may be a local breath plume; a sustained rise across several readings is more plausibly a room-air trend. If a second person joins later, the slope can change. If the door closes at the same time, the effective air path can also change. The event record separates these candidates enough to decide what to test next, even when it cannot prove a single cause.
Do not compare the first five minutes of one meeting with the last five minutes of another. The starting level and elapsed time differ. Match the same phase and similar conditions. A practical internal summary might report “the occupied period rose throughout the session under the recorded schedule” or “the rise moderated after an outdoor-air mode change”; it need not compress the whole story into one peak.
Mid-meeting: distinguish a continued rise from a plateau
A trace that continues rising suggests the sampled concentration has not settled into a balance under those conditions. A flatter period can be consistent with a more stable balance between generation and removal, but check other explanations: participants may have left, the door may have been opened, the ventilation schedule may have changed, or the dashboard may have held a stale value. A visually flat line composed of identical repeated points should trigger a logger check. Neither shape alone proves a specified outdoor-air supply rate.
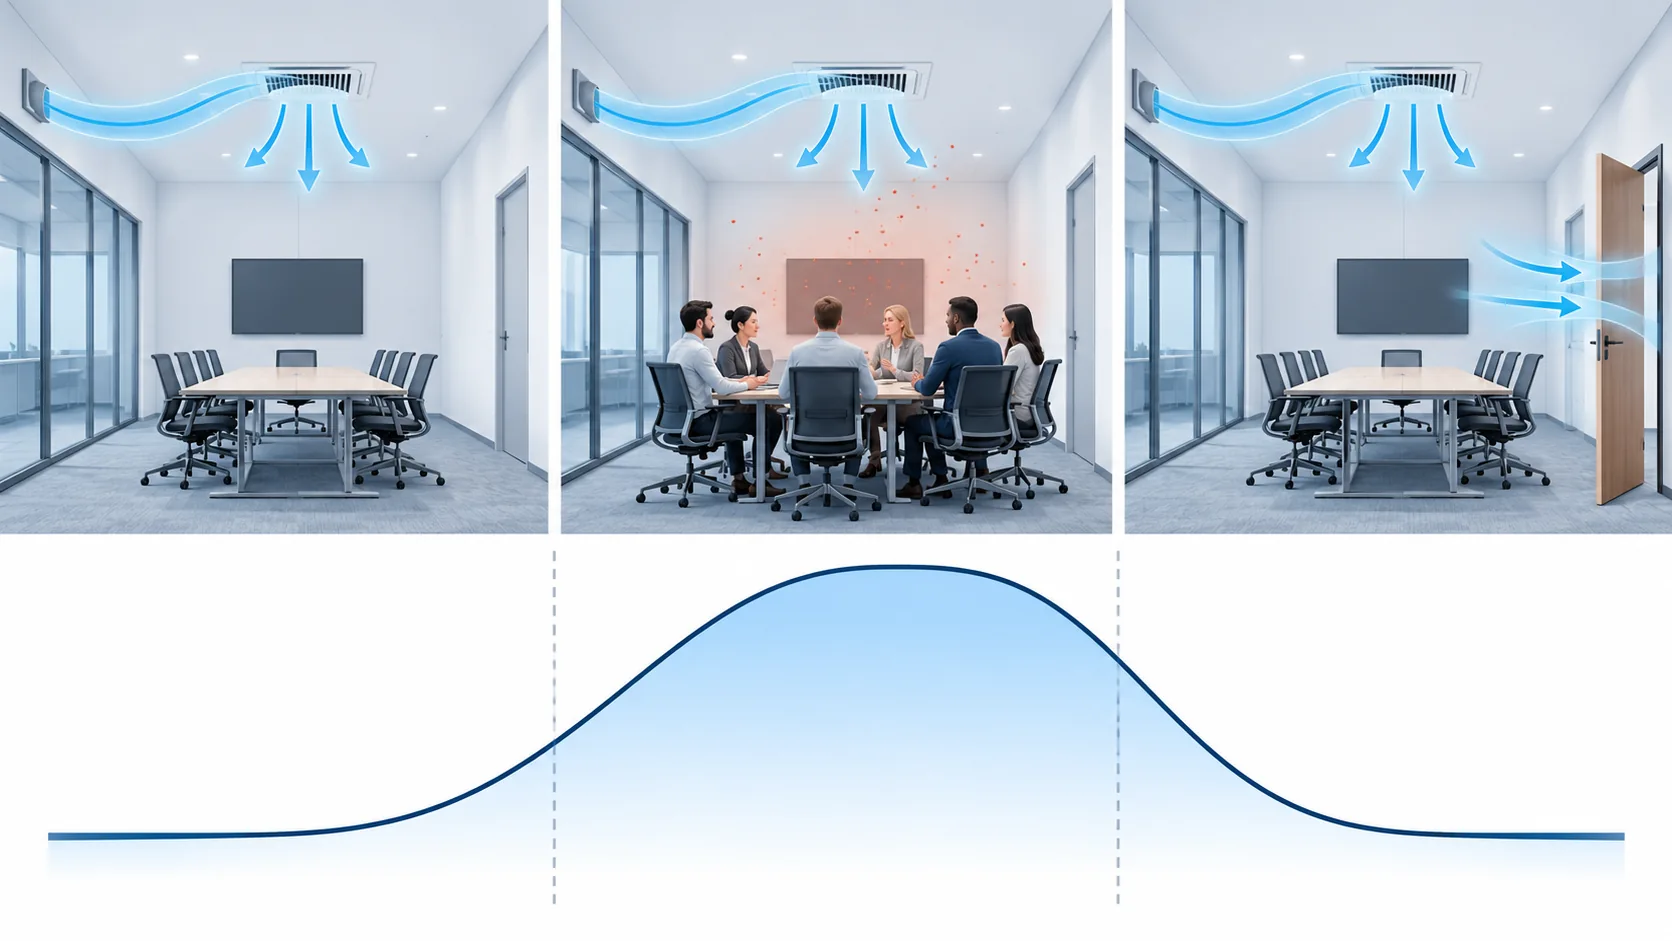
There is a reason the curve in the illustration has no numerical axis: it shows sequence, not measured performance. A real interpretation should retain units, timestamps and the instrument's uncertainty. Do not draw a theoretical “ideal” curve and call the difference a building fault without a validated model. ASHRAE discusses steady-state and decay tracer-gas methods, including their assumptions; an ordinary meeting with changing occupancy and open doors is not automatically such a test.
Breaks, windows and doors: read the whole air path
A break may lower concentration because people leave, because a door opens, because the outdoor-air system changes, or because several things happen together. An internal door can dilute the sampled room with corridor air even if no extra outdoor air enters the building. A window may connect to outdoor air, but exchange depends on wind, temperature and a flow path. A recirculating fan can mix a local pocket without adding outdoor air. These mechanisms cannot be made identical by the fact that all can move the displayed ppm downward for a while.
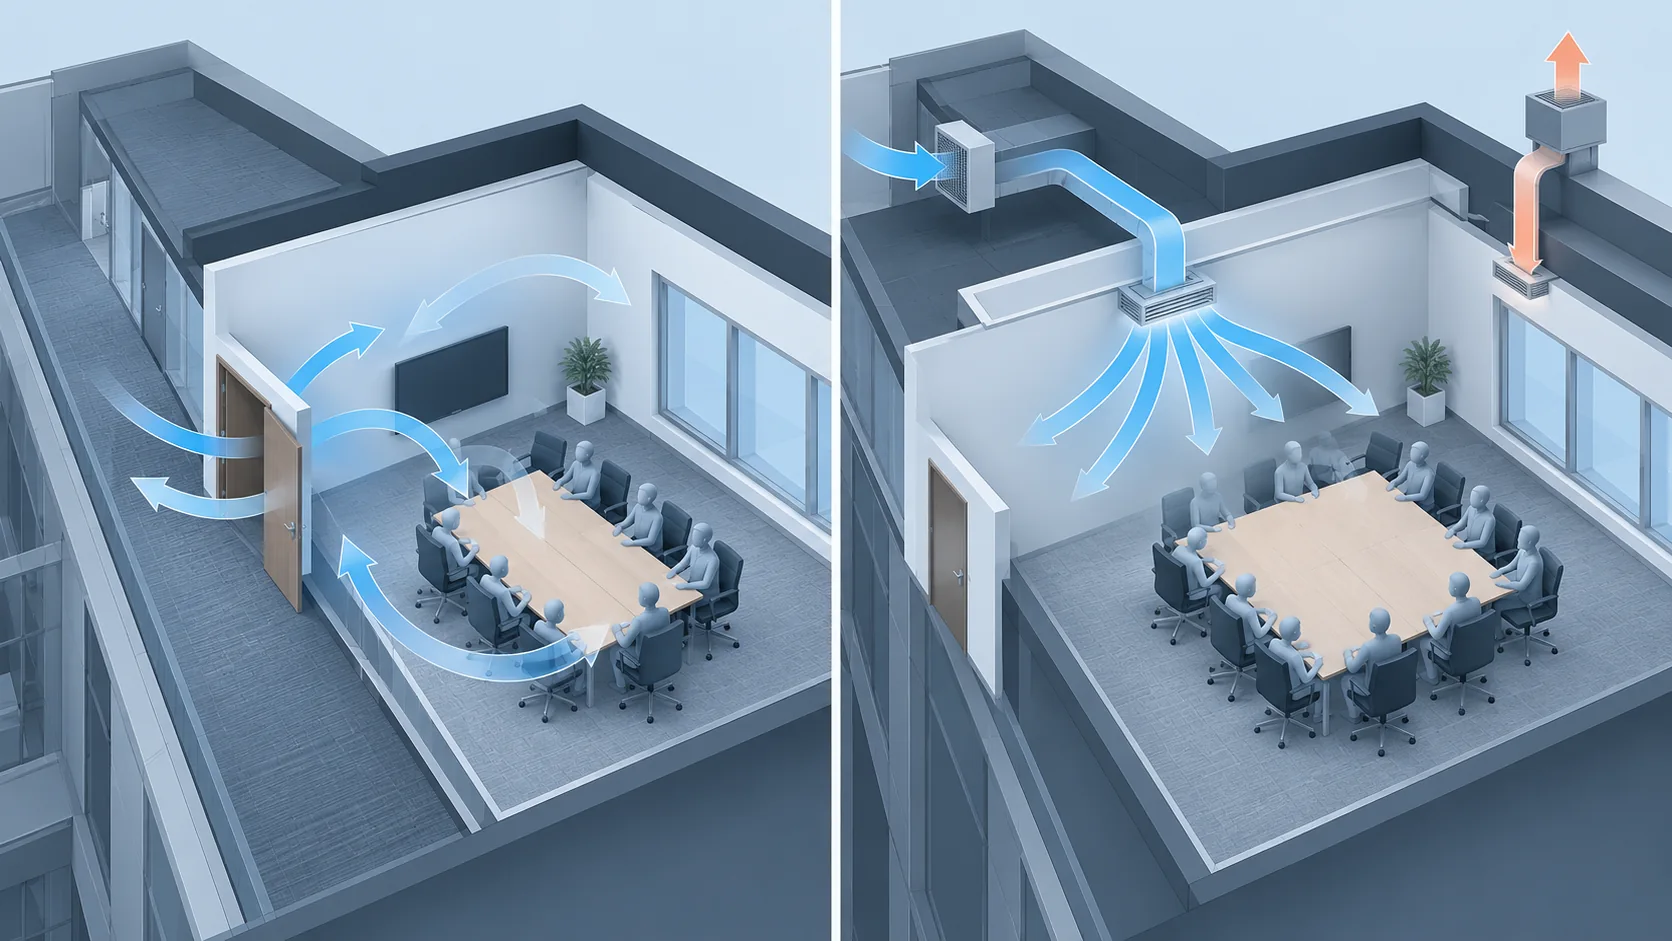
Suppose the graph falls just after a participant opens the door and leaves. The two events are confounded; the honest statement is that the decline followed both. If the question matters, observe a later comparable occupied period with one planned, safe air-path change while the other conditions are as similar as possible. Do not instruct occupants to defeat fire doors, security requirements or designed ventilation controls merely to produce a cleaner experiment.
After departure: a falling line has several interpretations
When participants leave, the occupant source diminishes. The room may continue exchanging air with the corridor or outdoors, and the sensor gradually responds. A fall after the meeting therefore does not prove that ventilation was sufficient while the meeting was occupied. Conversely, a room that remains elevated for a while may have limited exchange, a slow sensor, a changed HVAC schedule or lingering occupancy nearby. Mark the exact departure and any system changes before interpreting the shape.
If someone wants to estimate an air-change rate from the decay, that is a separate technical measurement plan. It requires a suitable concentration range, source cessation, appropriate mixing, stable outdoor background and a method consistent with the room and system. A casual post-meeting line with a corridor door open and unknown system schedule does not meet those assumptions simply because it looks exponential.
Compare meetings fairly
The best comparison is not necessarily a pair of meetings with identical peaks. Compare sessions in the same room, with the same monitor in the same position, a trustworthy clock, similar occupant counts and duration, and documented ventilation settings. Keep the pre-meeting starting level in view. If a meeting is twice as long, ends after the system changes schedule, or has different seating around the monitor, describe that difference before attributing the traces to the air system.
You can use a simple sequence: observe several normal sessions; identify the recurring occupied-phase pattern; choose one safe and authorized change to the outdoor-air strategy; observe comparable sessions; then examine whether the change repeats. Do not hide unsuccessful or incomplete observations. A meeting in which the logger lost power, the door was held open unexpectedly or the head count was unknown should be marked not comparable, with the raw record retained.
| Comparison item | Keep similar or record explicitly | Why it changes interpretation |
|---|---|---|
| Room and monitor position | Same room, device and inlet position | Changes what air is sampled |
| Occupancy | Head count, entry and exit times | Changes generation over time |
| Starting point | Pre-meeting concentration and prior use | Affects the final value independently of the current meeting |
| Air paths | Door, window and supply/exhaust schedule | Changes dilution and mixing |
| Time series | Clock, interval, gaps and smoothing | Can shift or hide an event response |
| External conditions | Weather and nearby-room occupancy | Can influence natural exchange or corridor air |
If you need to compare two rooms, use the office placement plan to determine whether each instrument samples an equivalent occupied zone. For a single room's before-and-after study, it is often better to leave the same device in place. If devices must change, perform a side-by-side check before treating their small numerical differences as real. The logger-versus-display guide helps select a product that can preserve the event history you need.
Check the data before diagnosing the room
A time series can look plausible and still be wrong. Inspect a few raw timestamps: do samples arrive at the expected interval? Did a daylight-saving or time-zone change shift the chart? Does a flat segment consist of genuinely repeated measurements or the app repeating a cached value? Does the device require a warm-up after power loss? Is the display in ppm of actual CO₂ or an estimated index? Does the device average so heavily that a short break is blurred? These checks can resolve an apparently mysterious curve without changing any ductwork.
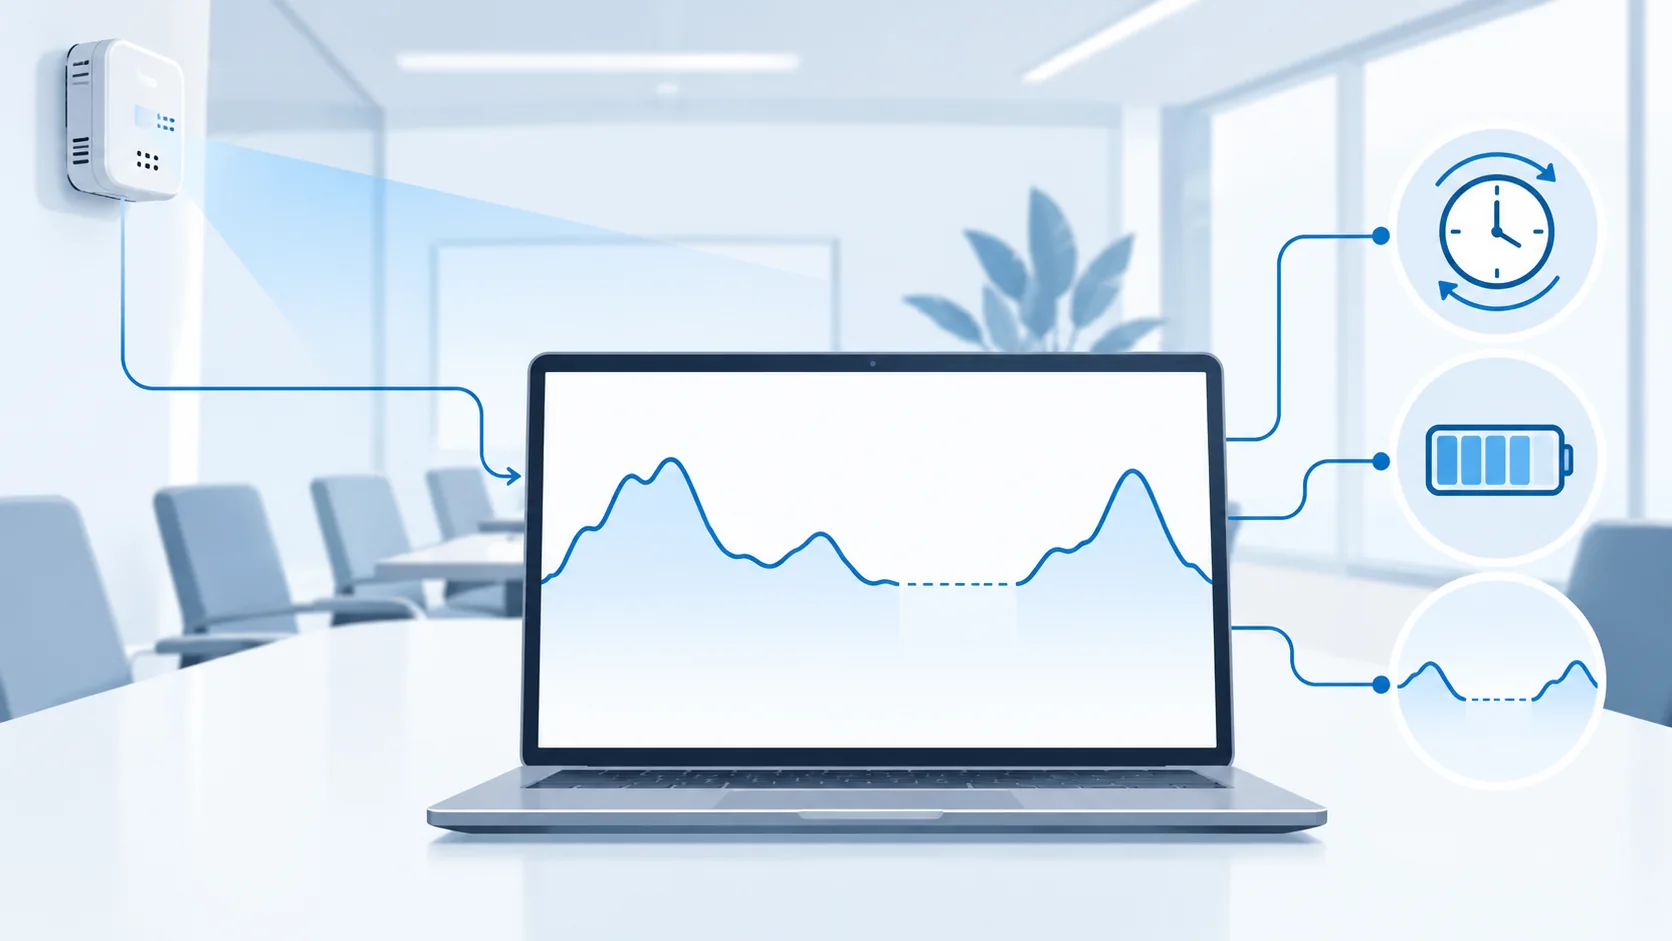
Location is another data-quality variable. If participants rearrange seating so a speaker talks directly toward the inlet, a local response may change even with the same number of people and outdoor-air setting. Do not smooth away sharp features until you know whether they are artifacts or meaningful events. Preserve the unsmoothed export, note any processing and avoid comparing a smoothed dashboard from one device with raw samples from another.
ال SCD4x datasheet is a useful model-specific reminder that response, update mode and calibration have conditions. It does not certify any generic finished monitor. Read the actual product documentation and, for decisions with significant consequences, obtain an appropriate reference check or professional evaluation.
What the CO2 graph cannot answer by itself
CO₂ is a useful marker of occupant-related air exchange under suitable conditions. It is not a full indoor-air-quality score. A room with a lower reading can still have particles, odors, cleaning-product vapors, carbon monoxide or a local source unrelated to occupants. A recirculating filter may reduce particles without materially removing occupant-generated CO₂. Our air purifier and CO₂ article separates filtration from outdoor-air exchange.
It is also not a diagnostic test for alertness or performance. Studies of office conditions involve many correlated variables—ventilation, temperature, pollutants, occupancy and task design. A manager should not infer an individual's cognitive state from the meeting-room logger. ASHRAE's 2025 review discusses the limits of direct-effect evidence at commonly observed indoor levels. If people report discomfort, take the report seriously and investigate the broader room conditions instead of dismissing it because one CO₂ value looked acceptable.
Finally, a falling trace cannot certify a precise airflow, and a rising trace cannot identify a broken component. The trace can prioritize questions: Was the outdoor-air system scheduled on? Did the meeting room receive supply when occupied? Was an interior door affecting mixing? Were several rooms on the same return? A facilities professional can inspect those pathways and measure flow with appropriate methods. The monitor is a diagnostic clue, not an HVAC commissioning instrument by default.
A compact meeting-review worksheet
For each session, retain the room and monitor ID; date; pre-meeting room state; number of people and entry/exit times; door/window state; outdoor-air system mode; logger position and sampling interval; first occupied reading; direction of the occupied trend; any plateau or event-linked change; post-meeting response; and one line describing uncertainty. Avoid turning the worksheet into a scoring system with an invented cutoff. Its purpose is comparability and causal caution.
A useful written interpretation could be: “During three similarly occupied afternoon sessions, the same monitor at the same location showed a sustained rise after entry. The room began each session after a short empty interval. The ventilation schedule was unchanged; the corridor door was closed. The data justify checking outdoor-air delivery to this room.” It does not claim an exact air-change rate, a medical effect or a defect already proved. A poor interpretation would be: “The peak exceeded a number, so the system failed,” without stating occupancy, location or standard.
الأسئلة المتداولة
Why does the reading rise as soon as people enter?
People begin adding CO₂, but an immediate sharp spike may also be breath near the inlet. Check monitor position, the duration of the change and whether the rise persists after everyone is seated. Compare with the instrument's response and averaging behavior.
Does a plateau prove the ventilation is adequate?
No. It can be consistent with a source–removal balance under those conditions, but the level, occupancy, time to reach it, device state and purpose of the assessment still matter. A flat display can also be stale data. A legal or design conclusion requires the applicable method, not just the curve shape.
Can opening the corridor door solve the room's ventilation problem?
It may change local mixing and the reading, but an interior door is not itself an outdoor-air supply. It can transfer air between rooms, and fire, acoustic or security requirements may govern its use. Investigate the designed outdoor-air path rather than prescribing an open door from one graph.
Is a meeting's final peak enough for a comparison?
No. The peak depends on the starting level, number of people, duration, room volume, air paths and sensor location. Compare the occupied time series and documented conditions, including any interruptions, not just the largest number.
Can I calculate air changes per hour from the post-meeting decline?
Only with a suitable tracer-gas method and its assumptions checked. Source cessation, mixing, outdoor background and stable conditions are important. A casual room graph with changing doors or HVAC settings is usually insufficient for a defensible numerical rate.
Why do two monitors on the same table disagree?
Their accuracy, calibration, response, averaging or clock settings may differ. Allow both to settle, compare their manuals and watch whether the difference persists during a stable co-location period. Agreement is useful, but two agreeing uncalibrated devices are not a certified reference.
Should we monitor every meeting room continuously?
That depends on the decision, room use and building system. A focused survey may answer a specific concern; a continuously logged room may help when use varies or controls need feedback. First define the question and choose representative locations. More data without event context can make interpretation harder rather than easier.
The strongest meeting-room record pairs a trustworthy trace with a short event timeline. It lets the facilities team see what happened, what remains uncertain and which part of the air path deserves the next check.