
A CO₂ monitor specification such as ±(50 ppm + 3% of reading) combines a fixed term with a concentration-dependent term. At 1,000 ppm, the arithmetic is 50 + 0.03 × 1,000 = 80 ppm. Reading only the “50 ppm” part understates the stated allowance; reading only the “3%” part misses the fixed contribution.
That calculation is only the first step. A useful comparison also checks the concentration range, environmental conditions, calibration state and whether the claim describes a sensor module or the complete monitor. A smaller number on a product page does not settle those questions.
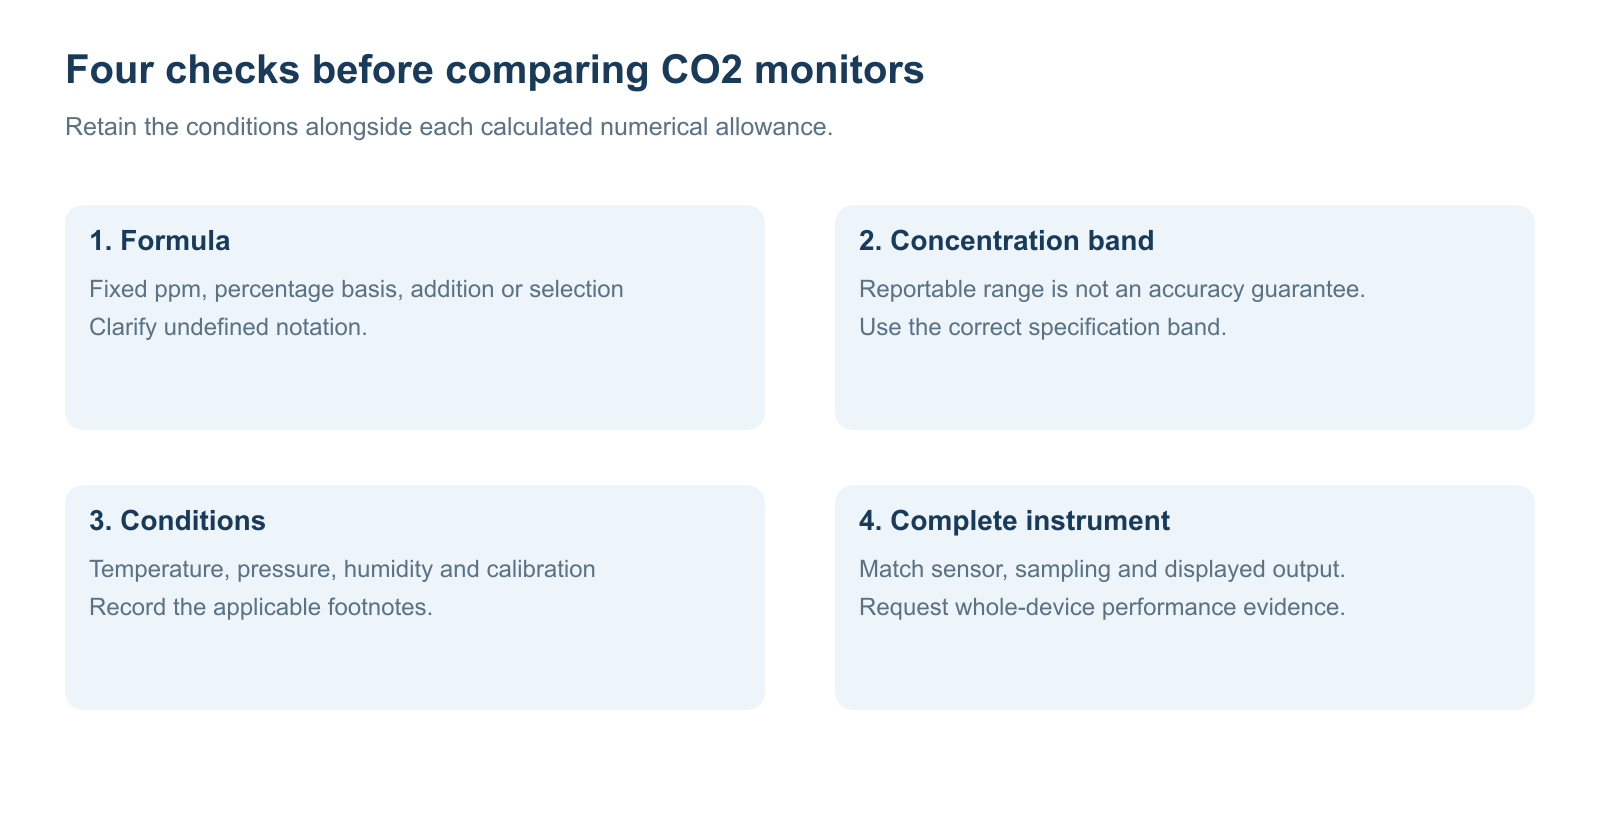
The most reliable way to compare instruments is to translate each published formula into ppm at the concentrations that matter to the application, then put its conditions alongside the result.

The Five Specifications That Should Stay Separate
An instrument can display small changes, produce very consistent readings and still have a substantial offset from a reference. Keep these characteristics in separate columns:
| 사양 | The question it answers | What it does not establish |
|---|---|---|
| 측정 범위 | Which concentrations can the device report? | Equal performance across the entire range |
| Display or output resolution | How fine are the reported increments? | Agreement with a reference to that same increment |
| 반복성 | How closely do repeated results agree under stated conditions? | Freedom from systematic offset |
| Published accuracy specification | What measurement deviation does the manufacturer specify, under which conditions? | The uncertainty of every installed measurement |
| Measurement uncertainty | How much doubt is associated with a defined measurement result? | A quantity inferred solely from display digits |
There is a terminology nuance behind product literature. NIST’s measurement terminology treats accuracy as a qualitative concept and distinguishes it from repeatability and uncertainty. Manufacturers nevertheless commonly label a numerical ± specification “accuracy.” When comparing products, retain the manufacturer’s wording and read how that number is defined.
A monitor showing 1 ppm increments therefore has a 1 ppm display step. It does not follow that its readings agree with a reference within ±1 ppm. Similarly, a stable-looking display may result from averaging or filtering; stability alone is not evidence of a smaller measurement deviation.
For broader background on sensing methods and concentration units, see CO₂ measurement.
Calculate the Fixed and Percentage Terms Together
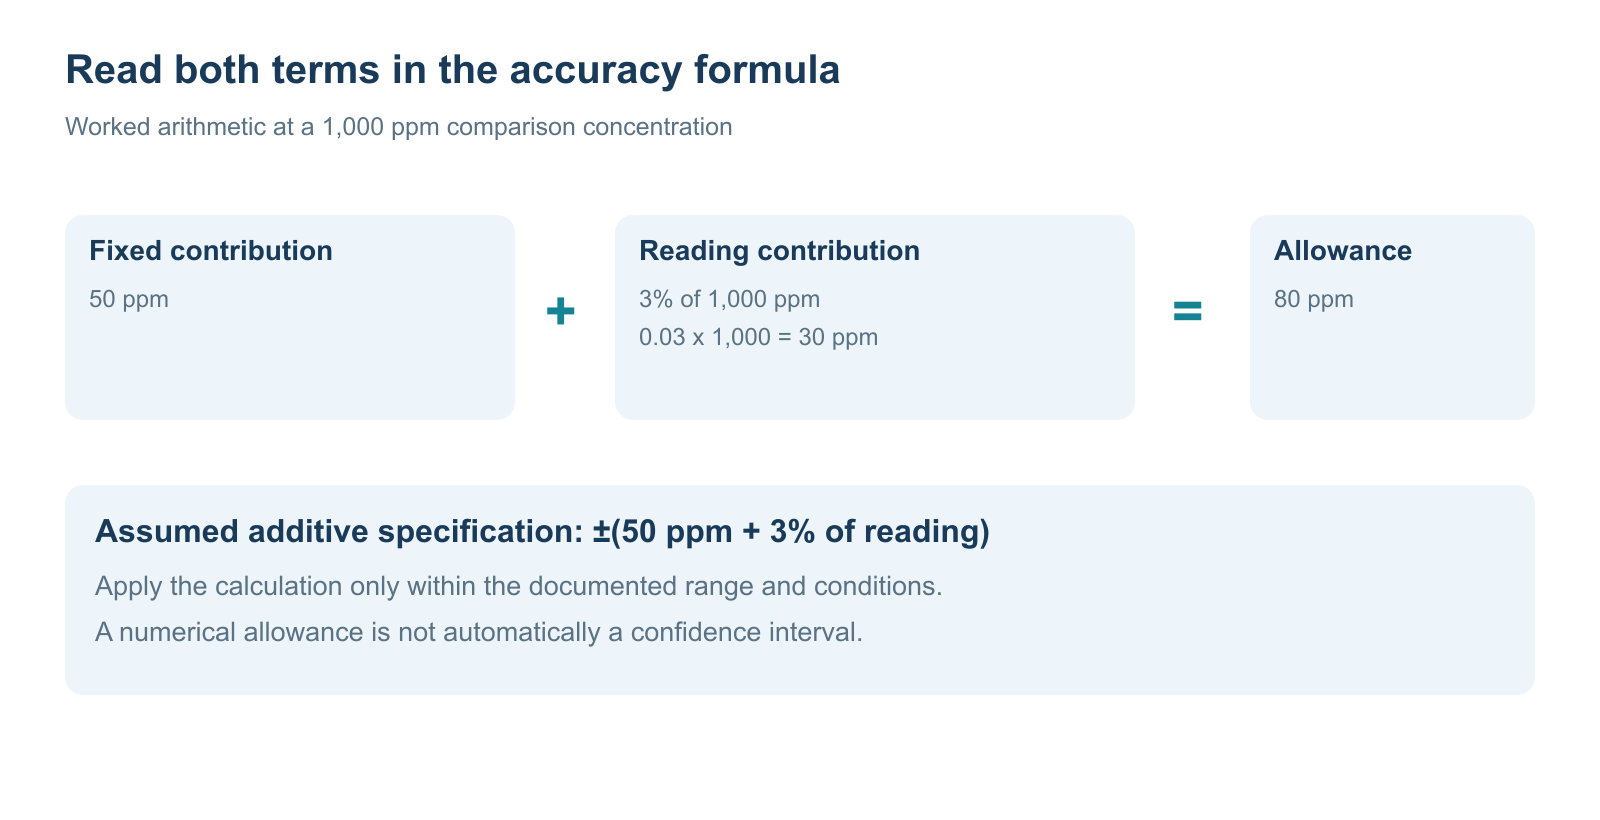
Consider an assumed specification of ±(50 ppm + 3% of reading). For a comparison at concentration C, calculate:
E(C) = 50 ppm + 0.03 × C
Both terms now have ppm units. The percentage term changes with C, while the fixed term remains 50 ppm.
| Comparison concentration | Fixed term | 3% term | Calculated ± allowance |
|---|---|---|---|
| 500 ppm | 50ppm | 15ppm | ±65 ppm |
| 1,000 ppm | 50ppm | 30 ppm | ±80 ppm |
| 2,000 ppm | 50ppm | 60 ppm | ±110 ppm |
These are worked values for the assumed formula. Apply them to a real device only if its documentation gives that formula and covers those concentrations and conditions.
For example, if the manufacturer’s definition evaluates this allowance at a 1,000 ppm reference concentration, its corresponding indication interval would be 920–1,080 ppm. That is different from seeing 1,000 ppm on an unknown monitor and claiming that the true concentration must fall in precisely that interval. The latter requires the manufacturer’s convention and an interpretation of the actual measurement.
For procurement, calculate at several relevant concentrations rather than choosing one convenient test point. A fixed term has more relative influence at lower concentrations; the percentage term contributes more as concentration rises. This is why one headline “percent accuracy” can conceal a useful distinction between two instruments.

Percent of Reading and Percent of Full Scale Are Different
The phrase “±2%” is incomplete until the percentage basis is clear. Two common bases are the measured value and the full-scale range.
- 2% of reading at 1,000 ppm: 0.02 × 1,000 = 20 ppm.
- 2% of a 5,000 ppm full-scale value: 0.02 × 5,000 = 100 ppm.
The second quantity remains 100 ppm across that assumed range. Check how the manufacturer defines full scale, especially if a device has a non-zero lower range limit, selectable ranges or a separately scaled analog output.
To see why application concentrations matter, compare two hypothetical formulas:
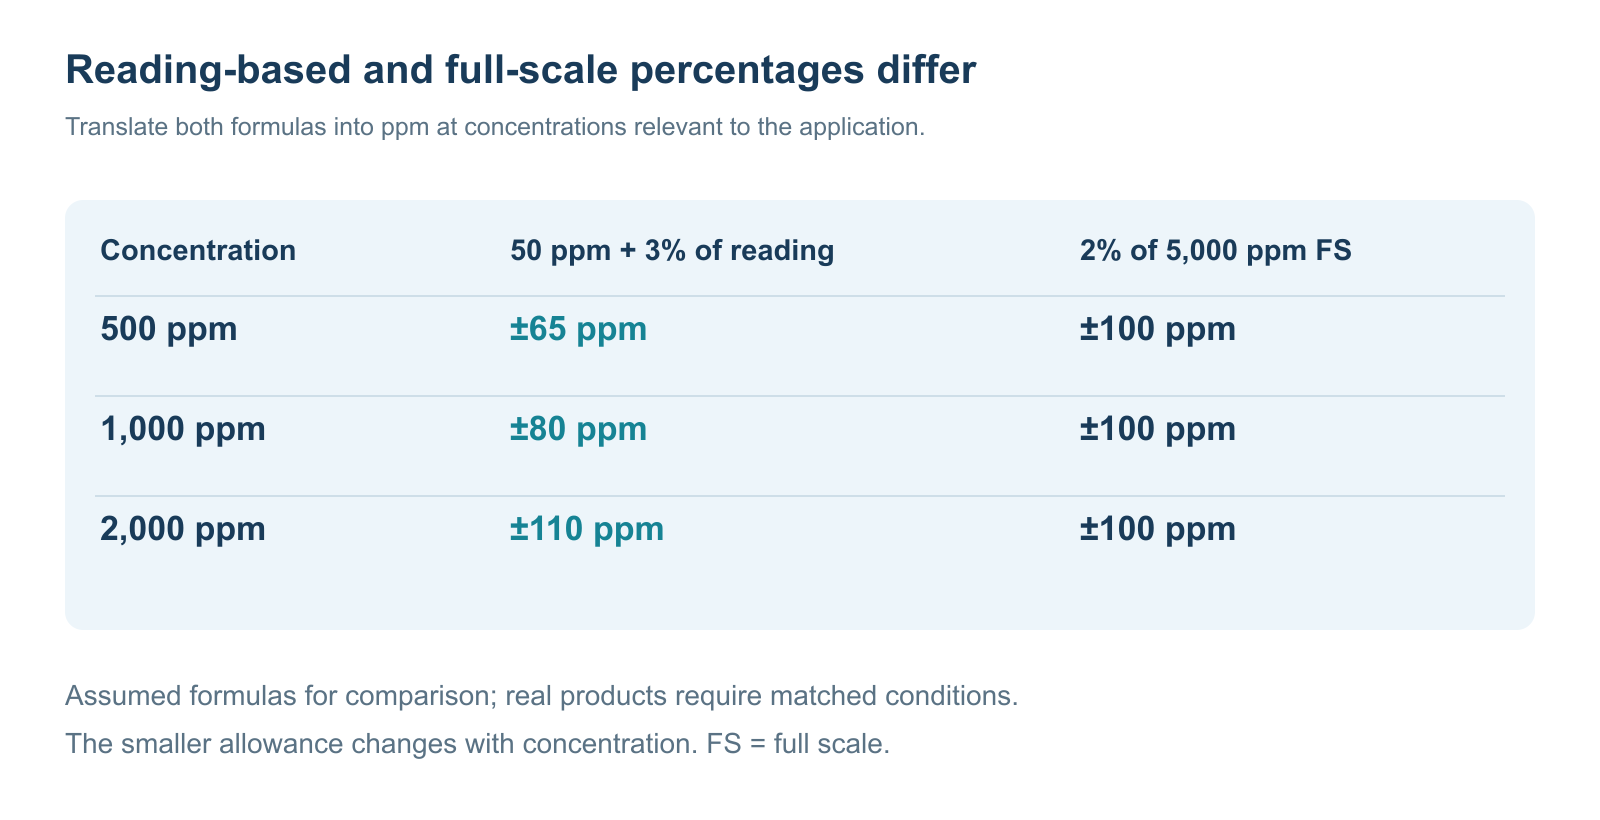
| 집중 | Device A: ±(50 ppm + 3% of reading) | Device B: ±2% of a 5,000 ppm full scale |
|---|---|---|
| 500 ppm | ±65 ppm | ±100 ppm |
| 1,000 ppm | ±80 ppm | ±100 ppm |
| 2,000 ppm | ±110 ppm | ±100 ppm |
With these assumptions, A has the smaller allowance at 500 and 1,000 ppm, while B has the smaller allowance at 2,000 ppm. Their arithmetic crossover is approximately 1,667 ppm: 50 + 0.03C = 100.
That crossover compares the formulas only. It does not rank real products, establish a confidence level or account for calibration, environment, sampling or additional components. Use it to identify the concentrations at which the specification difference is relevant.
Check Whether Terms Are Added, Selected or Applied by Range
Accuracy statements can have different mathematical structures. Do not turn punctuation into a formula without checking the manual.
| Published form | Interpretation to verify |
|---|---|
| ±(A ppm + B% of reading) | Add the fixed and percentage terms |
| ±A ppm or ±B%, whichever is greater | Select the larger allowance at the stated concentration |
| ±A ppm below a boundary; ±B% above it | Use the formula for that concentration band |
| Typical value | Check what population, conditions or characterization it represents |
| A number followed by a footnote | Read the footnote before calculating or comparing |
For an assumed “±50 ppm or ±3%, whichever is greater” specification at 1,000 ppm, the two terms are 50 and 30 ppm, so the larger is 50 ppm. For the additive form, the result would instead be 80 ppm. Those are different claims.
If a brochure says only “±50 ppm, ±3%” and the full document does not define the relationship, record the ambiguity and ask the supplier. A comparison worksheet is more useful with an explicit “formula not defined” entry than with a guessed number.
The same discipline applies at range boundaries. If bands meet at a stated concentration, follow the manufacturer’s boundary convention or request clarification. Do not interpolate between different accuracy bands merely because a graph would look smoother.
Two Manufacturer Examples Show Why Footnotes Matter
Sensirion SCD30: An Additive Sensor Specification
그만큼 SCD30 datasheet, version 1.0 D1, lists CO₂ accuracy of ±(30 ppm + 3% of measured value) over 400–10,000 ppm. At a 1,000 ppm comparison point, that formula evaluates to ±60 ppm.
The table’s default conditions include 25°C, 50% RH, 1,013 mbar and a specified continuous measurement configuration. Its accuracy footnote defines comparison with a reference, states a post-calibration population qualification, and discusses handling and recalibration. These details belong with the formula when interpreting the claim.
This is a sensor-module example. A desktop monitor built around that module needs its own documented system performance; its enclosure, implementation and use conditions are not established by quoting the module’s table.
Vaisala GMP252: A Piecewise Specification
Vaisala’s GMP252 specifications use concentration bands: ±40 ppm over 0–3,000 ppm, and ±2% of reading over 3,000–10,000 ppm. The accuracy footnote specifies 25°C and 1,013 hPa and identifies included repeatability and non-linearity. Calibration uncertainty is listed separately.
The document also separates start-up from the warm-up needed for full specification. These distinctions make it possible to ask which performance statement applies to a particular comparison and when.
The two examples demonstrate different specification structures. Comparing them as products requires matched measurement tasks and all relevant conditions, rather than comparing a module’s headline with a probe’s complete specification table.
A Reportable Range Is Not Necessarily an Accuracy Range
A digital output can represent a concentration outside the interval covered by a particular accuracy claim. An extended range may have a different allowance, or the manufacturer may provide no corresponding accuracy statement.
When reading a product page, separate three things:
- The range of values the output can report.
- The interval over which a stated measurement specification applies.
- The conditions under which that specification was established.
A display that reaches 10,000 ppm does not, by itself, establish its performance near 500 ppm. Conversely, good low-concentration performance does not demonstrate suitability for a high-concentration process.
For a procurement requirement, state the concentrations where performance matters. Then ask the supplier to identify the matching specification and its conditions. Avoid comparing an accuracy claim from one concentration band with an output-range claim from another.
Broader choices about sensing method, range and application are covered in Gasnose’s CO₂ sensor selection guide. Those choices should precede a comparison of accuracy numbers.
Environmental Conditions Belong in the Comparison
A specification at a stated laboratory condition and performance across a variable installation are different claims. Check what the instrument documentation says about temperature, pressure, humidity and compensation inputs.
Useful questions include:
- Is the accuracy specified at one temperature or across a temperature range?
- Is an additional environmental-dependence term given?
- Does compensation use an internal measurement, an external input or a configured value?
- Does the permitted environment exclude condensation?
- Are warm-up and stabilization conditions defined?
Do not silently add every number in a datasheet into one “total error.” Some terms describe different test conditions or already include other contributions. Others are expressed as typical dependence rather than guaranteed limits. A supplier should explain how the specification applies under the intended conditions.
Humidity deserves a separate review of response, sample composition and liquid-water exposure. See how humidity affects gas sensor readings for those distinctions.
Calibration State and System Integration Change the Question
For a complete monitor, ask when its specification applies: after factory calibration, after a prescribed stabilization period, with a particular baseline algorithm, or following an identified field procedure. “Factory calibrated” answers a different question from whether the installed system currently has documented performance.
An automatic baseline feature also has an operating assumption. Its presence does not establish that the installation satisfies that assumption. Keep algorithm configuration, calibration history and actual duty cycle in the comparison record.
At system level, identify the path between the sensor output and the displayed or logged value. That path can include sampling, filtering, averaging, compensation, communication and rounding. Ask whether the claimed performance covers the assembled device and the output used for the decision.
A useful document set includes the complete instrument manual, sensor identity where disclosed, applicable performance conditions, calibration requirements and any supplied verification record. Our calibration overview explains the broader measurement relationship; the actual device manual supplies its required method.
Why Two Monitors Can Disagree Without Identifying the Faulty One
Two monitors placed nearby are a useful observation, but neither becomes a reference simply because its display looks more stable or its price is higher. They may sample different air, apply different averaging, or carry offsets in opposite directions.
For a simple arithmetic example, suppose two devices each have a genuine ±100 ppm limit under matching conditions at a defined reference concentration. One could indicate 100 ppm above that reference and the other 100 ppm below it, producing a 200 ppm difference. This illustrates compatible limits; it is not a prediction of likely errors or permission to accept every disagreement.
An investigation should preserve location, timing, configuration and instrument-state information before interpreting the difference. If a traceable comparison is needed, use a suitable reference method and account for its uncertainty and the comparison procedure.
NIST’s guidance on measurement methods and calibration explains why uncertainty also depends on method implementation. Simply repeating readings does not address every contribution to a measurement result.
Do not treat a manufacturer’s ± allowance as a 95% confidence interval unless the document explicitly provides that interpretation. A statistical uncertainty calculation needs defined quantities, assumptions and relevant evidence.
A Practical CO₂ Monitor Comparison Worksheet
Use the same rows for every candidate. Mark missing information as “not provided” and unresolved notation as “needs clarification.”
| Item to record | Candidate A | Candidate B |
|---|---|---|
| Exact model and document revision | ||
| Sensor module, probe or complete monitor | ||
| Measurement quantity and output units | ||
| Reportable range | ||
| Range covered by accuracy claim | ||
| Exact formula and percentage basis | ||
| Calculated allowance at first relevant concentration | ||
| Calculated allowance at second relevant concentration | ||
| Temperature, pressure and humidity conditions | ||
| Included and separately stated contributions | ||
| Warm-up, compensation and calibration assumptions | ||
| Evidence for the assembled instrument |
This worksheet turns a loose “which is more accurate?” question into a documented comparison. It also exposes when two claims cannot yet be compared because their conditions differ.
For the final requirement, describe the measurement task and acceptable deviation under defined conditions, then agree how conformity will be assessed. The reference method, its uncertainty and the decision rule should be clear before a result close to a limit is classified.
자주 묻는 질문
What does ±(50 ppm + 3% of reading) mean?
It means the fixed and reading-dependent terms are added under the documented conditions. At a 1,000 ppm comparison point, 3% is 30 ppm, giving an 80 ppm allowance. Check the manufacturer’s definition of reading or measured value before applying it to a result.
Is a 1 ppm display more accurate than a 10 ppm display?
Display steps alone cannot establish that. Compare the accuracy specification, conditions and whole-device evidence. A finer display can be useful for logging without proving a smaller deviation from a reference.
Does 3% of reading mean three percentage points of CO₂?
No. At 1,000 ppm, 3% of that quantity is 30 ppm. Three percentage points of CO₂ concentration would instead be 30,000 ppm. Keep relative percentages separate from concentration expressed in percent by volume.
Is percent of full scale always worse than percent of reading?
No universal ranking follows from the notation. Translate both specifications into the same units at the relevant concentrations, then compare conditions. An additive fixed term can change which formula has the smaller allowance.
Does averaging improve accuracy?
Averaging can affect variation in a reported value, but it does not establish correction of a persistent offset. It also changes how rapid events appear in a record. Check the instrument’s filtering and reporting definitions.
Can a sensor datasheet serve as the monitor’s accuracy specification?
It provides component information. The complete monitor still needs evidence for its enclosure, implementation, sampling and output. Ask for the claim that covers the device being purchased.
Should two monitors show exactly the same number?
Exact agreement is not established by similar specifications. Differences require context: sample location, timing, filtering, conditions, calibration state and any reference comparison. Agreement alone also does not prove correctness.
Is the advertised ± value a confidence interval?
Only if the manufacturer defines it that way. A published accuracy allowance, a population qualification and an expanded measurement uncertainty are different statements. Keep their meanings separate.
Choose the Specification That Fits the Measurement Task
Start with the concentrations and conditions that matter. Read the complete formula, calculate its allowance in ppm, and retain the relevant footnotes. Then check the calibration assumptions and evidence for the assembled instrument.
That sequence provides a stronger basis for selection than the smallest number in a headline. It also leaves a clear record of what the instrument is expected to do—and which questions still need an answer from the supplier.
Technical References
- Sensirion SCD30 datasheet: additive CO₂ accuracy specification and associated conditions.
- Vaisala GMP252 specifications: concentration bands, calibration uncertainty and operating conditions.
- NIST TN 1297, Appendix D1: Terminology: distinctions among accuracy, repeatability and uncertainty.
- NIST TN 1297, Appendix D4: Measurement methods and calibration: method implementation and uncertainty.