
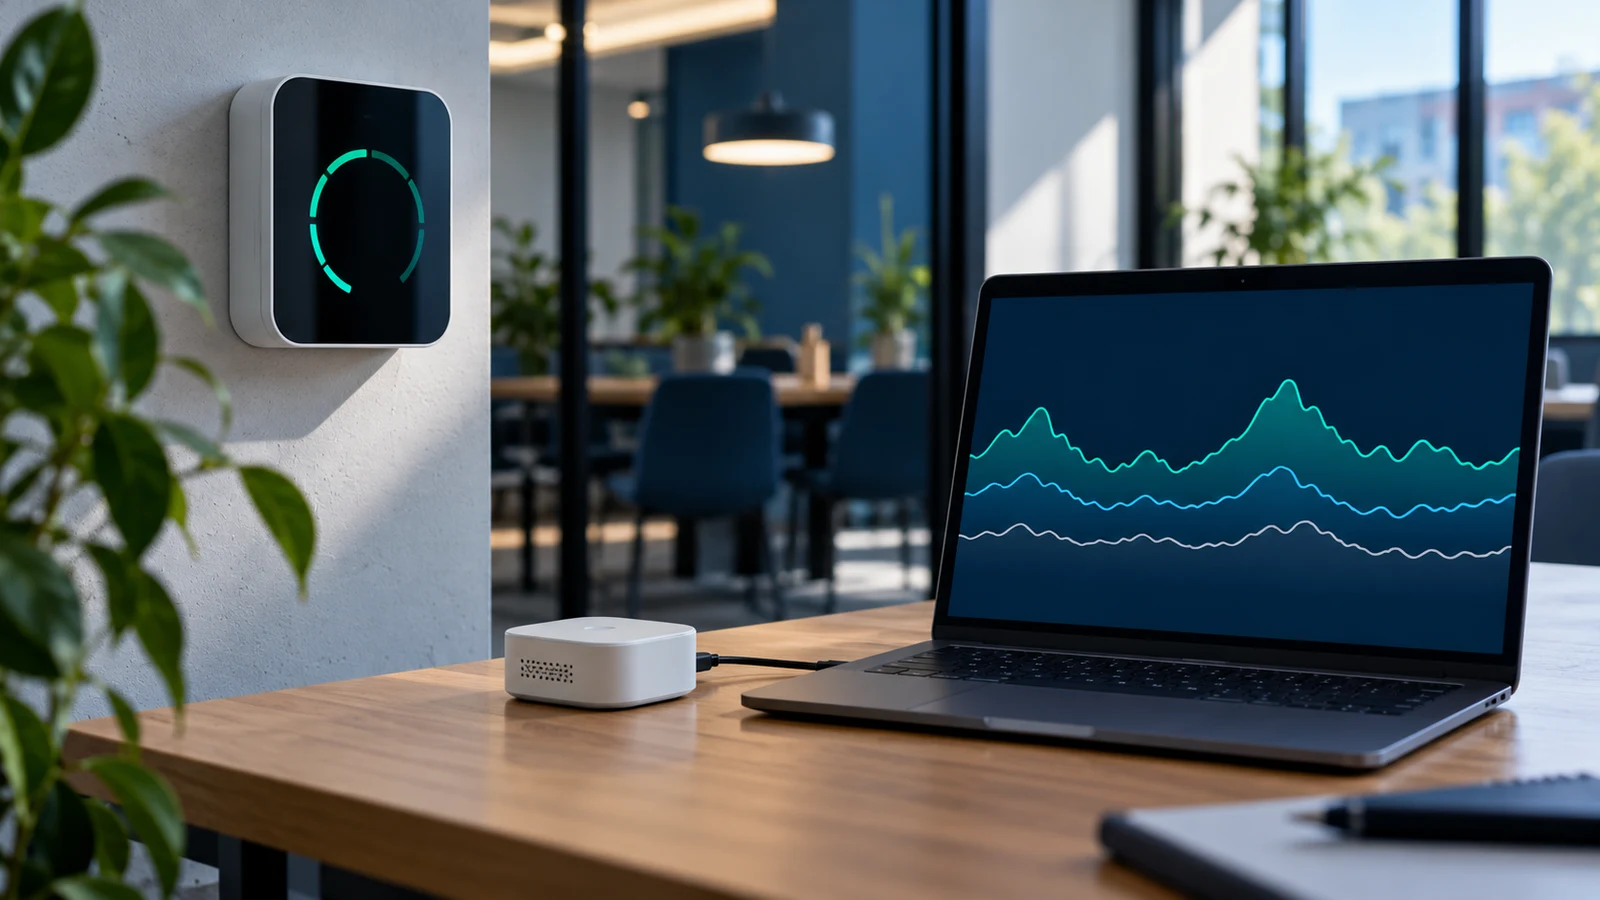
Choose a live CO₂ display when someone must see the current condition and respond locally; choose a data logger when the question depends on what happened over time. Many instruments do both, but a screen, a sensor update and a stored record are separate functions. A screen can show a current value without retaining it; a logger can preserve a useful history while offering little immediate feedback. For building control, process monitoring or alarms, verify a third path: how the finished device communicates a valid measurement and fault state to the system that acts on it.
Start with the decision. “What is the room reading right now?” can be answered by a well-placed display. “Which meeting schedule produces a repeatable rise?” needs a time-stamped series and context. “Did a brief excursion occur during a process step?” needs a sensor and record fast enough to resolve that event. Recording more points than the sensor can physically resolve adds file size, not information.
The three times that are easy to confuse
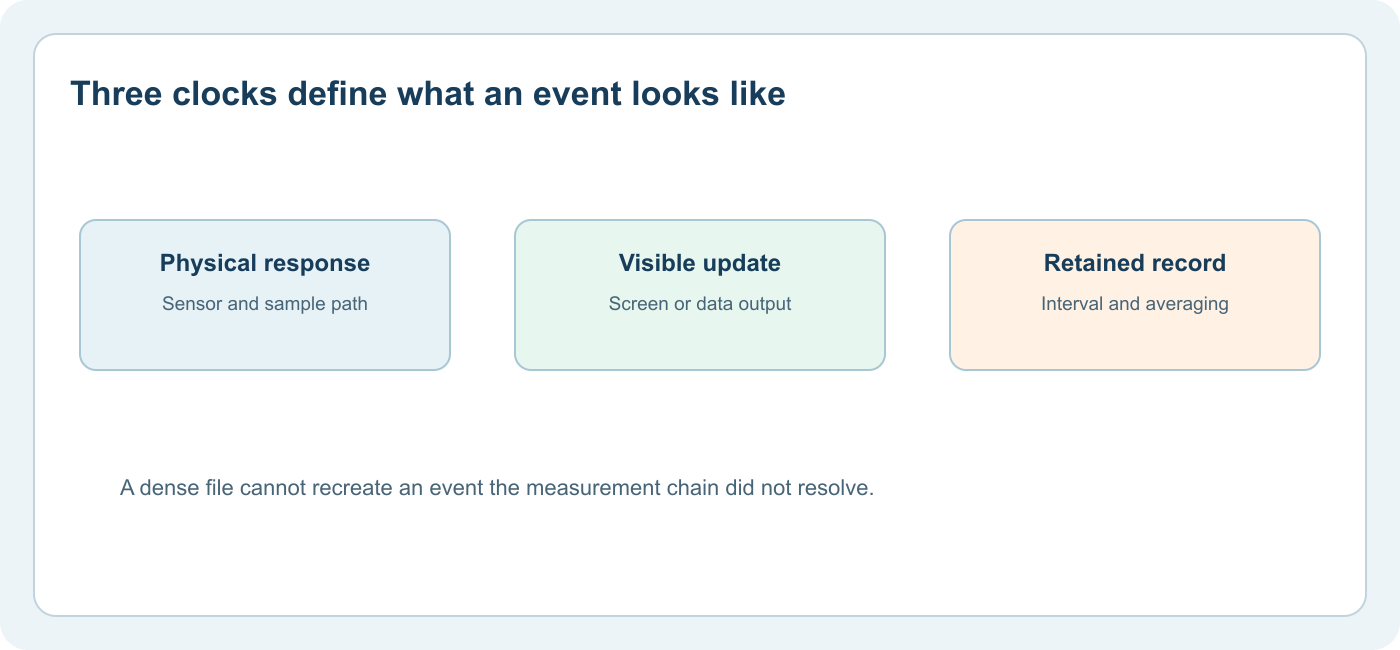
Every candidate has at least three time scales. Sensor response describes how the measurement chain reacts to a change under defined conditions. Display or communication update describes how often a new result appears or is sent. Logging interval describes how often a value is retained. They can be equal, but often are not. Processing, averaging, tubing, enclosure exchange and wireless transmission may add delays.
For a documented component example, Sensirion's SCD4x data sheet specifies response and measurement conditions for that sensor family. A finished monitor built around a sensor needs its own evaluation because airflow, filtering and software change what the user sees. As a finished-device example, Aranet's documentation describes selectable measurement intervals and a default interval for the Aranet4; these settings belong to that product, not to all CO₂ loggers. Read each instrument's manual rather than transferring one model's timing to another.
Imagine a hypothetical CO₂ change lasting two minutes. A device that stores one five-minute average may show that the period was somewhat elevated but cannot reconstruct the peak's exact shape. A device storing one-minute samples may preserve more temporal detail, provided its sensor and filtering respond quickly enough. Neither record is a substitute for a fast, appropriate alarm system if the task is immediate hazard response. This is a timing example, not a claim about a specific instrument or exposure threshold.
What a live display does well
A visible local display lets an occupant, technician or operator see a reading without opening an app or retrieving a file. It can make changes following occupancy or ventilation adjustments tangible. For this to work, the value should identify CO₂ and its unit, show when it was last refreshed, and make warming, out-of-range or fault states clear. A colored light can be useful as a prompt, but the underlying concentration and the color rule should remain accessible.
The display must also represent the right place. CDC's ventilation FAQ notes that air currents from HVAC or windows can make a fixed wall-mounted CO₂ reading unrepresentative of the occupied zone. A highly visible monitor beside a supply diffuser may be easy to see yet poor for the intended question. Placement and interpretation are part of the instrument decision, not accessories.
Local feedback does not require claiming that one value defines safe air. EPA says indoor CO₂ can inform ventilation but needs careful interpretation. ASHRAE likewise cautions against treating a fixed CO₂ number as a complete indoor-air-quality pass/fail rule. A display should support a known action and context, not imply it measures pollutants it does not detect.
What a logger makes possible
A retained series can reveal whether a rise is isolated, repeated or linked to a schedule. It can compare occupied and unoccupied periods, show the effect of a ventilation change, and document whether a measurement was actually available at the time in question. The record needs timestamps, units, device identity and location notes. Without these, a good-looking chart can be impossible to interpret later.
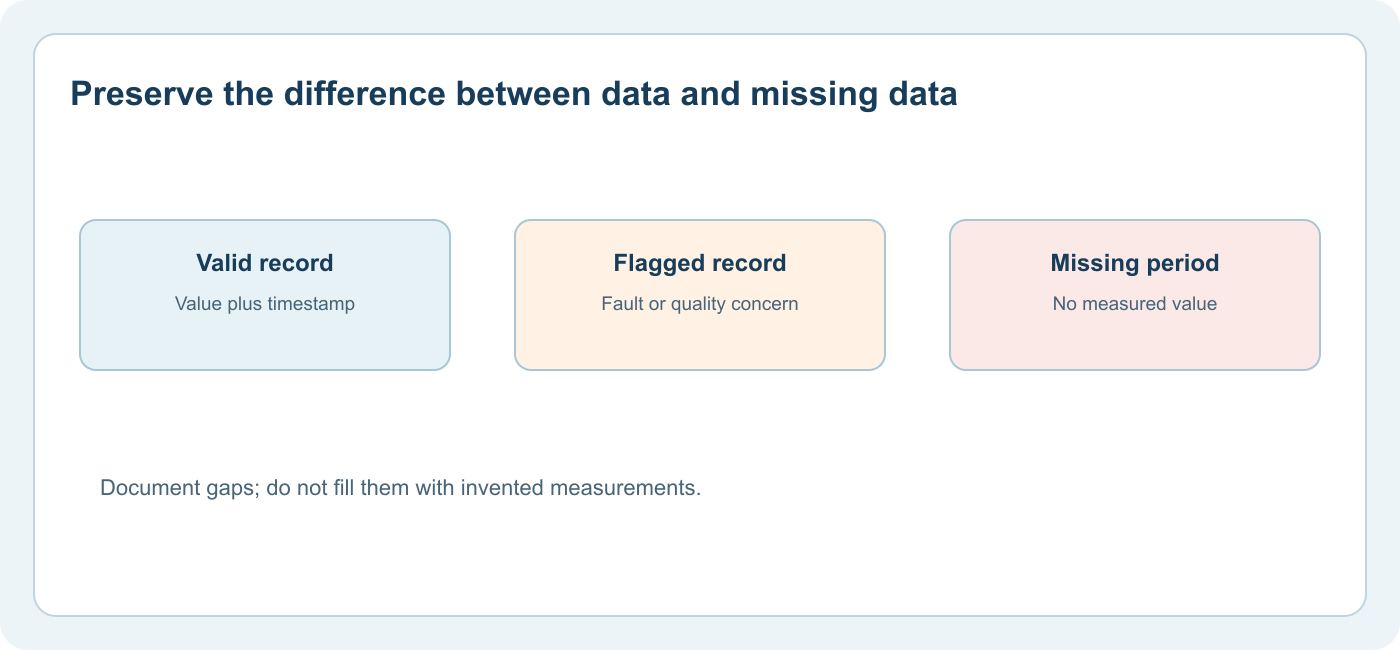
Logging also enables data-quality review. EPA's Enhanced Air Sensor Guidebook advises users to inspect time-series plots, flag questionable values and recognize missing data. A gap caused by power loss or communication failure should remain a gap, not be silently replaced by a straight line that appears measured. For a report, note the expected number of records, the valid number, the excluded records and why they were excluded. The valid fraction matters when calculating an average.
For example, a logger set to one-minute intervals would expect 60 records in an uninterrupted hour. If several are missing, the average of available samples may fail to represent the whole hour, particularly if the missing period coincides with the event. This is arithmetic, not a universal acceptance criterion. The data-quality rule should be chosen for the purpose before the record is interpreted. EPA's collocation tool explicitly addresses time alignment, longer averages, completeness and missing periods in sensor comparisons.
Choose an interval from the event, not the menu
Write down the shortest change that matters, the longest period that must be studied and the amount of storage or transmission available. The sampling interval should be short enough to represent the meaningful change, but the sensor's own response and device averaging must be checked first. If the decision concerns occupied-room trends over a school day, a very dense raw stream may be unnecessary. If it concerns a rapid process event, a leisurely interval can erase useful detail even when the chart looks smooth.
Ask what each stored point means. Is it an instantaneous reading, a moving average, a block average or a maximum within the interval? Is the timestamp the start, midpoint or end of that interval? Does changing the device interval alter earlier stored data? Some devices do process or aggregate history when settings change, so use the exact manual. “One point per minute” without a definition of the point is not a complete data specification.
Time stamps need similar attention. Record the time zone, daylight-saving behavior where relevant, clock synchronization method and the way the device handles restart. In a multi-device study, align clocks before comparing channels. A CO₂ peak apparently preceding an occupancy change can simply be a clock mismatch. A wireless dashboard may show upload time rather than measurement time; verify which one is exported.
Retention, export and ownership of the data
Calculate retention from the actual record format
A useful capacity estimate starts with the number of channels, records per hour, expected deployment duration and bytes per exported record. At a one-minute interval, one channel produces 60 time points per hour before timestamps, status fields and file overhead are added. More frequent sampling multiplies the record count; extra channels and metadata enlarge each record. The device may compress, overwrite or aggregate older history, so a simple calculation is only a planning check. Ask the vendor for the documented retention behavior at the chosen interval and channel configuration. If the study must survive a week without contact, test that recovery path before deployment.
Retention is distinct from upload. A device may keep measurements locally while the network is offline and synchronize later, or it may lose untransmitted samples. “Cloud dashboard available” does not answer which behavior applies. Confirm the data route with a short controlled disconnect, then inspect whether recovered records carry original measurement timestamps or only upload times.
“Stores data” can mean an on-device history, a phone application cache, a cloud account or a downloadable file. Specify how long records remain available, whether older values are overwritten, what happens when the network is down, and whether export preserves timestamps and quality states. Ask whether a subscription, gateway or proprietary account is required. If a school or workplace is collecting data, decide who can see or remove it and how installation locations are documented.
Also check power. Battery life may change with measurement frequency, backlight, wireless transmission and ambient conditions. A wall display with continuous external power may be easier to observe, while a battery logger can be easier to place temporarily. The best location for the sensor should lead the deployment; power and communications should then be designed around that location rather than forcing an unrepresentative placement.
When multiple parameters are recorded, retain the name and status of each channel. A CO₂ value, PM₂.₅ estimate, relative humidity and VOC index cannot be merged into one unlabeled “air quality” time series. Our single-gas versus multiparameter comparison explains channel-by-channel evidence; the concentration-versus-score guide explains why a score needs a documented mapping method.
A selection table for common tasks
| Task | Prioridad | Usually useful configuration | Verify before use |
|---|---|---|---|
| Occupant sees current room trend | Legible, current local feedback | Display with clear CO₂ value and status | Placement, update age and interpretation of colors |
| Compare a week's meeting patterns | Comparable time series | Logger, with or without display | Clock, interval, export, data gaps, occupancy notes |
| Commission ventilation controls | Reliable system input and trend | Instrument with defined control output and record | Device-level response, failure state, integration and calibration |
| Investigate short process changes | Event timing and sample suitability | Instrument/logger selected for the event | Sensor response, sample path, averaging and excursion range |
| Immediate safety warning | Appropriate safety function | Purpose-designed system for the application | Site risk assessment, applicable rules, alarm behavior and maintenance |
The table does not rank products. It shows which evidence the decision needs. A single device can meet more than one row if its documented functions do; a device merely showing the relevant icon may not.
Compare the finished device, not only its sensor chip
A component specification is a starting point. The finished display or logger adds a housing, gas inlet, supply, clock, storage, interface and possibly a cloud service. Ask for the finished product's stated response, fault indications and environmental ratings. If the application uses an external probe or sample line, specify that arrangement in the test. Our sensor-module versus complete-monitor guide details this boundary.
For long-term work, define a verification routine. How is the device checked before and after deployment? What calibration or adjustment procedure is supported, and under what gas and environmental conditions? Vaisala's GMP252 guide illustrates the importance of device-specific compensation and calibration settings. Do not assume that a logged history remains accurate indefinitely just because the initial factory calibration was documented.
El CO₂ requirements worksheet provides a place to state range, sample location, timing, fault behavior and acceptance evidence. Complete it before deciding whether the best deliverable is a screen, a CSV file, a building-system signal or a combination.
Frequently asked questions
If a monitor has a graph in its app, is it a suitable data logger?
Possibly, but check retention, export, timestamp meaning, missing-data behavior, clock handling and whether data remain available without the app or account. A graph alone does not establish that the record can support your decision.
Does a one-second logging interval give one-second CO₂ response?
No. Logging frequency and physical response are different. Sensor response, sampling path and smoothing can be slower than the storage interval, in which case many records may contain highly correlated or filtered values.
Should I display the latest value or an average?
That depends on the decision and noise of the measurement. An average can make a trend clearer but can delay or hide short changes. Label the quantity and averaging period, and do not use a smoothed display as proof that a short event did not occur.
Can historical CO₂ alone prove that a building met every air-quality requirement?
No. It documents one measured quantity at particular locations and times, subject to instrument and data-quality limits. Other pollutants and environmental conditions require their own evidence, and CO₂ interpretation depends on occupancy, ventilation and sampling context.
Fuentes
- US EPA, Enhanced Air Sensor Guidebook — monitoring design and data handling.
- US EPA, Collocation Macro Analysis Tool — time alignment, averaging and missing records.
- Sensirion, SCD4x data sheet — component response example.
- Aranet, Aranet4 default settings — example finished-device measurement interval.
- CDC/NIOSH, Ventilation FAQs — fixed-monitor placement context.
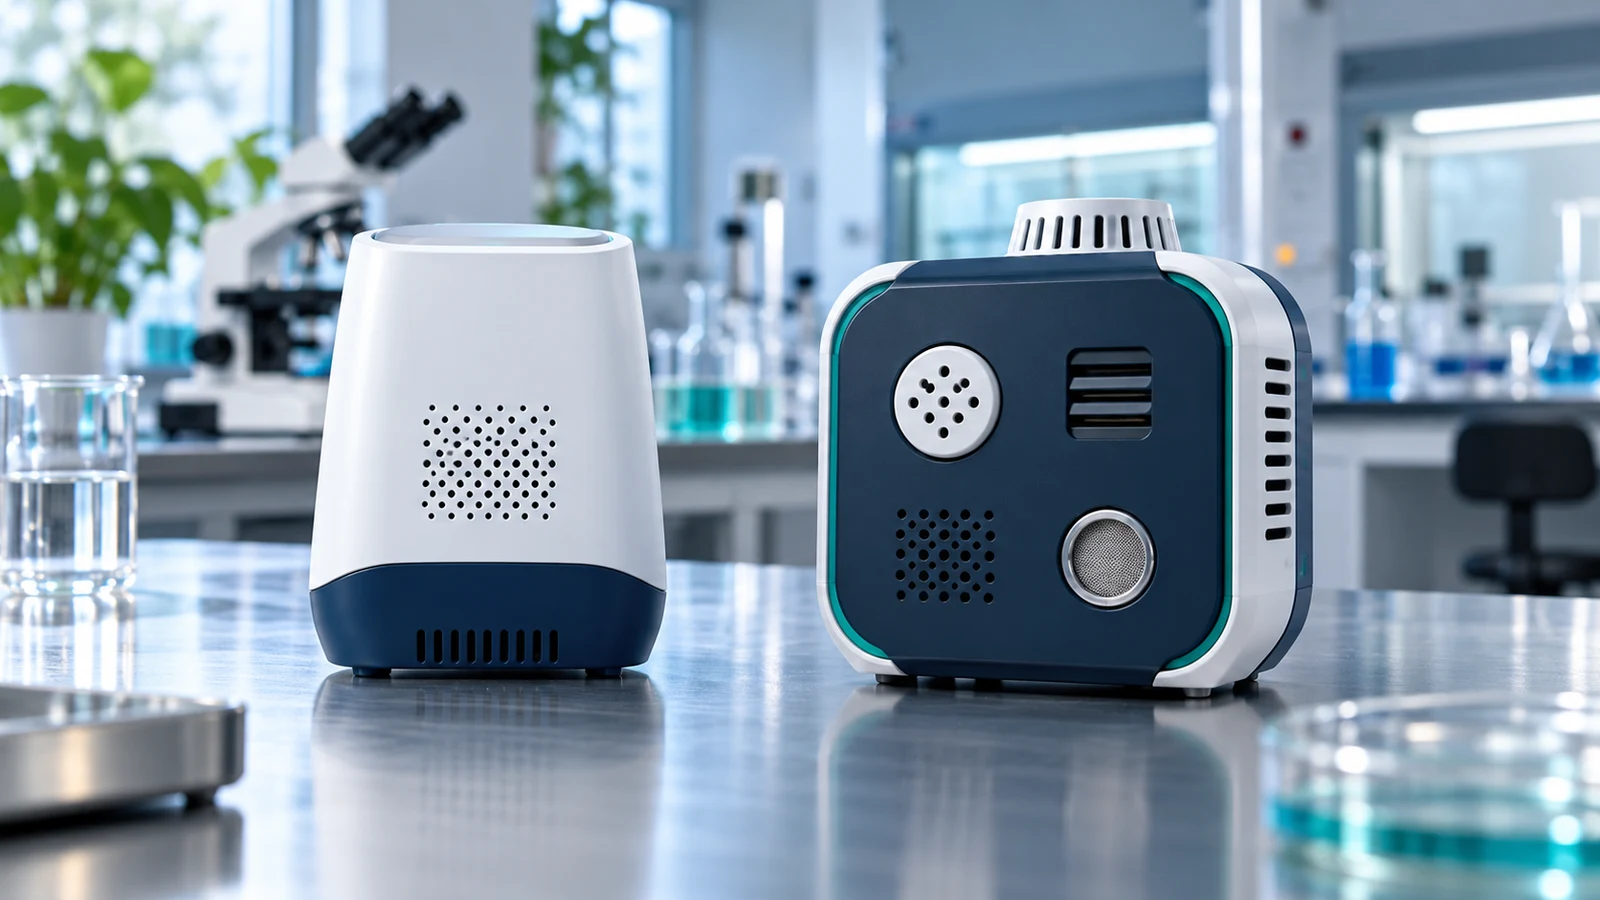
Single-Gas vs Multiparameter Monitors: Compare the Channels, Not the Screen
Compare single-gas and multiparameter monitors by the evidence for each channel, sample location, data quality, maintenance and intended use.
Leer más
A CO2 Measurement Requirements Worksheet: Define the Job Before Choosing a Sensor
Build a practical CO2 measurement brief covering purpose, sample, range, timing, data, faults, maintenance and acceptance evidence before selecting an instrument.
Leer más
Pureza de CO2 frente a concentración de CO2 ambiental: dos trabajos de medición diferentes
La pureza del suministro de CO2 y las ppm de CO2 ambiental describen diferentes muestras y analitos. Descubra por qué los monitores de habitaciones no pueden certificar lotes de gas y los certificados de pureza no pueden describir el aire de la habitación.
Leer más
Puntuación de calidad del aire frente a concentración de gas: lo que realmente puede decirle un monitor interior
La concentración de un contaminante es una medida nombrada; una puntuación de calidad del aire es un mapeo. Compare las puntuaciones en interiores con el AQI oficial en exteriores de EE. UU. e inspeccione los canales sin procesar de un monitor.
Leer más
Sensores de CO frente a CO2: por qué un instrumento de doble gas necesita dos canales de medición
Los sensores de CO y CO2 miden diferentes gases. Aprenda cómo verificar cada canal, su principio de detección, rango, calibración, ruta de muestreo y propósito del dispositivo terminado.
Leer más
Lecturas de CO2 húmedo versus seco: por qué la base de la muestra cambia el número
Las ppm de CO2 del aire húmedo y del aire seco pueden diferir porque el vapor de agua cambia el denominador de la fracción. Aprenda la conversión condicional y qué registrar en un sistema de muestreo de gas.
Leer más