
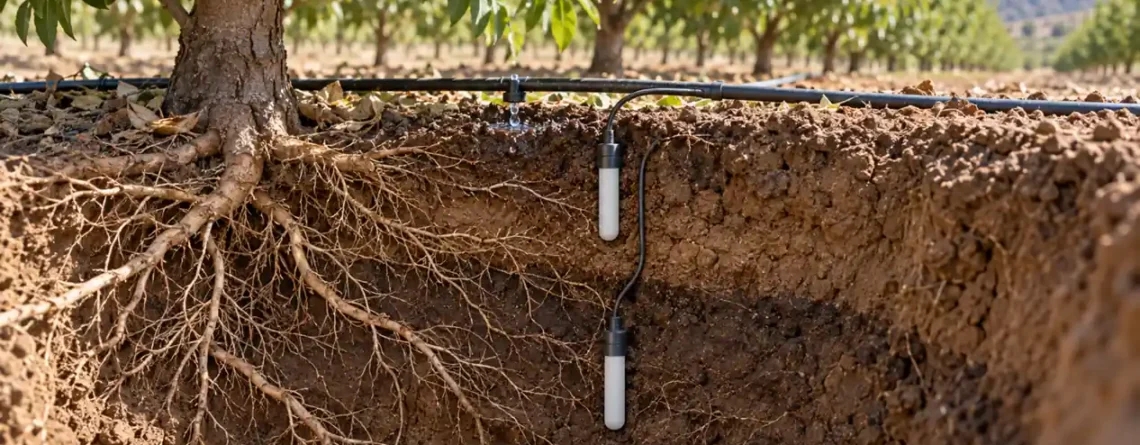
Choose a soil moisture sensor by the irrigation decision you need to make, then by the soil property it measures. Volumetric water content (VWC) sensors estimate how much of the soil volume is water. Soil water potential or tension instruments indicate how strongly water is held and therefore how difficult it is for roots to extract. Neither is automatically a universal “percent wet” reading. Useful irrigation scheduling also requires representative sensor placement, soil-specific interpretation and checks against crop response.
This guide explains the practical distinction between dielectric probes, tensiometers and other potential sensors; how to place them through the active root zone; what calibration can and cannot fix; and how to turn readings into a defensible irrigation decision. The right system may be a modest pair of sensors with a trustworthy installation rather than a dense network of probes in unrepresentative soil.
Start with a decision, not a sensor catalog
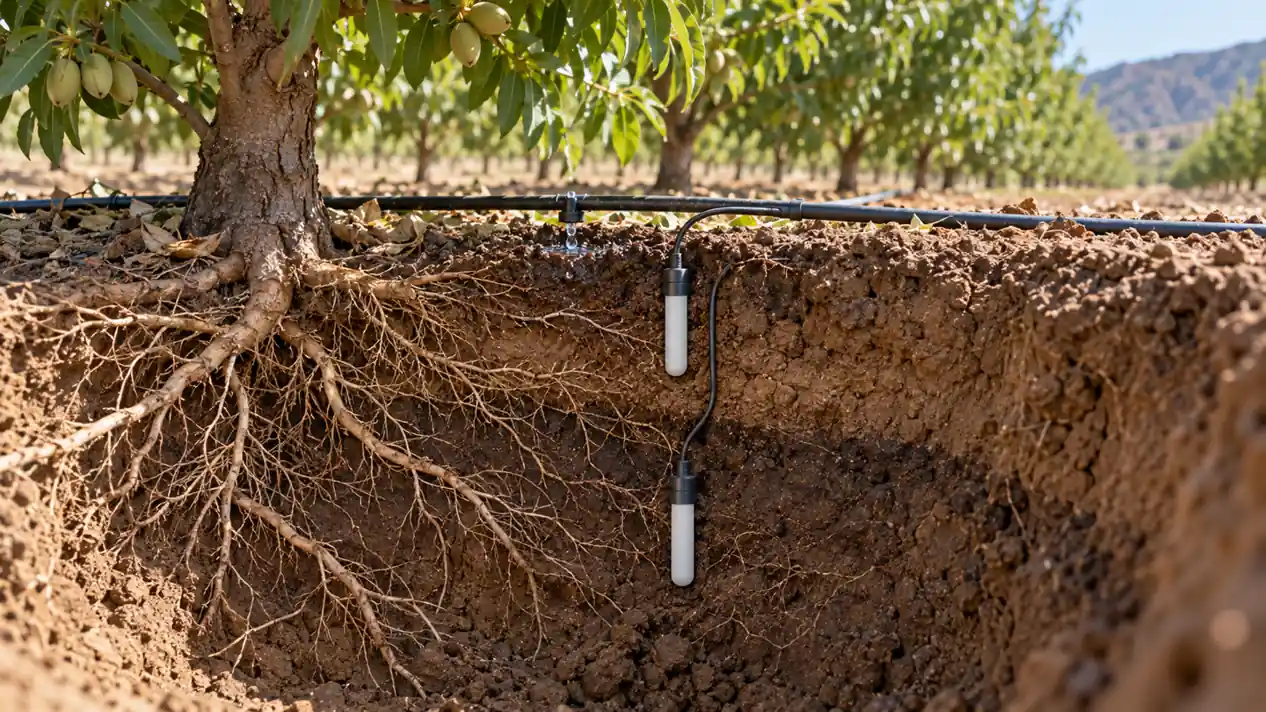
An irrigation manager may ask when to start watering, how long to run a set, whether water reached the deeper root zone, or whether a leaching event moved below it. Each question points to different positions and sometimes different measurements. A single shallow probe can show an irrigation pulse but cannot reveal whether water reached deeper roots. A deep probe can reveal percolation but might miss early stress near active roots.
Write the decision in operational terms: “Start the next irrigation before the upper active root zone becomes too dry,” or “Stop applying water once the lower monitored layer responds, provided the crop and system require that.” Then identify the crop, growth stage, rooting depth, soil layers, irrigation method, wetting pattern and management zone. Thresholds belong to that context; a number copied from another field or product brochure is not a reliable set point.
را University of Minnesota Extension guide describes how soil water content and water potential support scheduling. The University of California ANR overview also notes the importance of calibration and soil conditions. These extension materials are useful because they link the instrument to a field decision rather than treating a displayed percentage as self-explanatory.
What VWC and soil water potential actually mean
Volumetric water content is the volume of water divided by the bulk volume of soil, commonly expressed as a fraction or percentage. A VWC of 0.25 m³/m³ means that, in the measured volume, approximately one quarter of the volume is water. It does not by itself tell you whether the crop is under stress. A sandy soil and a clay soil can hold similar fractions of water while presenting very different water availability to roots.
Soil water potential describes the energy state of water in soil. The matric component reflects attraction to the soil matrix and is often discussed as suction or tension. As soil dries, water generally becomes more strongly held. Tensiometers measure this suction over their operating range by allowing water in a porous cup to equilibrate with surrounding soil. Other potential sensors infer the condition of an equilibrating material. Their outputs and limitations differ, so check the exact instrument and its units.
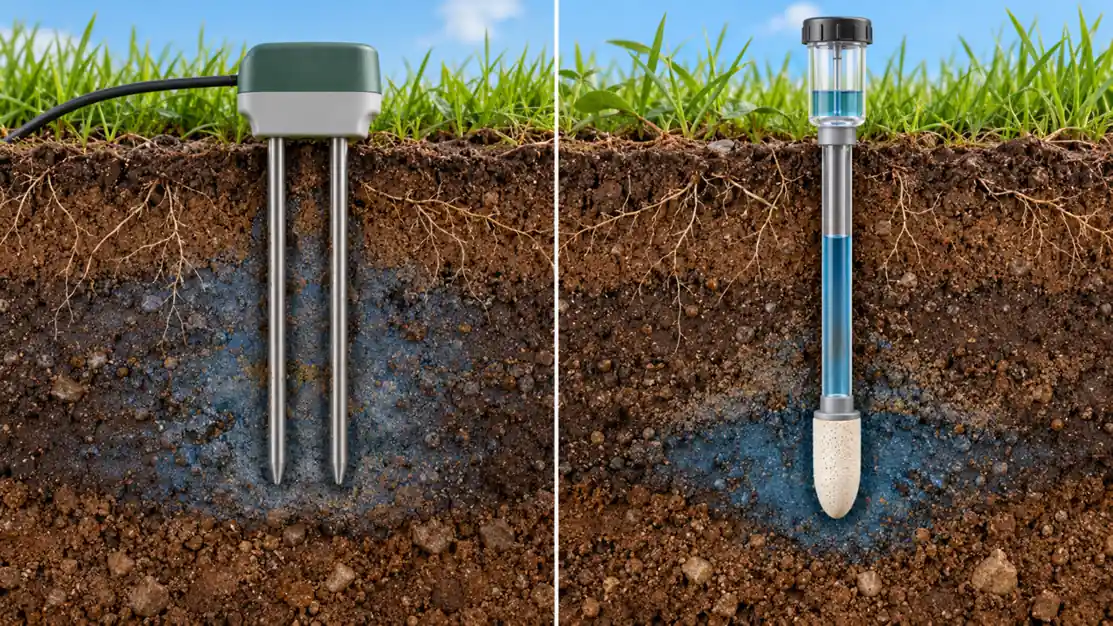
These two measurements answer related questions. VWC helps track storage and movement of water in a specific soil volume. Potential helps indicate how available that water is under the local soil conditions. A soil water retention curve can connect content and potential for a particular soil, but there is no universal curve that works across textures, structure, salinity and management histories. The Wyoming Extension comparison is a useful primer on the difference; field decisions still need local context.
| Sensor family | What the reading represents | Useful strength | Main limitation to check |
|---|---|---|---|
| Dielectric capacitance or FDR | Estimate of VWC from soil dielectric behavior. | Continuous trend; many logger and telemetry options. | Contact, salinity, temperature and soil-specific calibration can affect accuracy. |
| Time-domain reflectometry or related transmission methods | Estimate of VWC from signal propagation in soil. | Well-established physical measurement basis. | Installation geometry, electronics and soil conditions still matter. |
| Tensiometer | Soil water tension through a water-filled porous cup. | Directly relates to the effort required to draw water in its usable range. | Requires water-filled maintenance and has a limited dry-range response. |
| Granular-matrix or other potential sensor | Potential inferred from equilibration with a porous medium. | Can be useful where tension information is desired. | Response, calibration and soil contact are model-dependent. |
None of these families is “best” across every field. A decision near wet conditions may favor one instrument; a broader dry range or low-maintenance remote site may favor another. Evaluate how frequently readings are needed, whether telemetry and power are available, and whether the crew can maintain the instrument over the season.
Why dielectric readings can be wrong even when the logger works
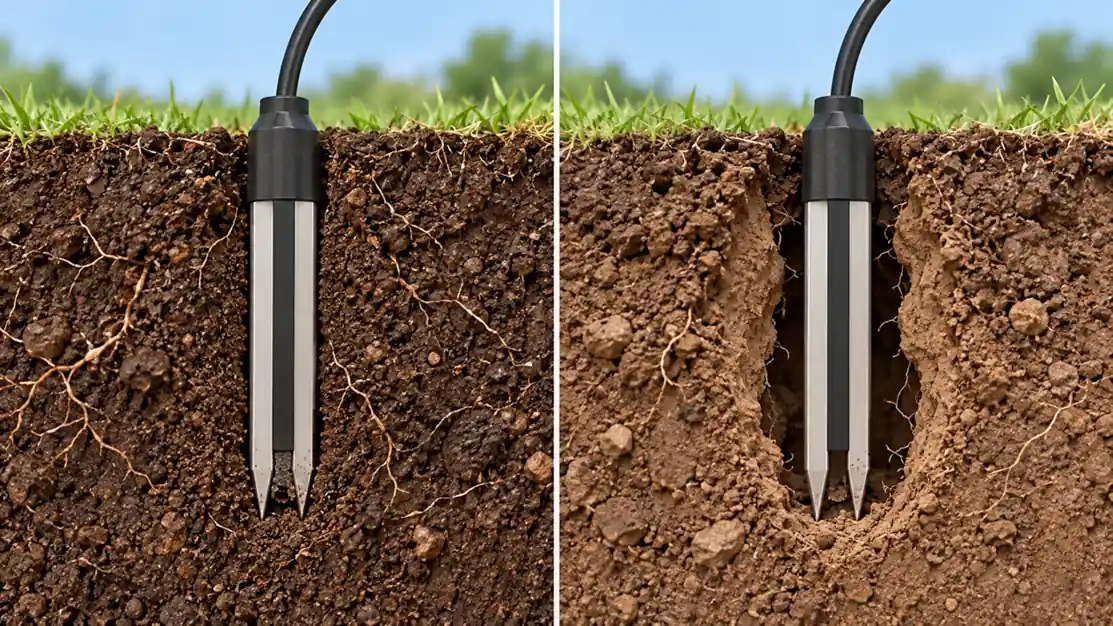
Water has a much higher dielectric response than most dry soil components, so dielectric probes estimate water content from an electrical measurement. The probe is calibrated to translate that electrical response to VWC. Soil texture, bulk density, stones, organic matter, salinity, temperature and the quality of contact around the rods can change the relation. A gap next to the probe may make it see more air than the surrounding soil contains. Pushing rods into a disturbed hole may make it see loose, unusually wet or compacted material.
Manufacturer factory calibration is useful as an initial estimate, but a precise absolute VWC claim may require site-specific calibration. The North Carolina State Extension calibration guide explains the value of checking a device against samples from the same soil. The Oklahoma State Extension guide also discusses salinity and system-level factors. The need for calibration depends on the decision: a stable trend may be sufficient for detecting wetting-front movement, while a water-balance calculation needs more confidence in the absolute number.
Electrical conductivity or fertilizer concentration can influence some dielectric sensors. If readings shift abruptly after fertigation with no plausible water movement, compare with other depths and a direct field check before changing irrigation. Do not assume every jump is salinity; real water redistribution, poor connections and temperature changes can look similar. Use model-specific guidance for salinity limits and compensation.
Plan a representative root-zone installation
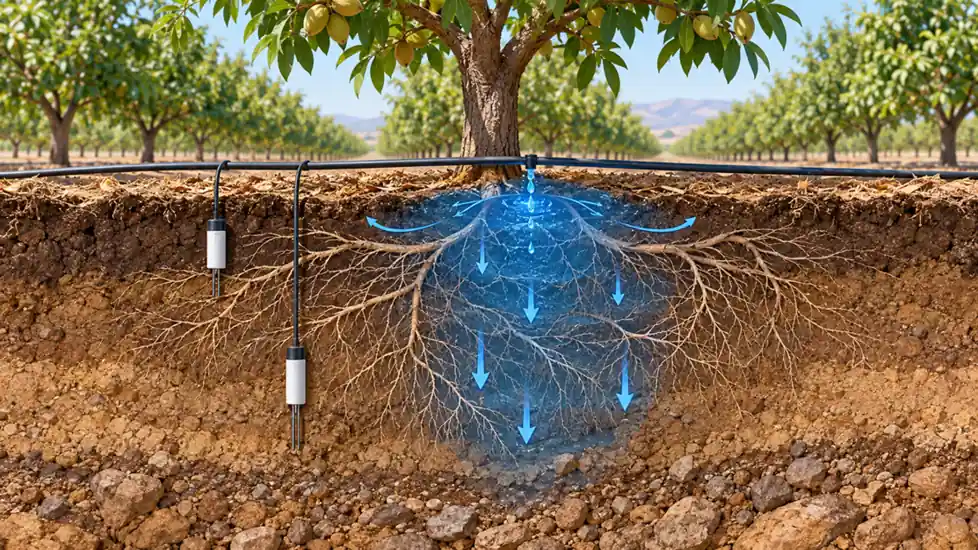
Rooting depth is not a fixed number throughout a season. Soil layers, compaction, irrigation pattern and crop growth determine where active water uptake occurs. Place sensors where they can answer a question about that root zone, and document their distance from plants, emitters, furrows, drains and field edges. A probe in a wheel track or persistent low spot may give a consistent number that represents the wrong management area.
For a drip-irrigated row, the wetting bulb may be narrow and nonuniform. A probe beside an emitter can read wet while roots farther away are dry. A probe outside the wetted zone can read dry even though the principal root volume is adequately irrigated. Consider multiple lateral positions in an initial assessment. For sprinkler or pivot systems, note where application uniformity differs, including overlaps and end zones. Sensors should sample a representative management zone, not merely the easiest place to bury a cable.
Use more than one depth when the decision requires it. A shallow depth can show whether irrigation entered the upper active zone. A deeper depth can show whether water moved through the profile or remained too shallow. Exact depths should follow the crop, season and soil layers. The University of Arizona Extension selection guide emphasizes matching hardware and data collection to the application; sensor layout is part of that match.
Installation details that change the data
Install a probe according to its manufacturer’s geometry: vertical, horizontal or at a specified angle. Prepare a hole or access tube without creating a large void around the sensing volume. Avoid bending rods or allowing a large stone to prevent good contact. Backfill carefully and record the installation method. Protect cables from machinery, rodents and water ingress. Route a cable so that runoff does not follow it into the sensor body or connector.
For tensiometers, use the maker’s filling, de-airing, porous-cup contact and service procedures. Air in the water column can compromise response. Check whether the instrument remains in its valid operating range as soil dries, and do not interpret a failure to respond as proof that the soil is stable. For buried dielectric devices, note that removal and reinsertion can change contact; mark the intervention in the dataset.
After installation, record an initial wetting and drying cycle if feasible. A sensor trace should respond at plausible times relative to irrigation or rain and to its depth. A shallow trace might rise first, followed by a deeper trace later. If the deep sensor responds before the shallow one, examine preferential flow, location, wiring labels and timestamps before treating the pattern as a new soil phenomenon.
Turn readings into an irrigation rule
The familiar concepts of field capacity and permanent wilting point are useful reference ideas, but they do not provide a single universal field threshold. Field capacity depends on how drainage and soil profile are defined; crop stress depends on roots, growth stage, atmospheric demand and soil conditions. A management-allowed depletion rule or a tension threshold needs local agronomic support and periodic revision.
Start with a baseline from the actual field. After a representative irrigation or rain and subsequent redistribution, observe the sensor trace as the crop uses water. Compare measurements with soil feel, root-zone inspection, crop appearance and, when available, evapotranspiration or water-balance information. Identify the point at which an irrigation decision would have been helpful. Then define a trigger and a check that prevents a single noisy observation from starting or extending a set.
| Pattern in two depths | Plausible interpretation | Check before acting |
|---|---|---|
| Shallow wet, deep unchanged after irrigation | Water may not have reached lower active roots, or deeper sensor may be outside the wetted zone. | Confirm lateral placement and soil wetting with a field inspection. |
| Both depths wet for a long period | Water application may exceed immediate crop use, or drainage is slow. | Check soil texture, drainage and plant response. |
| Shallow dries quickly, deep stays wet | Surface evaporation and root distribution may differ by depth. | Do not use one depth as the whole-root-zone average. |
| Sudden VWC change after fertigation | Water, salinity response or electrical issue may be involved. | Compare nearby sensors and inspect connections/soil. |
| Flat trace through rain or irrigation | Sensor may be poorly located, disconnected or saturated at its measurement limit. | Verify event location, diagnostics and sensor response. |
The rule should remain explainable to an operator: which depth triggers a start, which depth indicates adequate penetration, and what other field observation can override a sensor. Keep the raw data and the calculation separate so a later adjustment of thresholds does not erase the original record.
Calibrate the decision, not only the instrument
Instrument verification asks whether the sensor and logger report plausibly. Agronomic validation asks whether acting on the number improves irrigation decisions. Both matter. A sensor can match a laboratory soil sample yet sit outside the effective root zone; conversely, a biased absolute VWC trace can still reliably show wetting and drying if its installation is stable and the decision uses a local baseline.
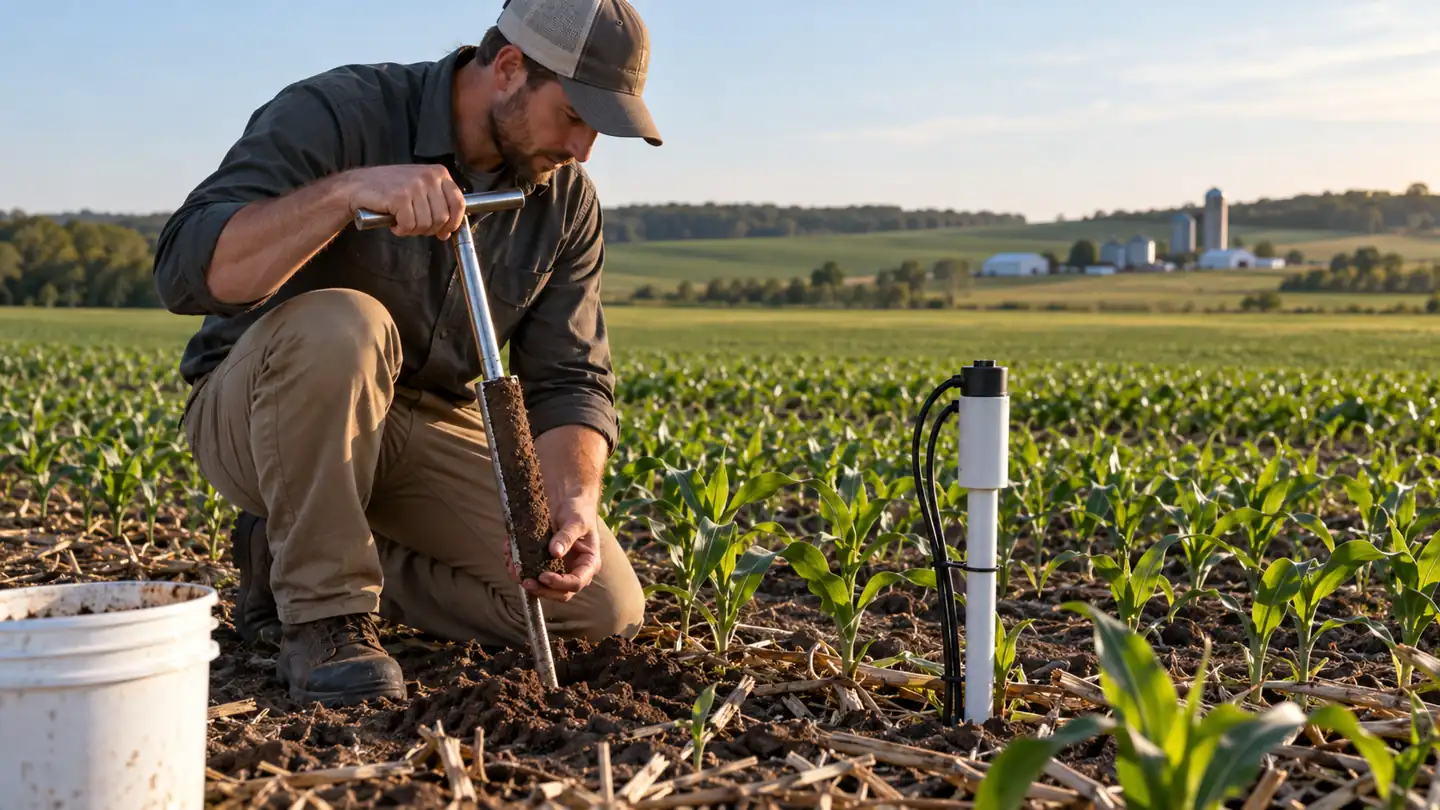
For a soil-specific VWC check, collect samples close to the sensor’s actual sensing volume without disturbing the installed device. Follow a suitable gravimetric procedure and determine bulk density where conversion to volumetric content requires it. Compare under more than one water condition. Record sampling depth, date, soil temperature, recent irrigation and salinity if relevant. A few points can show gross disagreement; they are not automatically enough to establish a robust calibration across the season.
For tension instruments, check physical condition, filling and response to wetting under the manufacturer’s instructions. Pair readings with field observations. A performance target should be based on the operating question: for a start-of-irrigation trigger, the cost of a missed dry condition may differ from the cost of an extra watering. Accuracy claims from a controlled laboratory setting should not be copied into a field acceptance rule without allowing for spatial variability.
Data logging and telemetry deserve the same attention
Choose recording intervals that capture the irrigation events you care about without filling storage unnecessarily. Synchronize timestamps with valves, rainfall and pump logs. Record the sensor ID, depth, location, calibration version and replacements. A “soil moisture percent” chart with no location or measurement basis can become unusable when the original installer is gone.
Remote sites need adequate power, enclosure protection, communications and a plan for missing data. Do not automatically interpret a missing packet as a dry sensor. Set a data-quality status and define what operators do when the network is down. A seasonal inspection of cables and connectors can prevent long periods of false confidence.
A practical selection worksheet
Represent field variability without losing the decision
An irrigated field is not one uniform bucket. Soil depth, texture, compaction, slope, crop vigor and application uniformity can vary enough that a single station describes only its immediate surroundings. First divide the field into management zones that would realistically receive different irrigation decisions. Then choose a location that represents each zone, including a place that tends to become dry early if protecting that area is the objective. A sensor in the easiest location to cable may be convenient but unrepresentative.
Replicates are useful when the cost of a wrong decision is high or a management zone is especially variable. Two nearby sensors that disagree consistently can reveal a placement or installation issue. Several sensors that diverge only during irrigation may reveal nonuniform water application. Replication does not need to be permanent everywhere; a temporary survey can help identify reliable permanent stations.
When comparing zones, keep probe depths and lateral positions relative to plants and emitters consistent. Otherwise, a difference between sensors may reflect geometry rather than soil water status. Photograph and map the installations so that tillage, harvest and future equipment changes do not erase the context of the data.
Connect soil data to the applied water
Sensor traces become more useful when paired with irrigation volume, start and stop times, rainfall, crop stage and weather demand. If the upper probe responds to every irrigation but a deeper probe never does, compare the applied water depth with the expected wetting volume and inspect the soil. If both depths remain wet after a large event, reconsider the next application and check drainage. The sensor does not calculate application efficiency by itself, but it can test whether a planned water movement occurred.
Do not infer the whole-field water balance from one point without accounting for spatial variation. A point sensor observes a small volume; meter readings measure delivered water at a different scale. Reconcile the two using a model of the irrigated zone and field checks. This is particularly important in drip systems, where wet and dry pockets can coexist only a short distance apart.
Review thresholds during the growing season
Roots expand, canopy demand changes and irrigation uniformity can drift as emitters clog or nozzles wear. A threshold that made sense at establishment may be too conservative or too late at peak demand. Review the rule after major growth stages, heat events, changes in irrigation hardware and unexpected crop response. Keep earlier thresholds in the record; editing a dashboard value without a date makes past decisions difficult to interpret.
Use sensor data as a feedback loop: predict what the next irrigation should do to the shallow and deep traces, observe the actual result, and inspect when it differs. That process builds confidence in both the site and the instrument. It also helps distinguish a sensor fault from a real soil or irrigation change.
Distinguish rain from irrigation effects
Rain may wet a broader surface area than drip irrigation and may reach a sensor at a different rate. A trace that responds well to rainfall but barely to a drip event can indicate that the sensor sits outside the drip wetting bulb. It does not automatically mean the emitter failed. Compare the event location, amount and duration with the sensor's lateral position. After a heavy rain, delayed drainage can continue to alter deeper readings even when the surface appears dry.
If rainfall is measured at a distant weather station, check whether it actually occurred at the field. Local storms can differ substantially over short distances. An on-site rain gauge or irrigation log helps distinguish a sensor anomaly from a missed event. These contextual observations are especially valuable when a dashboard is reviewed remotely.
Know when a second kind of measurement is needed
Soil moisture sensors do not directly measure plant stress, nutrient concentration or the uniformity of every emitter. A crop can appear stressed even while a nearby VWC probe reads wet because of disease, root damage, oxygen shortage or salinity. A low reading can coexist with a healthy crop if the probe lies outside the main root zone. Inspect plants and soil, and consider leaf or canopy measurements where the decision depends on crop response rather than stored water alone.
Likewise, irrigation water quality is a separate variable. High salinity may both reduce plant access to water and bias some dielectric readings. A soil-water potential observation, direct salinity test or laboratory soil analysis can clarify a confusing case. Adding more identical moisture sensors will not necessarily solve a question that requires a different measured quantity.
Before purchasing a full deployment, answer these questions in writing:
- Which crop and management zone will the system represent, and what irrigation decision will it change?
- Is water content, water potential, or a combination the most useful quantity for that decision?
- What are the soil layers, salinity conditions, rooting depths and wetting patterns?
- At which depths and lateral positions will readings be representative through the season?
- What absolute accuracy, trend stability and response speed are needed near the intended decision point?
- What calibration, reference checks, maintenance and power/telemetry support are realistic?
- How will readings be compared with field observations and irrigation records before the rule is trusted?
A small pilot across contrasting representative zones can reveal installation and interpretation problems. It also provides a chance to compare sensor families without assuming that the most expensive device will solve a spatial-sampling problem. Expand the network only after the first locations and decision rules prove useful.
سوالات متداول
Is VWC the same as plant-available water?
No. VWC is a fraction of soil volume occupied by water. Plant availability depends on the soil water retention relationship, roots and crop conditions. The same VWC can represent different degrees of stress in different soils.
Should I use a tensiometer or a dielectric sensor?
Choose based on the decision and operating range. Tensiometers express water tension directly over their usable range but require maintenance. Dielectric sensors provide a convenient continuous estimate of VWC but may need soil-specific calibration and attention to salinity and contact. Some deployments benefit from both.
How deep should a soil moisture sensor be buried?
There is no single depth for all crops. Place sensors at depths that represent active roots and the decision you need to make, often with more than one depth to distinguish upper-zone drying from deeper water movement. Reassess as roots develop.
Can a factory calibration be used without field calibration?
It can be a useful starting point for trends or approximate VWC. If the decision depends on accurate absolute water content, check the device against your soil and conditions. Document the uncertainty and avoid claiming laboratory accuracy for an unverified field installation.
Why did my reading jump after fertilizer application?
The added water may really have changed moisture; electrical salinity effects can also influence some dielectric probes. Check timing, nearby depths, soil condition and manufacturer guidance before adjusting irrigation or recalibrating.
Does a sensor network replace checking the field?
No. Sensors observe small volumes of soil. Periodic field inspection tests whether their locations and readings still represent the crop zone and whether disease, compaction or irrigation hardware problems are changing plant response.
مراجع فنی
- University of Minnesota Extension, Soil moisture sensors for irrigation scheduling.
- University of California ANR, Soil moisture sensors.
- University of Arizona Extension, Soil moisture sensor selection guide.
- North Carolina State Extension, Calibrating soil water measuring devices.
- Oklahoma State Extension, Soil moisture sensing systems.





پاسخ دهید