
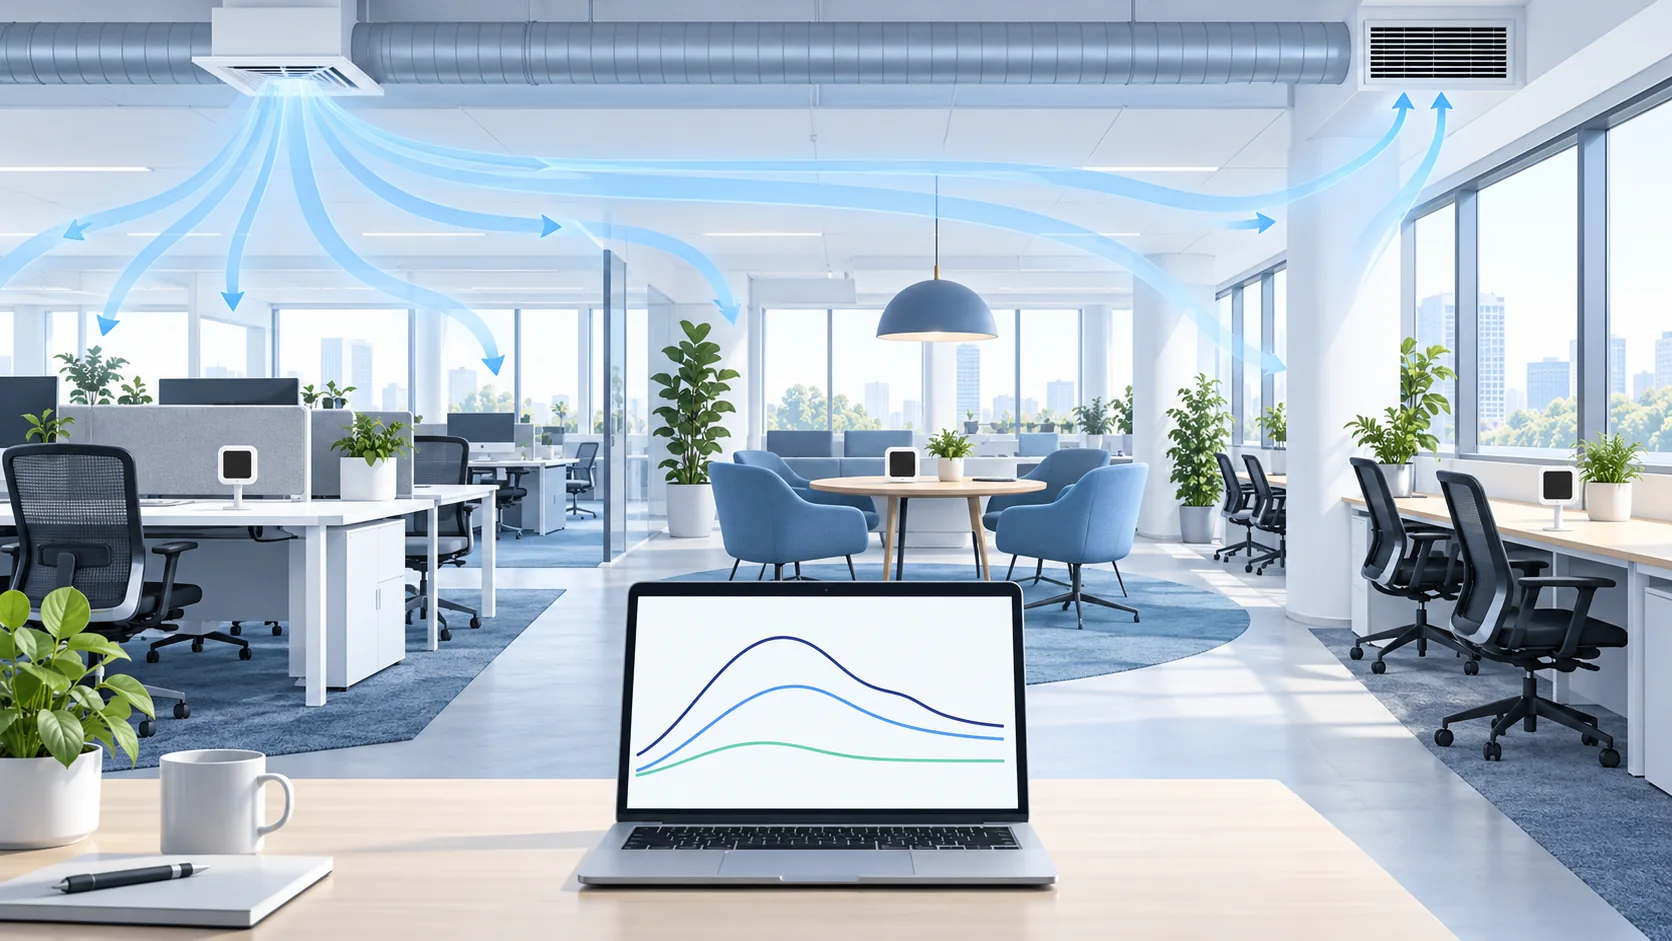
A difference between two office CO₂ monitors is useful only after you establish that the devices, clocks, locations and occupied periods are comparable. First check the instruments side by side; then place them in documented breathing-zone positions, log occupancy and air-system events, and compare synchronized periods with similar use. A higher trace in one zone is a lead for investigation, not proof that a diffuser, room or whole building is failing. ASHRAE's position on indoor CO₂ emphasizes spatial variation, measurement quality and the assumptions behind ventilation inference.
Open-plan offices can look like one room on a floor plan while behaving like several air environments. A partition redirects a supply jet; a meeting cluster adds a local source; a window or door changes a flow path; and a sensor under a diffuser samples a different air parcel from one in the occupied zone. None of these observations alone tells you the outdoor-air flow rate. The comparison method below is intended for a practical screening study that identifies where a competent facilities team should investigate. It is not a substitute for commissioning measurements or a formal exposure assessment.
Itu UK HSE guidance on CO₂ monitoring notes that larger spaces may need readings from multiple locations and that values can vary within a space. It also recommends monitoring during occupancy and considering how the room is used. Those principles make a single centrally mounted screen insufficient as a description of every desk. Yet placing five devices at random does not automatically produce a valid map. The quality of the comparison rests on a repeatable protocol.
Start with a question the comparison can answer
Decide whether you are investigating a recurring complaint near one workstation group, comparing two air-handling zones, checking the effect of a changed schedule, or simply learning how a new office behaves. Each calls for a different layout and observation window. A complaint associated with one particular afternoon needs a record of afternoon occupancy and plant operation; a general floor survey needs several normal workdays. If you collect numbers without a defined question, you may be tempted to treat whichever zone shows the highest peak as the problem.
Write the question in operational language: “During similarly occupied weekday afternoons, does the east desk group repeatedly show a different CO₂ pattern from the west desk group?” That can be tested with synchronized loggers and an event record. “Which zone is unhealthy?” cannot be answered from CO₂ alone. CO₂ from people is one indicator of how exhaled air accumulates and is removed under specific conditions. It does not measure particles, outdoor pollutants, chemical emissions, thermal comfort or all aspects of ventilation effectiveness. ASHRAE cautions against using an isolated concentration as a universal indoor-air-quality or infection-risk verdict.
Specify the units, sampling interval, date range and working hours before you deploy. Record the expected occupant population and whether it varies by desk group, shift or day of week. Ask facilities staff which diffusers, returns and air-handling schedules serve each proposed zone. This does not require a perfect airflow model; it helps you avoid comparing two locations as “equivalent” when one is next to a supply and the other is behind a partition. Keep a copy of the placement map and device list with the raw log.
Define zones by use and air paths, not by equal rectangles
Mark actual desk clusters, enclosed meeting rooms, high partitions, doors, windows, supply outlets, returns and any local fans on a floor plan. A zone can be a workstation cluster with similar occupancy and air-system exposure. Two points a short distance apart may differ because a partition or supply jet separates them. Two points farther apart may share one well-mixed air path. The labels “north” and “south” are useful identifiers, but they are not explanations.
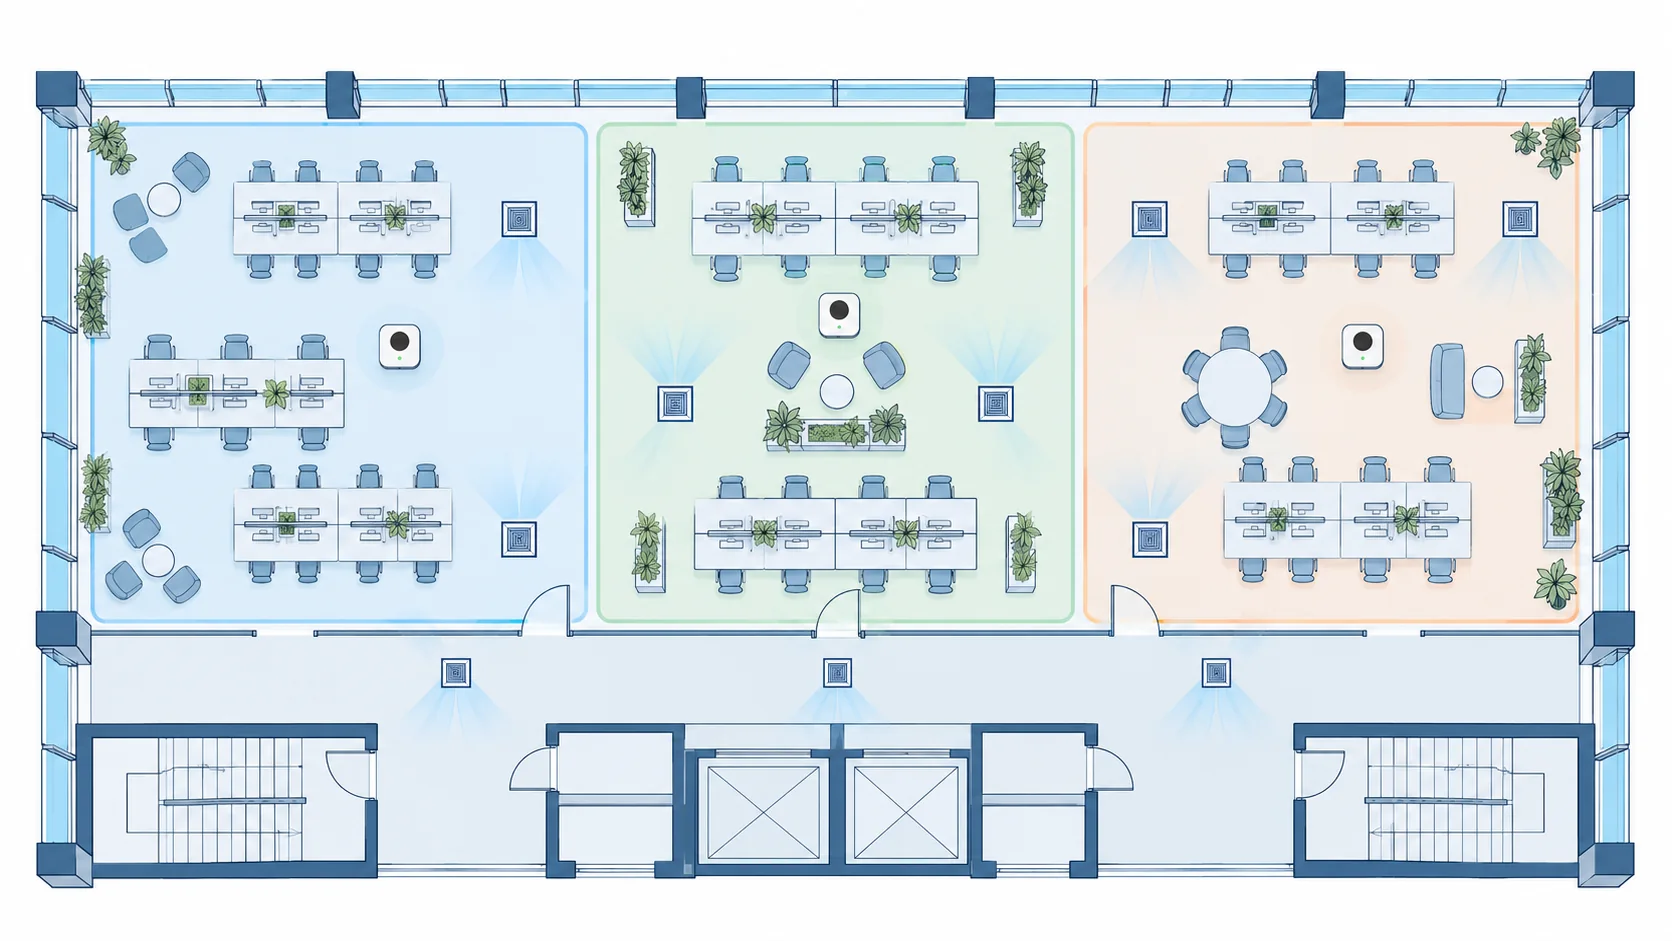
Choose representative occupied-zone positions, with air able to reach each sensor inlet. Avoid someone's immediate exhaled plume, a window, doorway, diffuser, heater, fan or an obstructed cabinet. The HSE's workplace advice gives a practical starting point of head-height placement, away from people and obvious air sources; adapt it to the actual device and office. A monitor beside the printer may serve as a printer-area observation but should not be called representative of the entire east wing. Record the height, support surface and distance to obvious disturbances so another person could repeat the setup.
Consider at least one reference location in the same floor area when the question is local variation. If all traces rise and fall together, a building-wide occupancy or schedule change may be involved. If just one location diverges repeatedly, a local source, air path or device issue deserves attention. A reference sensor is not necessarily “correct”; it is a comparison point whose position and behavior must also be checked. An outdoor measurement can add context if it is properly sampled, but using a guessed fixed outdoor value to calculate ventilation may add false precision.
Do not conflate open-plan space with adjacent closed meeting rooms. A meeting room has different volume, people density, doors and use pattern. Monitor it as a separate setting and interpret its event windows separately; our meeting-room CO₂ trend guide explains how entry, duration and departure change the curve. If a meeting-room door frequently opens to the open-plan floor, record that event because it may influence a nearby sensor.
| Location feature | What to record | Why it matters |
|---|---|---|
| Desk cluster and normal occupancy | Seat count, usual occupied hours, shift changes | Occupant generation differs between zones |
| Supply and return locations | Approximate location and serving system | The inlet may sample a supply jet or an area with different mixing |
| Partitions and enclosed rooms | Height, doors, typical use | They redirect air and create local sources |
| Windows and exterior doors | Normal opening practice, nearby sensor position | Weather-driven exchange may vary by day |
| Portable fans or air cleaners | Position and operating schedule | They may alter mixing without adding outdoor air |
| Sensor mount | Height, orientation, obstruction and nearby people | It defines the actual air being sampled |
If you have only two devices, use them to answer a narrow comparison between two chosen positions. If you need a floor-wide map, plan enough devices or repeat a movable-device study with a stable reference and documented phases. A moving device compares different times as well as different places; without the reference and context, a morning reading in the west cannot fairly be compared with an afternoon reading in the east.
Check the instruments together before separating them
Two displays that differ while sitting together provide an immediate warning about treating their later difference as a spatial effect. Set all devices close together in the same representative indoor location, with accessible air inlets and no person breathing directly onto one of them. Allow their specified startup and stabilization period; follow the finished monitor's manual. Log at least long enough to observe normal fluctuations and any systematic separation rather than comparing a single changing display value. The side-by-side check can reveal a clock offset, one stale logger, a device with unusual response or a persistent difference among units.
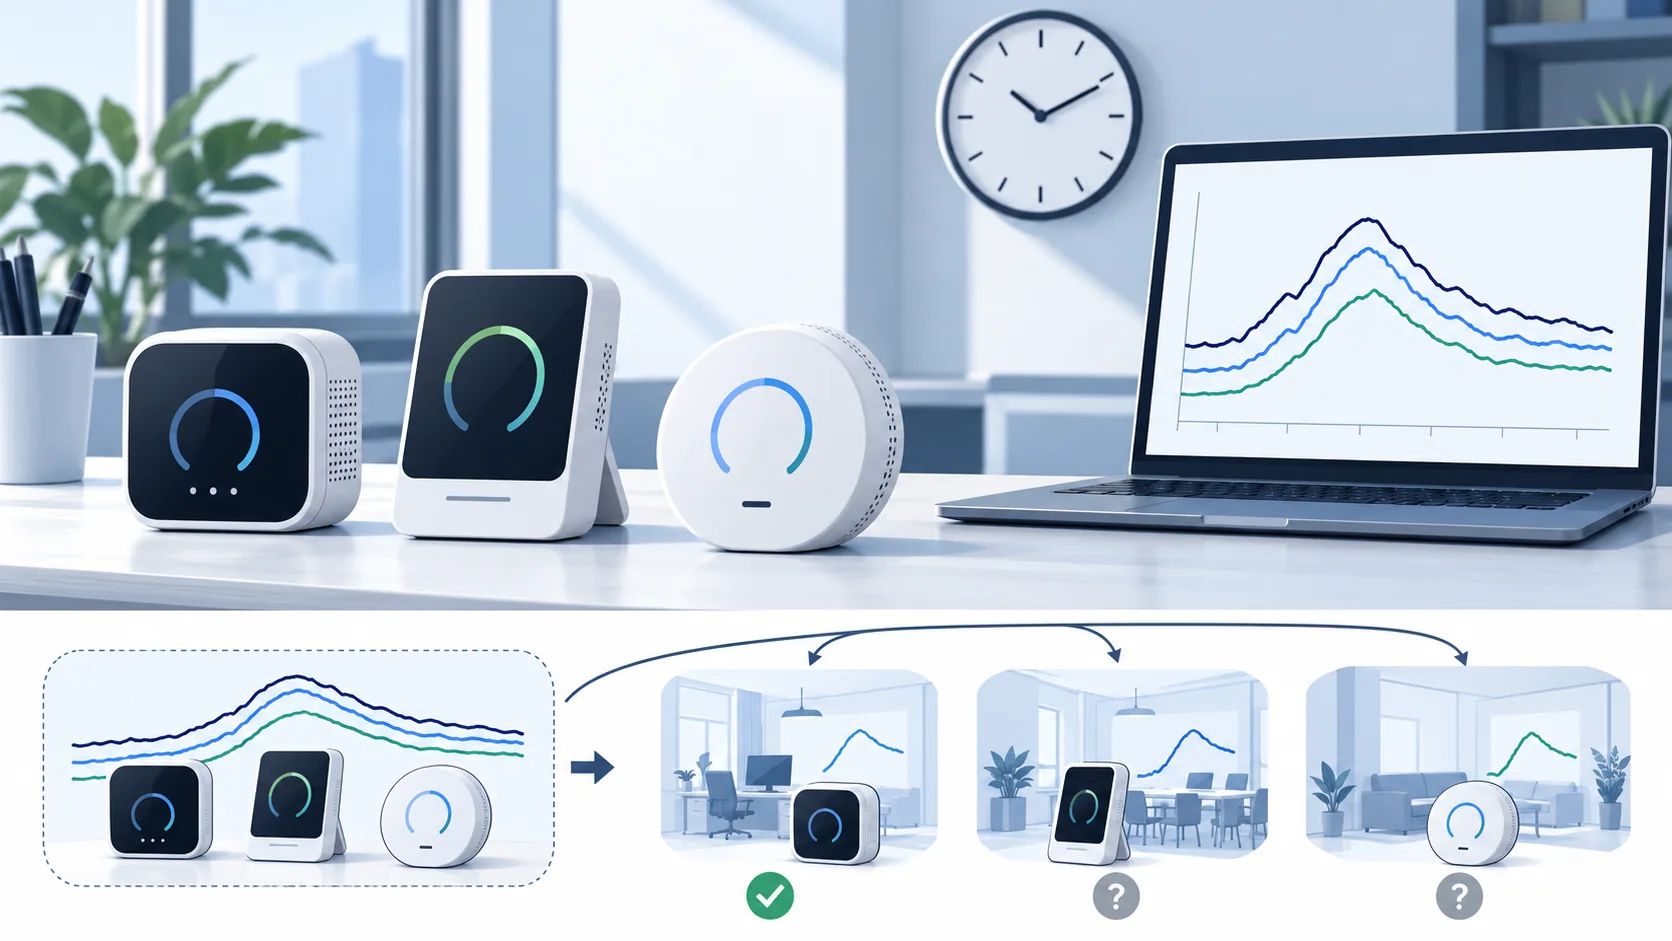
This is a co-location agreement check, not a traceable calibration. It does not certify accuracy against a reference gas. If formal calibration is required, use the manufacturer's method and an appropriate competent provider. The Lembar data Sensirion SCD4x illustrates how stated accuracy, response and automatic calibration conditions belong to a particular sensor family. A completed monitor can also add enclosure, airflow, software and display effects. Read the final product's specification, especially the conditions attached to its accuracy statement. Our CO₂ monitor accuracy explanation distinguishes accuracy from resolution and explains why two neat integer readings may still be uncertain.
If monitors disagree substantially in the same air, troubleshoot them before mapping the office. Check units, actual versus estimated CO₂ measurement, warmup, firmware, inlet obstruction, power, time stamps and calibration setting. Some devices automatically adjust their baseline based on exposure history; an office that is continuously occupied may not meet a model's assumptions. Do not force a baseline reset to make devices match unless the manufacturer's instructions and the test conditions support it. If one unit remains suspect, substitute a verified one or document that its data are unsuitable for a zone conclusion.
The uncertainty of a difference depends on both devices, not on the number of decimals in a chart. When observed separation is small compared with the plausible combined instrument uncertainty and the co-location disagreement, report it as unresolved. A simple statement such as “the traces were similar within the limits of this setup” is more useful than ranking desks by a few ppm. When the separation is large, repeatable and coincides with a plausible event or location, investigate it; still keep the device check in the report. Do not subtract a single “correction factor” from every reading without evidence that the offset stays constant across concentration, temperature and time.
At the end of the deployment, repeat the side-by-side check if practical. This can reveal a device that drifted or developed a fault during the study. A post-check cannot recover missing measurements, but it changes how confidently you interpret the earlier records. Keep both checks, including any disagreement, rather than silently editing the plotted curves to line up.
Make the clocks and data formats agree
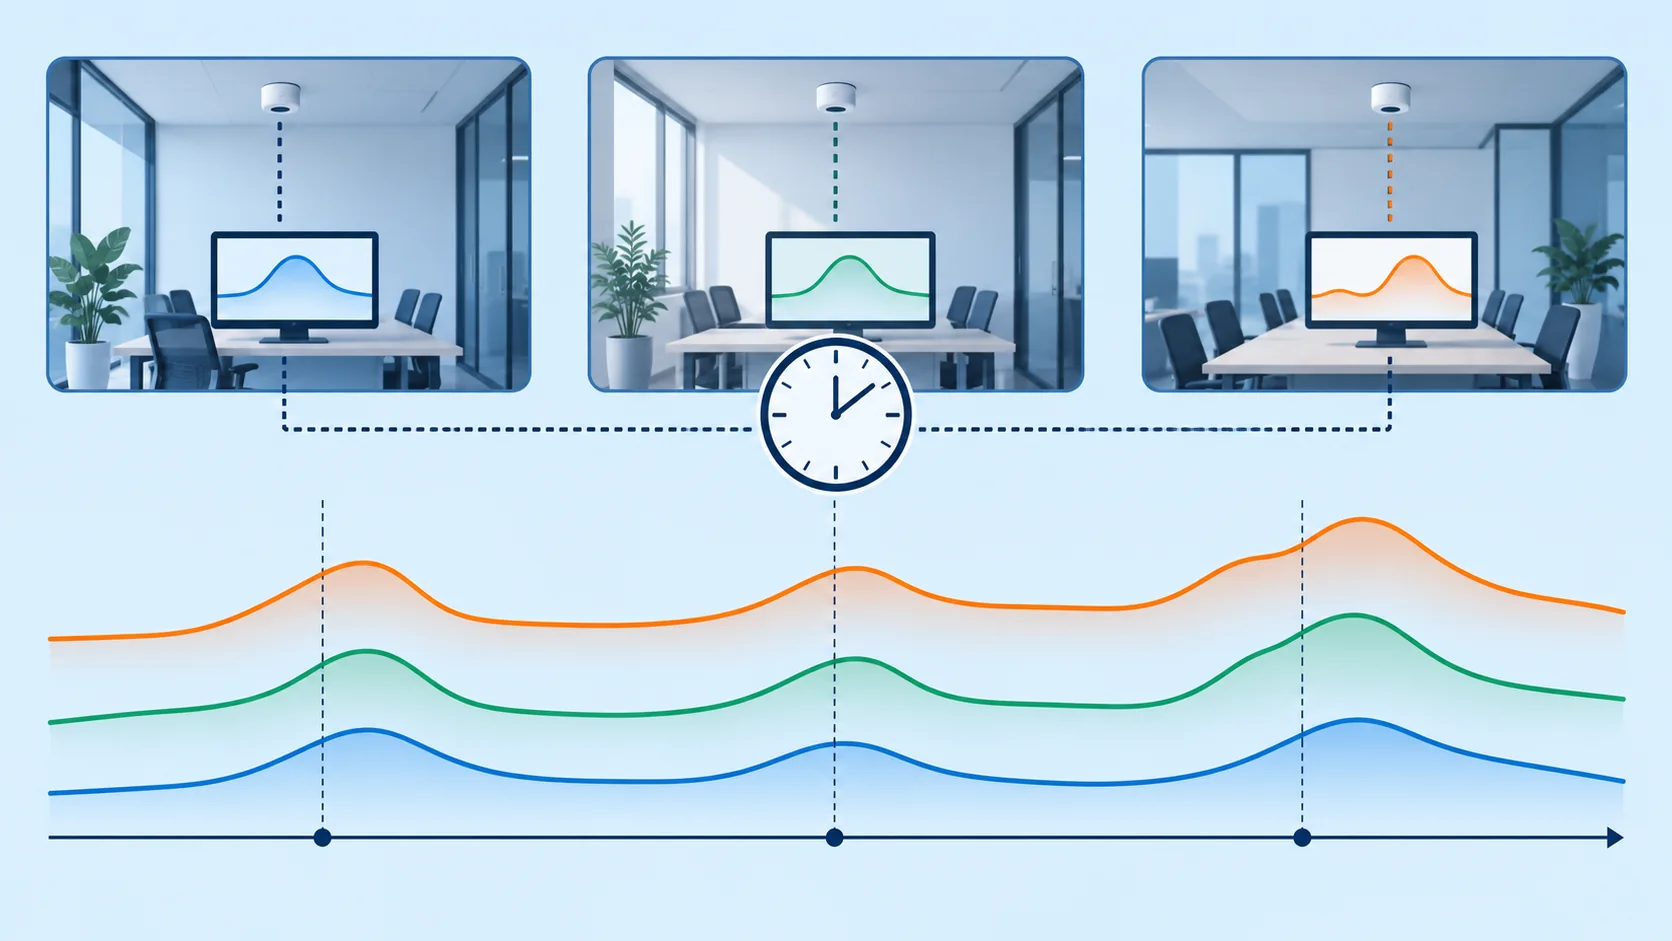
Set all devices to the same time zone and synchronize clocks before starting. Confirm whether the logger saves local time, UTC or an application-specific timestamp, and note daylight-saving handling for the study period. A ten-minute offset can make an apparent zone lead or lag that is entirely a recording artifact. Copy the raw export before cleaning it. Preserve device IDs, timestamps, units, quality flags and missing intervals.
Use a common interval for analysis only after you know how each device sampled. A five-minute average is not equivalent to a five-minute point sample if the underlying signal is changing rapidly. Avoid filling long gaps with interpolated lines that resemble real measurements. If a dashboard smooths the trace, state that fact; where possible, compare the raw or documented averaged series. Our CO₂ data-logger versus live-display guide explains why a screen that looks informative in the moment may lack the history needed for this work.
Mark office events on the same time axis: approximate head count by zone, meeting spillover, window or door changes, HVAC start and stop times, unusual weather, maintenance and device moves. A small event log can be enough. You need not identify individual employees; aggregate head counts and operating events usually answer the measurement question. If occupancy is unknown, do not pretend that the highest trace came from the weakest ventilation. A busy cluster can produce a higher concentration than a lightly occupied cluster even with similar outdoor-air delivery.
Keep the time axis honest in charts. Start all zone traces at the same clock time, show gaps and include the occupied period. Do not normalize each trace to its own maximum when the purpose is to compare magnitude. On the other hand, a chart with a compressed vertical scale may exaggerate small differences; provide axis units and the device uncertainty context. The illustration above shows alignment logic only, not actual site data or a numerical performance target.
Compare like with like: an evidence ladder
Begin with the broadest observations. Do all zones respond to morning arrival? Do they fall overnight? Is an unusual afternoon visible everywhere or just at one sensor? These patterns help frame the next check, but they are not a ranking. A floor-wide shift may follow a schedule or weather change. A single spike may be a breath plume or a person leaning near an inlet. A recurring occupied-period elevation at one stable position is more interesting than one isolated peak.
Next select equivalent occupied windows. Compare the same clock hours on days with similar staffing, system schedules and door/window behavior. If the east side houses twice as many people, write that down; the result describes those real operating conditions, not an intrinsic defect in east-side ventilation. If the question is whether the air system differs, a facilities engineer may need more controlled measurements than the natural office provides. Do not force a causal answer from observational data.
Look at starting concentration, direction of change, sustained occupied level and recovery after people leave. A zone can have a higher afternoon peak because it started higher after an earlier event; another can have a lower peak but continue rising. A one-number dashboard hides these distinctions. For a meaningful operational report, show a synchronized overlay for selected representative days and a short table of conditions. Retain atypical days separately rather than discarding them without a reason.
| Evidence level | Observation | Appropriate interpretation | Next check |
|---|---|---|---|
| Single display difference | Two monitors show unlike values once | Too weak to attribute to a zone | Check clocks, positions and co-location agreement |
| Repeatable pattern at one point | A location differs over similar occupied periods | Local condition is plausible | Review occupancy, air paths and device behavior |
| Pattern repeats across devices | Swapped or independently checked device shows similar location pattern | Instrument-only explanation less likely | Inspect system operation and perform targeted assessment |
| Pattern changes after an authorized adjustment | Comparable periods show a repeatable change | Adjustment may be associated with improvement | Confirm occupancy and other conditions remained comparable |
| Formal airflow conclusion | Requires validated tracer or direct flow method | Do not infer from screening plot alone | Use qualified commissioning or engineering method |
If practical and safe, a device-swap experiment strengthens the evidence: exchange the two checked monitors between positions, maintain equivalent mounts, and observe comparable occupied periods. If the high pattern follows the location rather than the serial number, an instrument-specific fault becomes less likely. But the swap may also change the date, weather and occupancy; document them. Do not interpret one afternoon before and another after as identical trials. The same logic applies to a reference sensor that stays put while another visits several locations.
Outdoor CO₂ measurements can help distinguish indoor accumulation from background changes, but outdoor samples need a suitable inlet location away from exhausts and people. Turning indoor-outdoor difference into a ventilation flow or air-change rate requires stronger assumptions about source generation, mixing and steady conditions. ASHRAE's technical discussion describes both the usefulness and limits of such tracer-gas interpretations. A natural office study with shifting head count and open doors usually cannot satisfy those assumptions simply by adding another column in a spreadsheet.
Investigate a persistent outlier in a disciplined order
When one zone repeatedly differs, first check the simplest measurement explanations: Is its clock right? Did it lose power? Is the inlet clean and exposed? Does the difference follow the device in a swap? Does the co-location check show disagreement? Next examine the local source and position: Is a person seated unusually close, or is the sensor inside a low-airflow pocket? Are desks, partitions, plants or cabinets obstructing a nearby air path? Then review the operation of the serving ventilation system with facilities staff. This order prevents a quick but expensive control change based on a bad measurement.
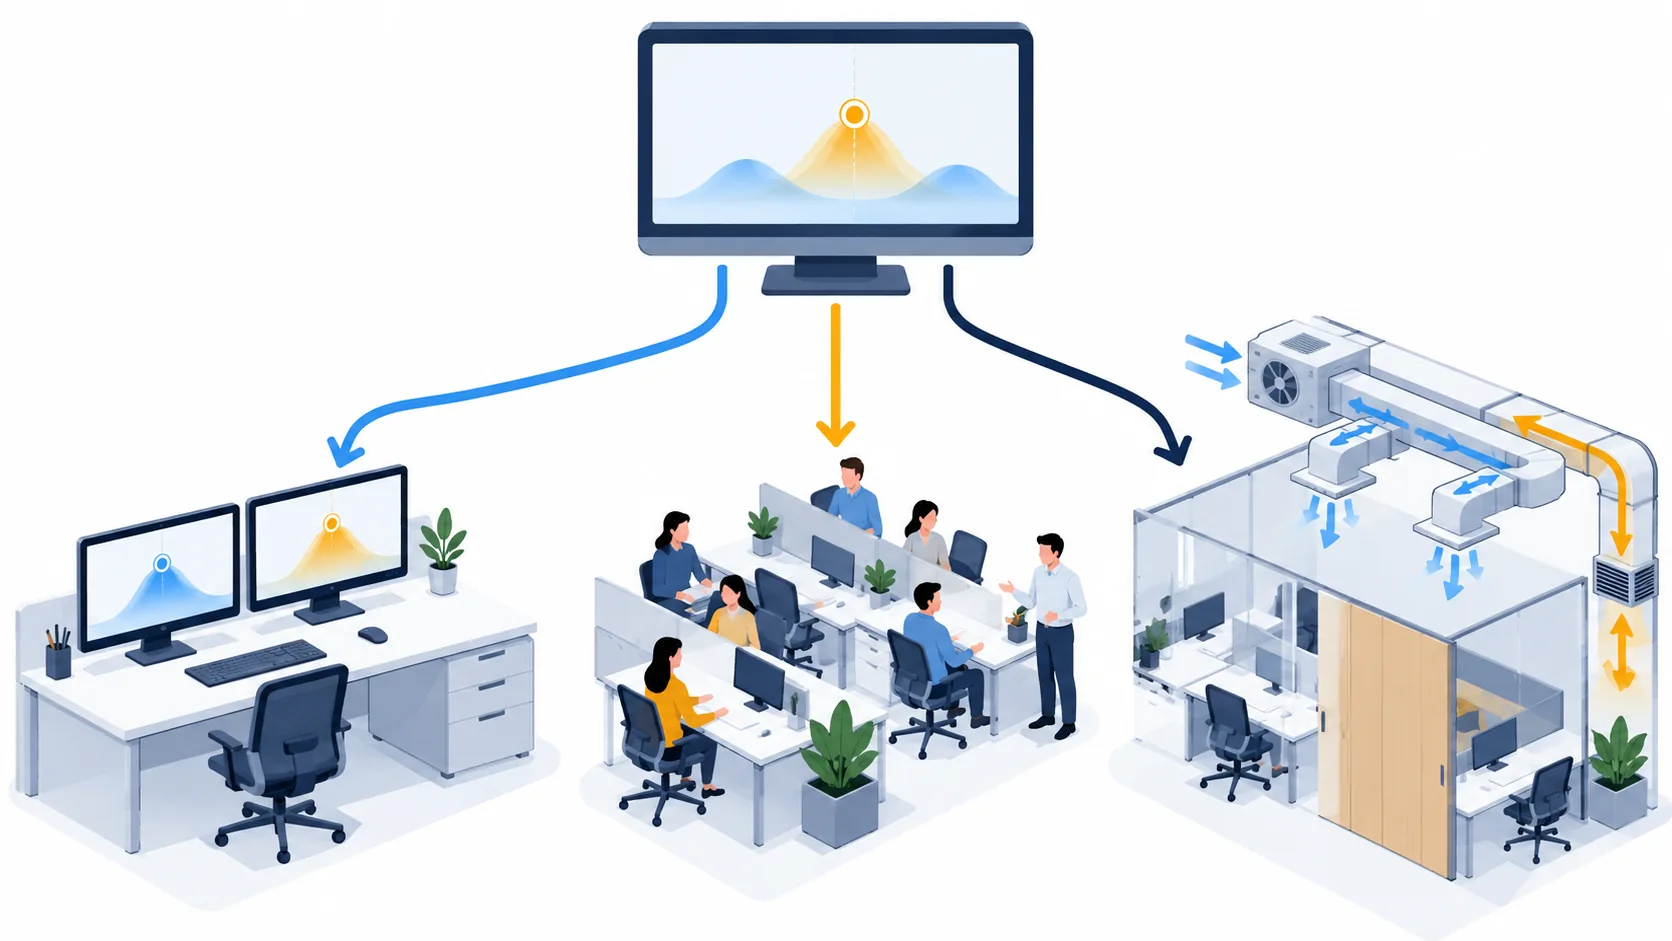
If an air-handling issue is plausible, check design intent, schedules, damper or terminal operation, and actual supply and return conditions using appropriate methods. A CO₂ sensor near a supply diffuser may show a deceptively low value; a sensor near a person may show a deceptively high one. Neither point on its own measures how much outdoor air reaches everyone. The EPA's office indoor-air-quality guidance treats building operation, sources and occupant concerns as a connected investigation, a broader view than one numeric sensor output.
Do not alter fire doors, defeat ventilation controls or reduce required outdoor-air service to make traces look more uniform. If an adjustment is authorized, record exactly what changed and when, then compare several suitable periods. A fall on the first afternoon may coincide with fewer occupants or different weather. A repeated change under similar conditions is more credible. Where health or regulatory requirements are involved, the applicable local rule and a qualified professional assessment should determine action, rather than a generalized ppm rule copied from another jurisdiction.
Turn the measurements into a useful facilities report
An effective report allows someone who did not place the monitors to understand the question, the conditions and the remaining uncertainty. Start with a floor plan showing each device ID and mounting point. Add the monitor make/model, measurement method, relevant specification and any co-location check. Record the raw-data period, sampling and averaging method, time synchronization, missing-data intervals, typical occupancy, ventilation schedules and events. Select a few representative synchronized charts and explain why those days were selected. Keep the full raw record available for review.
Separate observation dari inference. “Zone E showed a sustained higher trace during three similarly occupied afternoons” is an observation if the logs support it. “The east terminal under-delivers outdoor air” is a hypothesis until equipment or airflow checks support it. “Every person in Zone E has poor air quality” does not follow from the CO₂ data. This distinction makes the report actionable without overstating the evidence.
A compact report can follow this format:
- Question and scope: which zones, which dates, and the exact operational comparison.
- Map and devices: IDs, positions, specifications and co-location results.
- Context: head-count ranges, hours, HVAC and door/window events.
- Data quality: synchronized time, gaps, smoothing, changes of mount or device.
- Observed patterns: synchronized traces, repeated differences and exceptions.
- Interpretation: plausible explanations and uncertainty, explicitly labelled.
- Next action: a device recheck, targeted facilities inspection, repeat monitoring or formal assessment.
When publishing a general educational case study, remove personal or confidential building details and never invent measured values. The diagrams in this article are conceptual illustrations of the method. They are not a monitored office, laboratory validation or a calibrated performance chart. For an initial deployment plan, our office CO₂ monitor placement guide covers location choice and practical commissioning in more detail.
Common questions
How many CO₂ sensors does an open-plan office need?
There is no universal count based solely on floor area. It depends on the question, desk clusters, partitions, air-system zones, occupancy variation and available devices. Start with a map and the locations that could plausibly differ. A limited two-point study can answer a limited question; it cannot claim to describe every desk. Larger, irregular areas may require multiple points, as the HSE guidance indicates. If the decision has safety or compliance consequences, plan an appropriate professional assessment.
Can I rank every desk by a one-day CO₂ reading?
No. A single day mixes instrument uncertainty, occupancy, starting conditions and system operation. Even a repeatable spatial pattern is a prompt to investigate its cause, not a personal exposure ranking. Keep the occupied time series and context rather than publishing a league table of isolated maxima.
Should I subtract the lowest sensor's reading from all the others?
The lowest sensor is not necessarily a reference standard. It may be near a supply outlet, under-responding or simply in a less occupied location. A difference plot can be useful after co-location and position checks, but do not assume the lowest unit is correct. Include its own data-quality status and location on the map.
What if two checked instruments still disagree by a small amount?
Consider the final-device accuracy conditions, their side-by-side disagreement and the scale of the apparent zone effect. A small difference that is not clearly above these limits should be reported as inconclusive. Repeating the observations or obtaining a suitable reference check is better than manufacturing precision by spreadsheet correction.
Does a higher zone reading prove that its ventilation is broken?
No. More occupants, a different starting level, local mixing, a person near the inlet, open or closed doors, or a device problem can all contribute. A repeated location pattern after device and context checks supports further ventilation investigation, not an automatic fault diagnosis. Actual system verification requires methods suited to the equipment and the question.
Can a portable air cleaner fix the CO₂ difference?
A typical particle air cleaner may change air movement and particle levels but does not itself provide outdoor air or remove exhaled CO₂ in the way a designed outdoor-air ventilation system does. Its fan may alter what a nearby sensor samples. Evaluate any intervention against the specific pollutant and building design; do not use a CO₂ trace to judge every aspect of an air-cleaning product.
Should I use a single threshold for all offices and countries?
Use applicable local guidance for the relevant decision, including its measurement conditions. A single context-free value cannot by itself establish overall indoor air quality, ventilation rate or health risk. State your purpose, instrument uncertainty, location and occupancy before using any action value. This is especially important when comparing information drawn from different jurisdictions.
Source notes
The method is based chiefly on the UK HSE guidance for workplace CO₂ monitoring, itu ASHRAE position document on indoor CO₂, itu Sensirion SCD4x datasheet as a model-specific instrument example, and the US EPA office indoor-air-quality overview. Device instructions, building drawings and local requirements govern a real deployment. No site-specific measurement is represented in the conceptual graphics.

How to Read a Meeting Room CO2 Trend Against Occupancy
Read meeting-room CO2 trends with occupancy and ventilation events, distinguishing starting level, occupied rise, intervention and post-meeting decline.
Baca selengkapnya
How to Plan CO2 Monitor Placement in an Office
Plan representative office CO2 monitor locations by measurement purpose, occupancy and air paths, then verify positions and log context before using the data.
Baca selengkapnya
Apakah Pembersih Udara Menurunkan CO2? Pisahkan Filtrasi dari Pertukaran Udara Luar Ruangan
Pemurni HEPA biasa menangkap partikel tetapi tidak menghilangkan CO2 yang dihasilkan penghuni secara berarti. Pelajari cara memisahkan resirkulasi, ventilasi udara luar ruangan, dan memantau efek pencampuran.
Baca selengkapnya
Cara Membaca Log CO2 Kamar Tidur Semalam
Interpretasikan jejak CO2 di kamar tidur semalaman menggunakan tingkat awal, kenaikan, dataran tinggi, dan respons pagi hari sambil memeriksa kualitas logger, jalur udara, dan malam hari yang sebanding.
Baca selengkapnya
Cara Menafsirkan Tren CO2 di Rumah: Baca Polanya, Bukan Satu Angka
Pelajari bagaimana tingkat hunian, udara luar ruangan, pencampuran ruangan, dan penempatan monitor membentuk jejak CO2 di rumah, dan gunakan pencatatan yang dapat diulang untuk menguji perubahan ventilasi.
Baca selengkapnya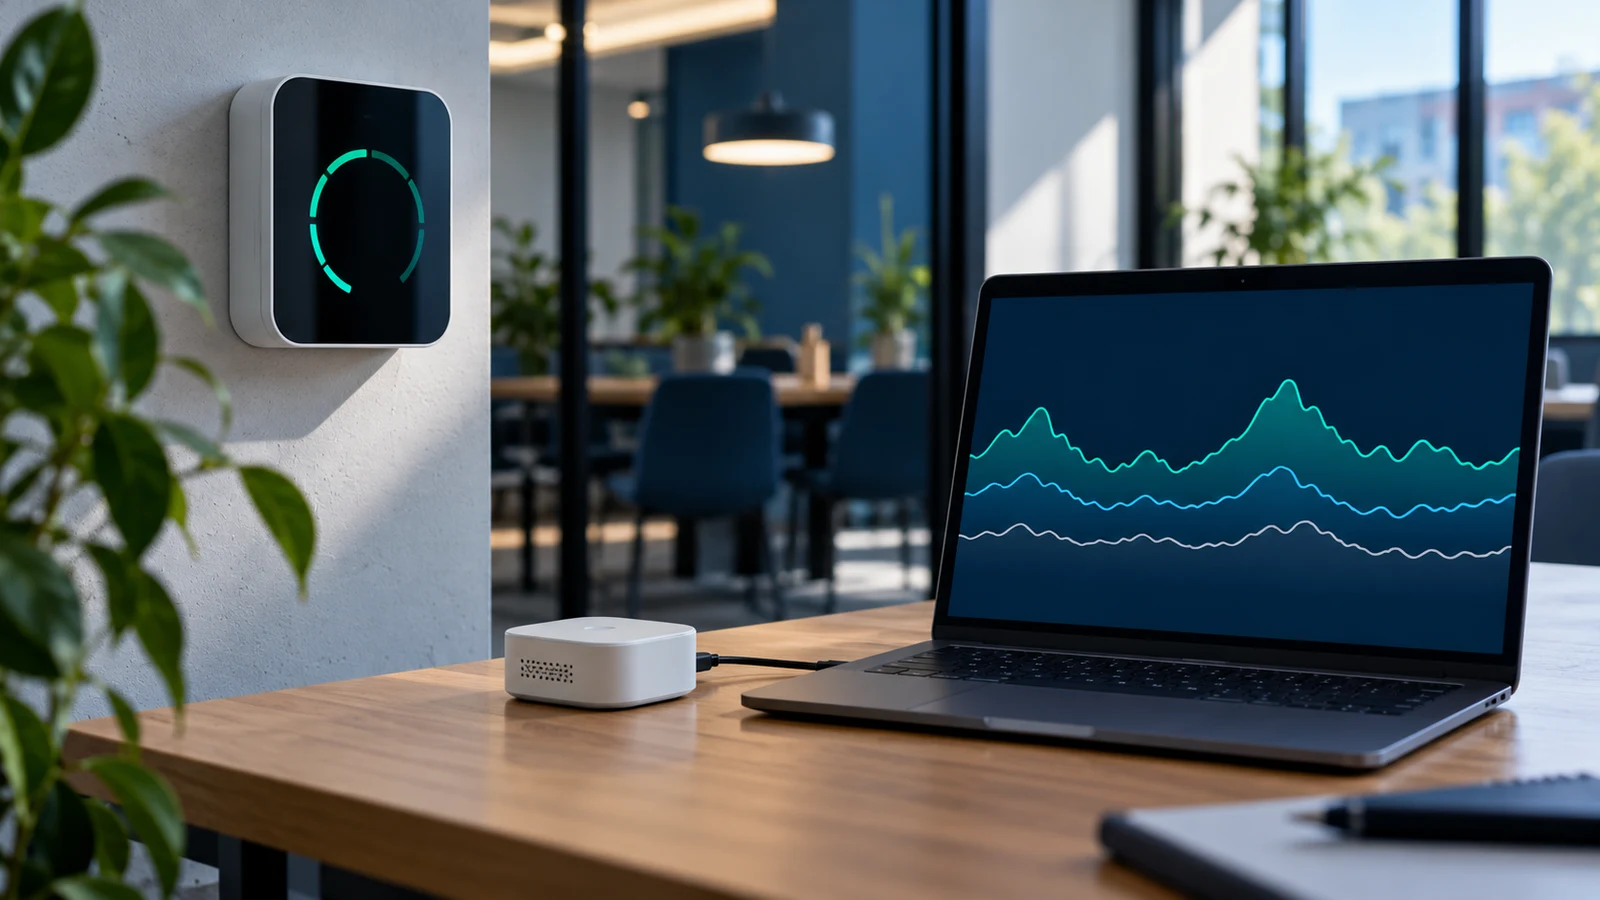
Pencatat Data CO2 atau Tampilan Langsung? Pilih Catatan yang Dibutuhkan Keputusan Anda
Pilih pencatat CO2, tampilan langsung, atau keduanya dengan membandingkan respons sensor, interval pembaruan dan pencatatan, stempel waktu, kesenjangan data, retensi, dan penggunaan.
Baca selengkapnya