
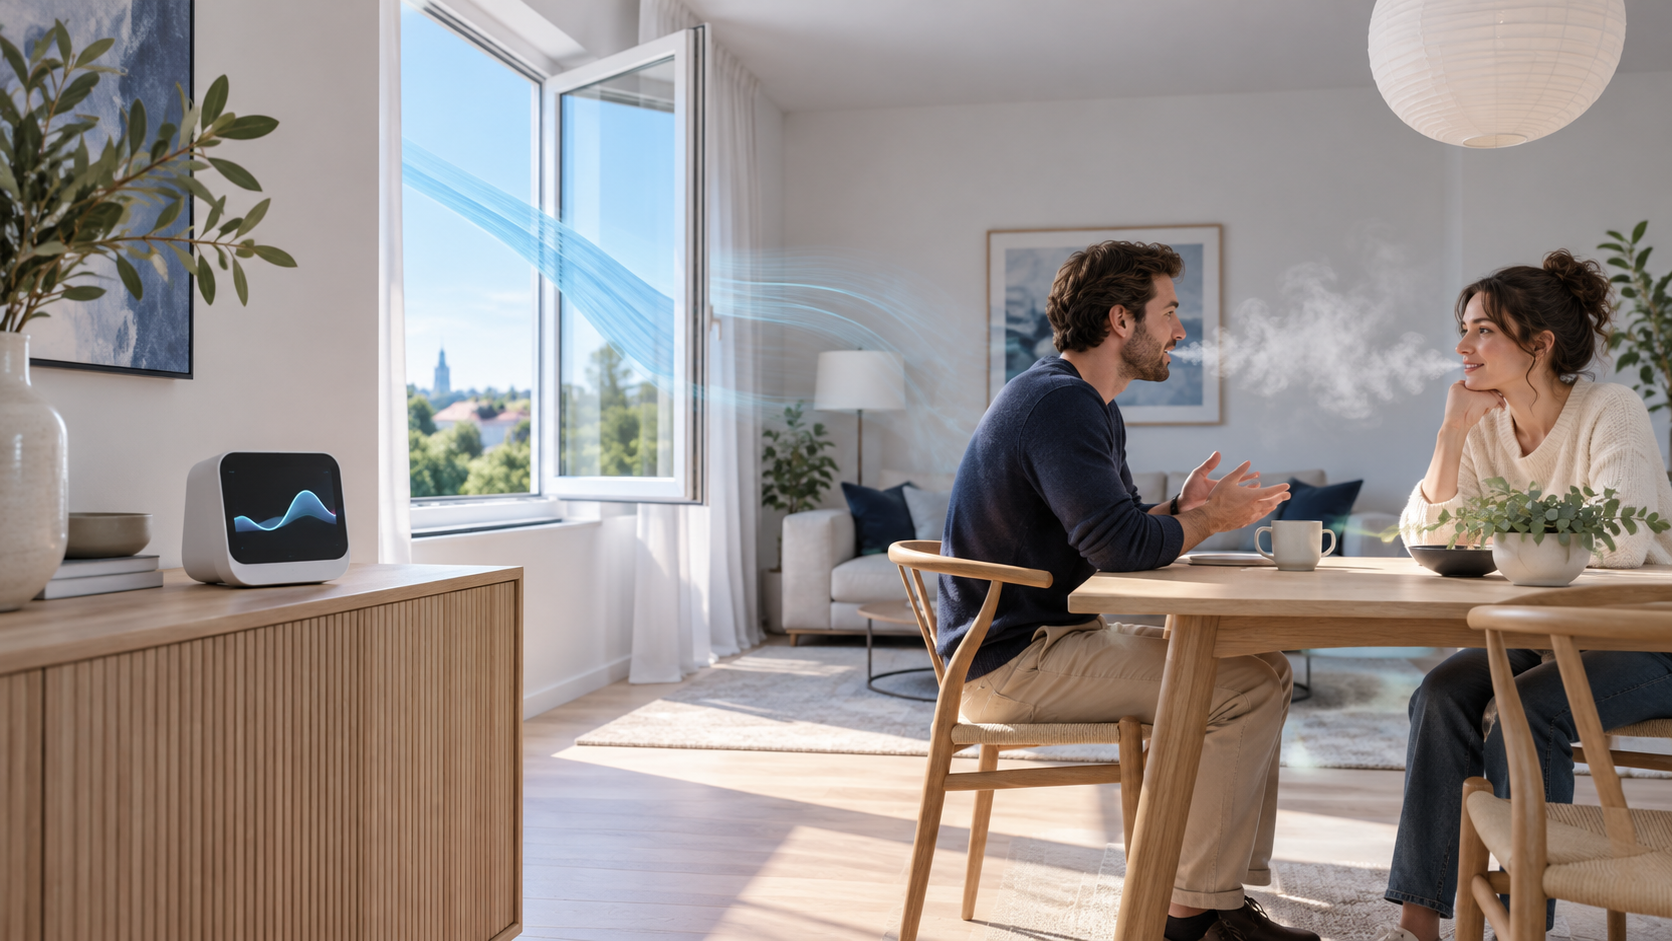
A home CO₂ monitor is most useful as a record of how an occupied room changes over time. Start with a trustworthy meter in a representative location, note who is in the room and which openings or ventilation systems are operating, and compare the reading with a plausible outdoor baseline. Then read the start, the rate of rise, any plateau and the fall after a change. A single peak cannot tell you the room's ventilation rate, the safety of every pollutant in the room or the effect of one intervention. ASHRAE's 2025 position document is explicit that CO₂ can aid an indoor-air assessment but is not an overall indoor-air-quality index.
This guide is about ordinary occupied homes, not a confined-space alarm, industrial gas release or medical measurement. The aim is to answer a practical question: does a particular room, under a known number of occupants, clear occupant-generated CO₂ as expected? Answering that question well is more useful than comparing a changing screen with an internet color band.
What makes a home CO₂ trace move?
People add CO₂ to room air when they breathe. Outdoor air entering a room dilutes that addition, and indoor air must leave by another route. Air can also move between rooms, so opening an internal door may change a bedroom reading without directly adding outdoor air to the home. Combustion from an unvented appliance or a candle is another possible source. The monitor reports concentration at its inlet, not a direct measurement of the outdoor-air flow through the whole building.
The simplest useful mental model has four parts: the outdoor starting concentration, CO₂ generation in the room, the effective volume of air that mixes with the monitor and the rate at which lower-CO₂ air replaces it. Health Canada's residential guideline describes outdoor concentration, indoor sources and ventilation as the main determinants. NIST's indoor CO₂ metric work shows why occupancy, generation, ventilation and time must be considered together rather than compressed into one universal cut point.
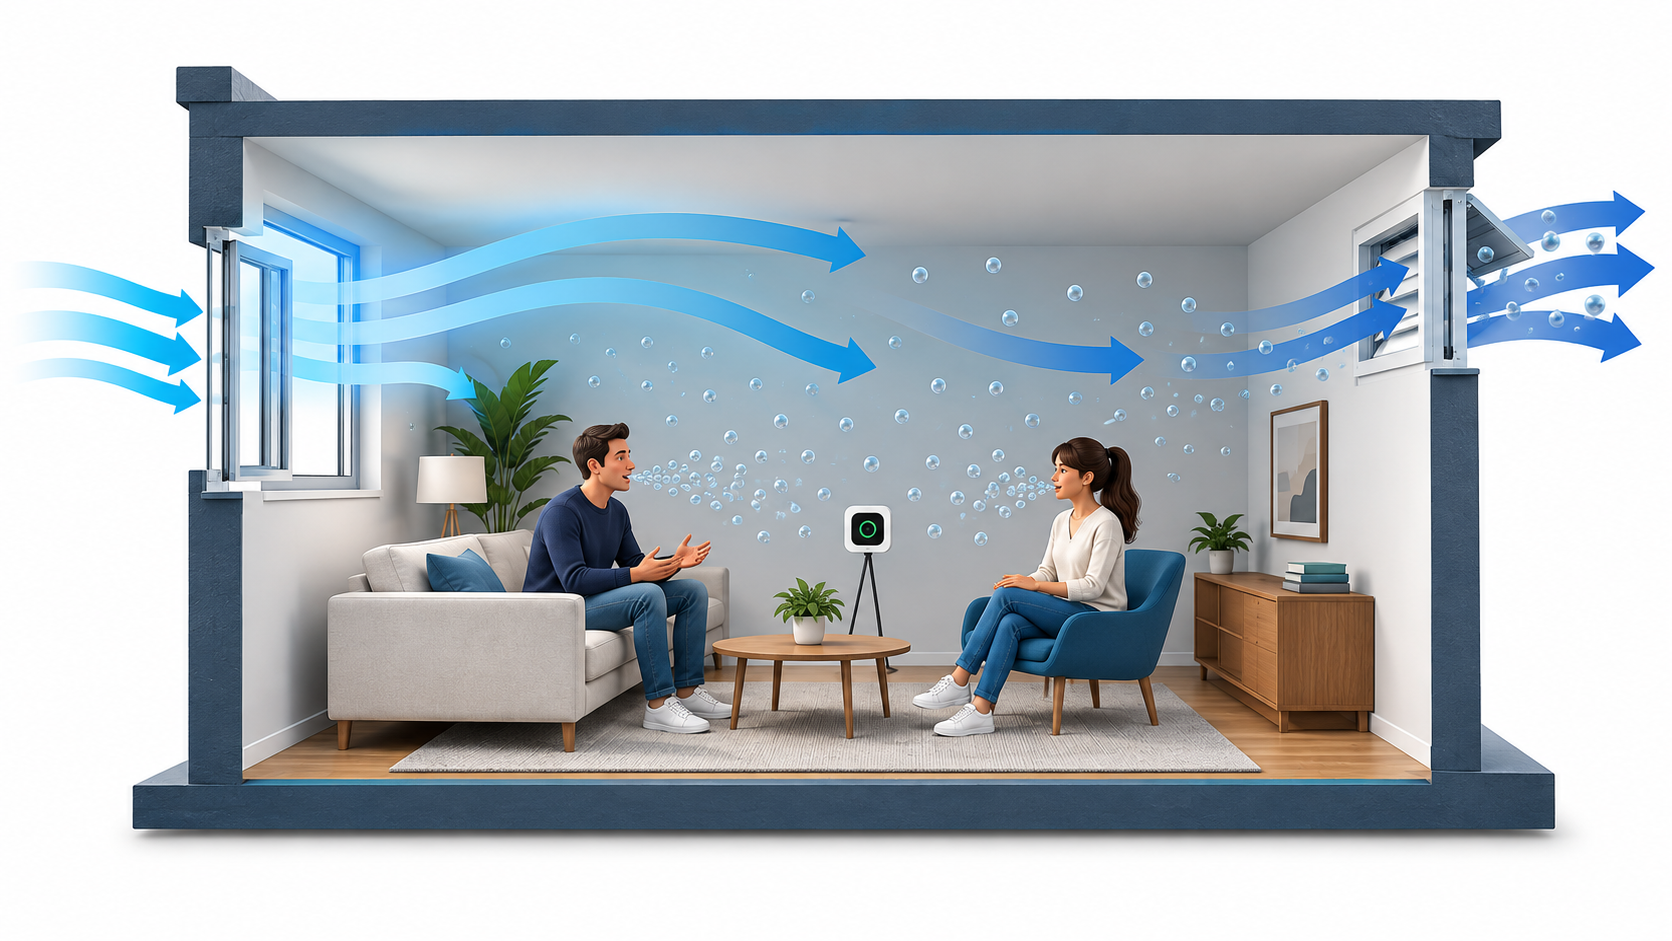
Imagine two otherwise similar evenings. In the first, one person reads in a living room; in the second, four people gather there. The second trace can rise faster even if the window position and building ventilation have not changed. Conversely, a lower reading in an empty room does not prove that the room would remain well ventilated when full. This is why the number of people and their activity belong next to a CO₂ graph. A quiet sleeper, a person exercising and several visitors do not generate an identical signal.
The difference between indoor and outdoor CO₂ is often more informative than the indoor reading alone. If outdoor air changes over time or a device's baseline is wrong, comparing an indoor reading to a fixed assumed outdoor value can mislead. A careful short outdoor check, following the monitor's manual and away from your own breath or a vehicle exhaust, can provide context. It is a reference observation, not an instruction to force-calibrate the device. Outdoor concentration varies by location and time, and a very sheltered balcony can contain air coming from the building itself.
One simplified relationship helps explain why fixed numbers fail: in an ideal, well-mixed room at steady occupancy and steady outdoor-air flow, the indoor concentration above outdoors grows as CO₂ generation grows and shrinks as outdoor-air flow grows. This relationship does bukan say that a home is always well mixed or already at steady state. Real rooms have doorways, short-circuiting air streams, moving occupants and windows whose flow changes with the weather. It is a way to ask better questions, not a shortcut to calculate liters per second from a single screen. If a professional needs an actual ventilation rate, room volume, occupancy-related generation, outdoor reference, airflow pathways and a validated method must be addressed explicitly.
The timing matters as much as the final level. A large room with a low outdoor-air flow can rise slowly for a while and still reach a high later value. A small room can rise fast even when some ventilation is present. A one-hour meeting, a full evening and an overnight sleeping period interrogate different parts of this dynamic response. Comparing a late-night value in a bedroom with a midday value in a large open living area tells little about which space has the better per-person outdoor-air supply.
Before interpreting the curve, check what the device really measures
Look for a direct CO₂ measurement method and the actual device documentation. Some multi-parameter products display “eCO₂” or an estimated equivalent derived from a VOC-related signal; that is not interchangeable with a direct CO₂ measurement. Our CO₂ sensor versus VOC sensor guide explains the distinction. A useful device also records timestamps at a known interval, declares its accuracy under stated conditions and makes its calibration behavior understandable. A dashboard with a smooth line does not establish that the raw observations were accurate.
Check five mundane details before drawing a conclusion: the clock and time zone; whether data were actually stored when power or Wi-Fi failed; the sampling or display-averaging interval; whether the sensor was recently moved or warmed up; and whether a calibration or automatic baseline function was reset. A missing hour in the log can make a normal overnight rise look like a sudden event. A long smoothing interval can make a quick window-opening response appear delayed. An isolated number with no record of these details is weaker evidence than a modest but reliable time series.
Automatic self-calibration is model-specific. Some instruments assume periodic exposure to reasonably fresh air; that assumption may fail when a monitor remains in a consistently elevated indoor environment. Others have different maintenance procedures. Follow the finished monitor's documentation, rather than applying one sensor chip's calibration instructions to every product. Where a decision depends on accuracy, compare with a suitable reference under controlled conditions or ask a qualified service provider. The Health Canada guidance for IAQ professionals emphasizes accuracy, location, monitoring frequency and calibration as prerequisites for meaningful inference.
Place the monitor where its sample represents the question
For an occupied-room trend, place the device in the air people use, on a stable shelf or stand, with its inlet unobstructed. Avoid a person breathing directly onto it, an open window, a supply diffuser, a return grille, a fireplace, a kitchen exhaust path or a confined nook behind furniture. A window-adjacent monitor may show incoming outdoor air while the far side of the room is less well mixed; a bedside monitor near a face may exaggerate the room-average concentration. The UK HSE monitor guidance recommends several readings, avoiding direct breath and supply openings, and logging occupancy and ventilation state. Its numeric interpretation is written for workplaces; the measurement precautions still help at home.
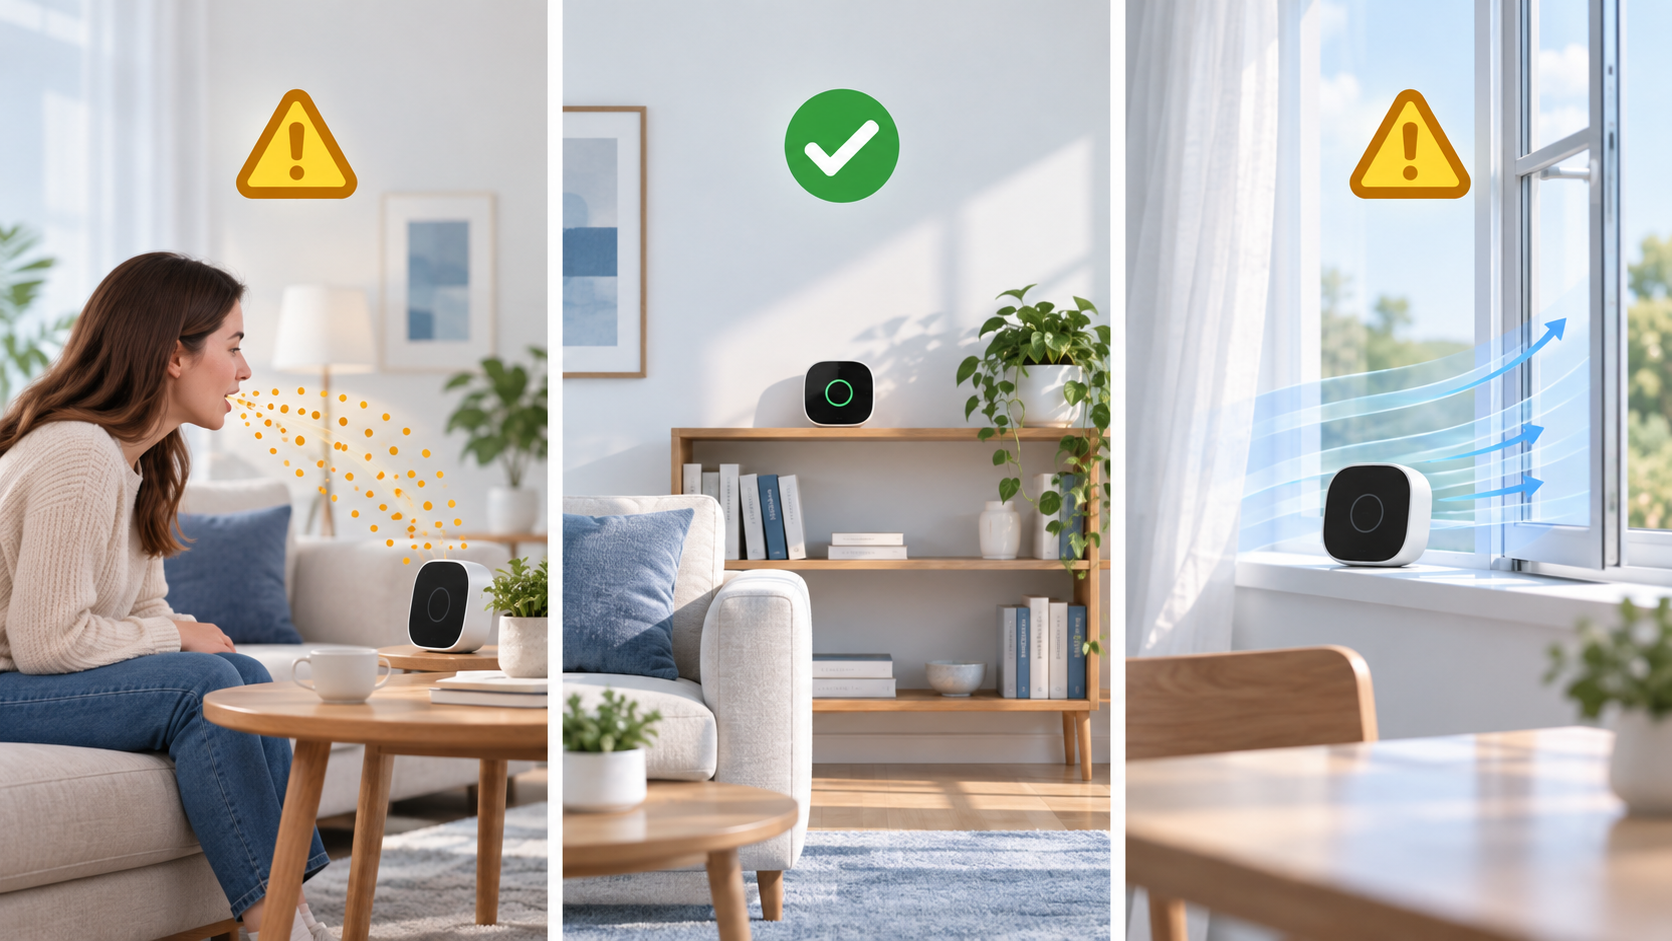
If the room is large, irregular or open to a hallway, one point may not represent the whole space. A second instrument or a controlled relocation can test this, but only compare readings after each device has stabilized and after checking that the instruments agree reasonably under the same conditions. Keep the primary monitor in one position for the comparison period. Moving it to a “better” corner halfway through an experiment changes the measurement as well as the room condition.
Do not infer whole-house ventilation from a living-room display. Bedrooms behind closed doors, a kitchen with an operating exhaust, and a living room open to a stairwell can have different air paths. A low reading in one zone can coexist with a rising trace elsewhere. The sensor-module versus finished-monitor guide describes why a complete instrument's enclosure and inlet matter in addition to the sensing element.
Read four features of the trace in order
1. Starting level. What did the monitor show before people entered or before the activity began? Note whether the room had just been aired, whether people were already present and whether a door had been open to the rest of the home. An elevated starting point can reflect an earlier occupied period. It is not evidence that the current activity created all of the CO₂ you see.
2. Rising rate. A sustained rise while occupancy is stable means CO₂ is being added faster than it is diluted at that moment. A faster rise than a comparable previous session could reflect more occupants, higher activity, a smaller effectively mixed volume or less air exchange. Without keeping those conditions comparable, slope by itself is not a ventilation-rate measurement. Abrupt spikes may be a person leaning over the instrument or a transient plume rather than a room-wide event.
3. Leveling or plateau. If a trace settles while people remain in place, generation and removal may have approached a balance. A plateau is not automatically a good or bad outcome; its meaning depends on people, outdoor air, room mixing and the device. A flat trace can also come from a frozen logger, smoothing, an instrument limit or a changed occupancy. Check the event log before declaring the building “steady.”
4. Decline or decay. When occupants leave, generation falls; when outdoor-air supply improves, dilution can increase. A falling trace is consistent with either or both. An internal door opening may also redistribute CO₂ into the rest of the home. The shape can be used by trained investigators to estimate air exchange under specific tracer-gas assumptions, but a casual home decay curve is not a certified air-change-rate test. The ASHRAE document cautions that quantitative ventilation inference needs valid assumptions and accurate inputs.
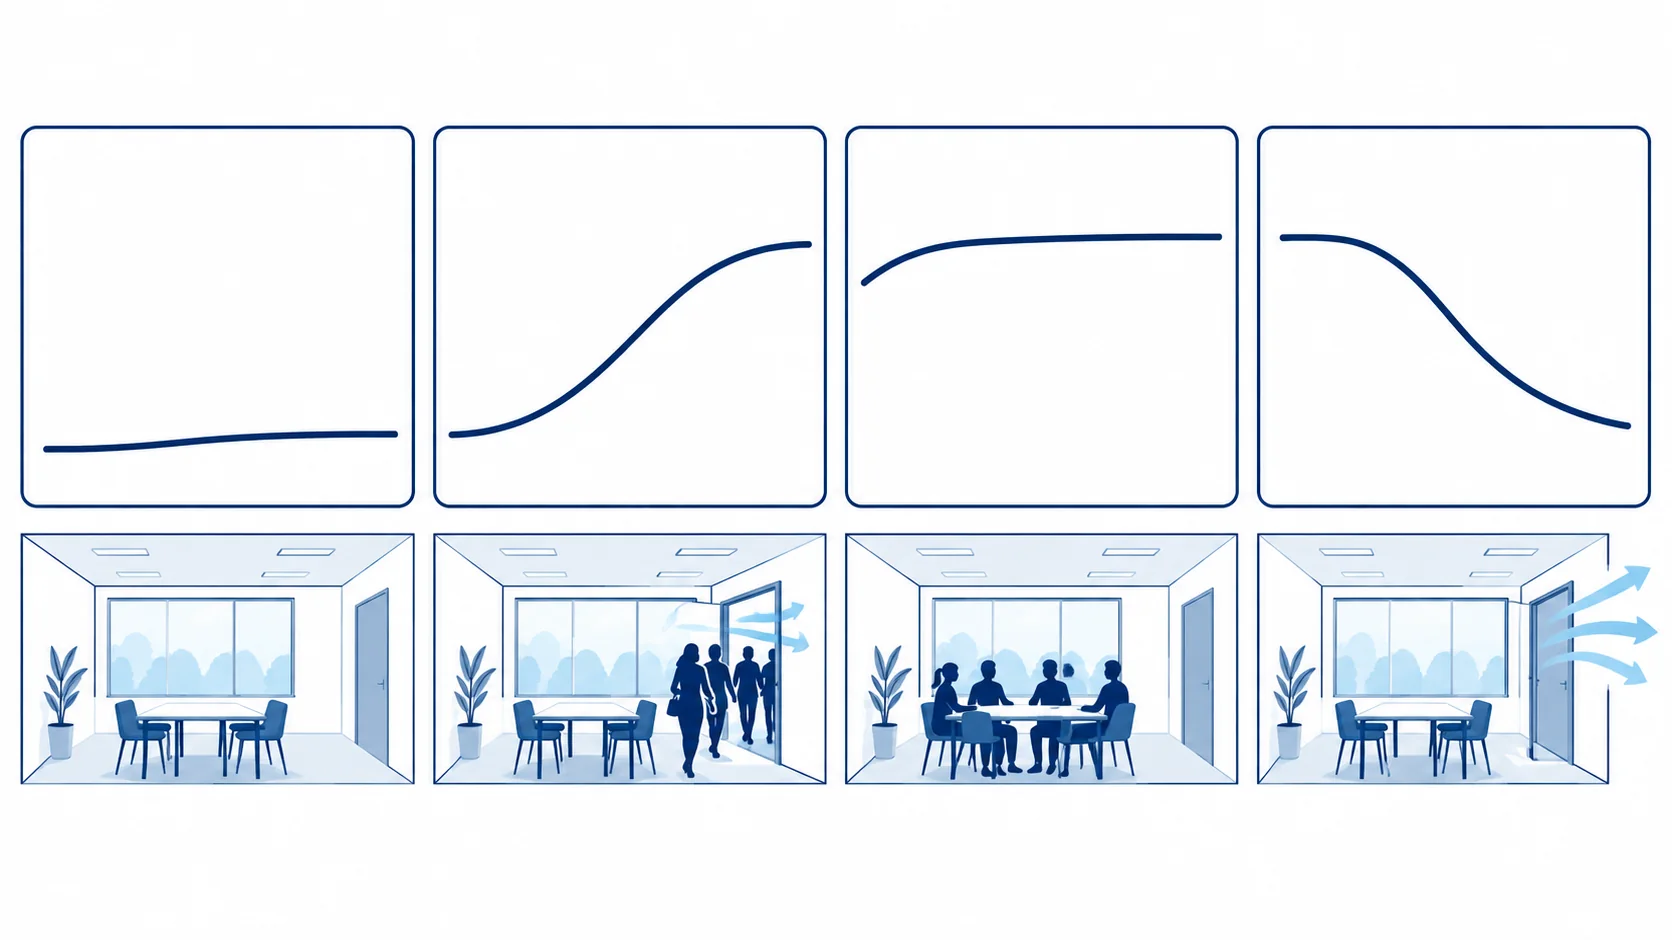
These features can coexist. A family might enter an already occupied living room, produce a rise, open a window and see a partial decline, then close it and reach a different plateau. The useful information is the sequence of events. A screenshot of the highest value alone hides that sequence.
A seven-day home comparison that can answer a real question
Choose one room and one question, such as “Does the existing outdoor-air fan keep the occupied room from climbing continuously?” or “Does opening this particular window change the trace when the same two people are present?” Keep the monitor in the same place. For each observation, record the day and time, occupants, activity, door and window state, outdoor-air system setting, cooking or combustion, and any obvious weather or outdoor-air constraint. If outdoor smoke or pollution is present, record that too; opening a window can lower CO₂ while bringing in another contaminant.
Start with a normal routine for a few days, then change one controllable condition at a time while keeping occupancy and duration as similar as practical. A log need not be complicated. The table below is a template, not collected data:
| Log field | Example of what to write | Why it matters |
|---|---|---|
| Room and monitor position | “Living room, shelf away from window and sofa” | Allows like-for-like comparison |
| Start/end and clock check | Local timestamp, logging interval, missing periods | Reveals resets, gaps and delayed display behavior |
| Occupants and activity | Number present, quiet sitting or active movement | Changes CO₂ generation |
| Air path | Window opening, outdoor-air fan state, door to hallway | Separates outdoor dilution from inter-room mixing |
| Other sources | Cooking, candle, appliance operation | Avoids attributing all change to breathing |
| Outdoor conditions | Weather, smoke, traffic or other known limitation | Explains why an opening may be inappropriate |
| Pattern | Start, sustained rise, plateau, response after change | More informative than one peak |
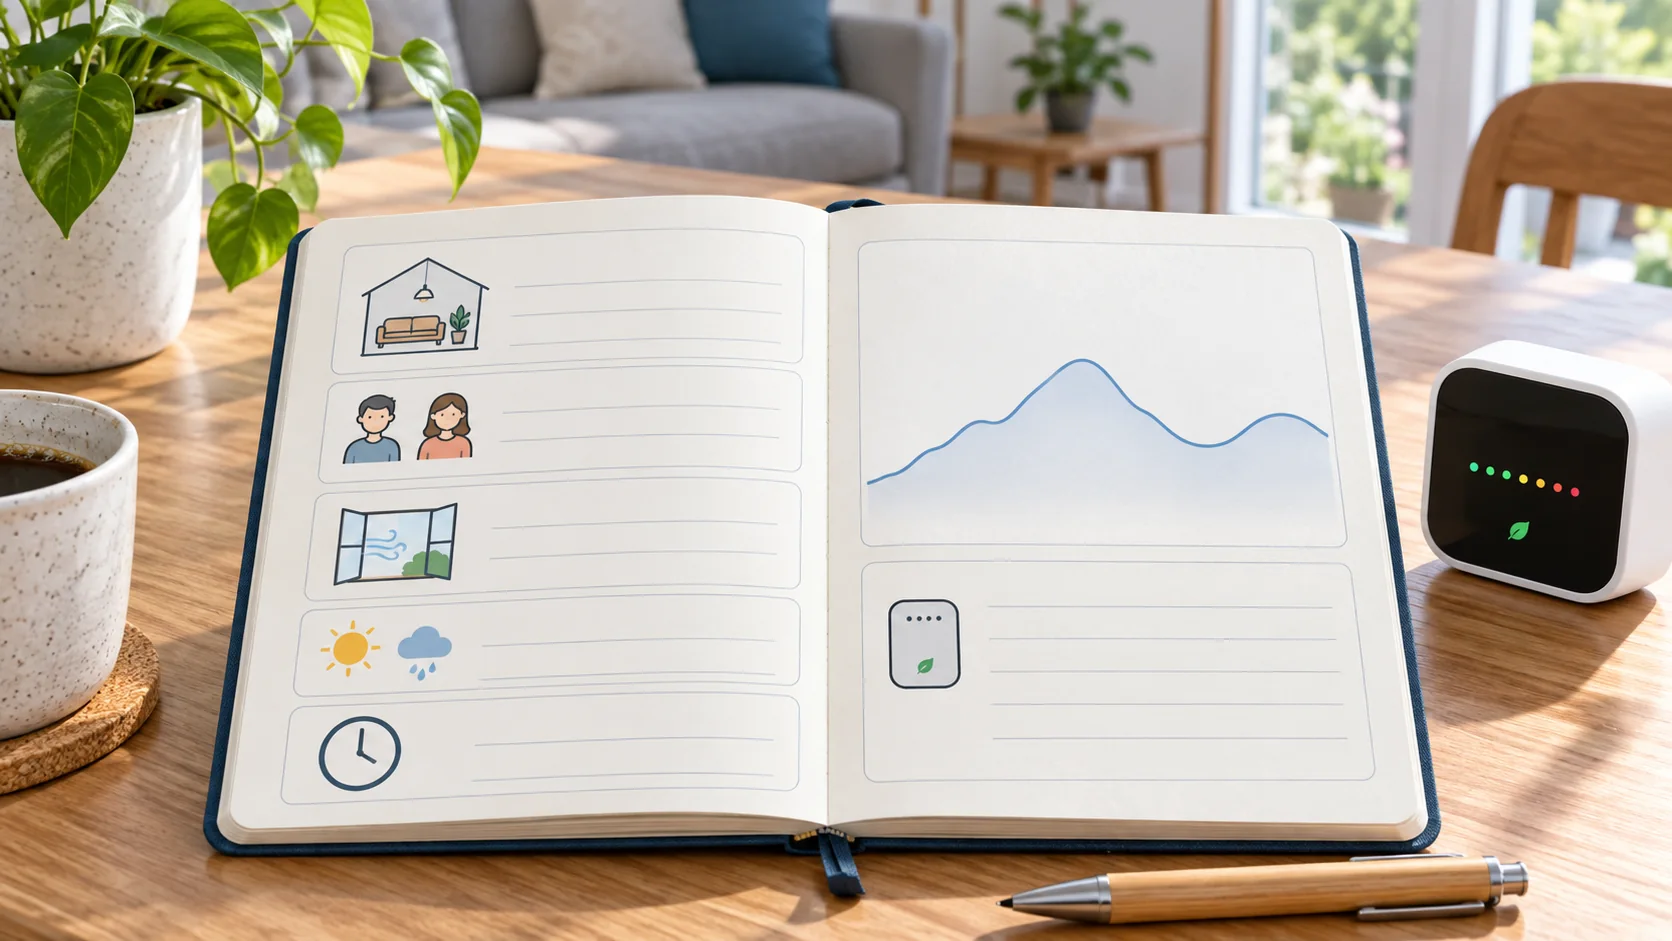
Do not manufacture identical “test nights” by changing normal behavior in unsafe or uncomfortable ways. A useful result can be qualitative: under a similar number of occupants, the room no longer rises as steeply after an outdoor-air pathway is opened. Repeat the observation before making a strong claim. Natural ventilation depends on wind and temperature; a window position that worked on one day may act differently the next. HSE's ventilation advice likewise recommends repeated monitoring as weather and use change.
If an intervention apparently lowers CO₂, first ask what else changed. Did a person leave? Did a door connect the room to a larger space? Did an exhaust fan create replacement air through an unknown route? Did the monitor move closer to incoming air? These are not reasons to abandon the monitor; they are the conditions needed to interpret it properly.
How to judge a change without inventing precision
Write down a testable statement before the comparison, such as “with two people in this room for the same two-hour evening period, the trend should rise less after the existing outdoor-air fan is switched to its intended occupied setting.” Then mark the start and end of that period in both traces. Inspect the entire curve and the event log. If the difference is smaller than the monitor's stated uncertainty, or the weather and occupancy differ sharply, call it inconclusive. If a similar pattern repeats on several comparable days, the qualitative conclusion becomes stronger, even though the exact airflow remains unknown.
Avoid selecting only the most favorable day. A good household record includes the day when the window was opened but wind was calm, the day when a visitor changed the occupancy, and the hour when the logger lost power. Label those conditions so a reader can see why the curves differ. When a large, persistent change is observed under comparable conditions, the next step is to verify the physical air path: where outdoor air enters, where it leaves and whether the occupied zone actually receives it. That follow-up keeps a numerical display connected to a building mechanism.
What the number can and cannot say about health and air quality
Household CO₂ guidance varies by country, averaging period and purpose. Health Canada publishes a residential long-term guideline of 1,000 ppm for Canada. That value is not a universal instant alarm point for every country, age group, room or instrument. ASHRAE notes that the familiar claim “ASHRAE 62.1 sets a universal indoor 1,000 ppm limit” is incorrect. A home chart should lead to a ventilation question and context check, not a blanket safety diagnosis.
CO₂ generated by people often moves with some occupant-related odors and bioeffluents. It does bukan track every indoor hazard. A low CO₂ value does not rule out cooking particles, wildfire smoke, carbon monoxide, radon, a gas leak, excess moisture, mold or a local emission from materials. For CO and CO₂ specifically, different channels are required; our CO versus CO₂ sensor guide explains the distinction. Maintain appropriate purpose-designed alarms and address the actual hazard. Do not use a CO₂ monitor as a substitute.
Neither a high reading nor a reduction in CO₂ alone proves that a person slept badly or that a medical symptom has one cause. ASHRAE's 2025 review describes inconsistent evidence for direct impacts of CO₂ at concentrations commonly seen in non-industrial buildings, while recognizing that CO₂ can be a useful ventilation indicator. Temperature, humidity, noise, particles and other contaminants may change alongside ventilation. An air-quality score can also mask which channel changed; retain the actual concentration series.
Choose an action that matches the cause
If a room repeatedly rises under normal occupancy, identify its outdoor-air path. A window can help when outdoor conditions allow; a properly designed mechanical ventilation system can provide a controllable pathway; some homes need a professional to assess supply, extraction and balancing. Opening an internal door can improve mixing with adjacent rooms but does not by itself prove that the building receives more outdoor air. A fan that only circulates the same air can change local readings without removing the source. It is the whole air path, not the presence of a spinning fan, that matters.
Ordinary HEPA air purifiers are valuable for certain particles, yet their recirculating filter does not meaningfully remove occupant-generated CO₂. Carbon filters are designed for selected gaseous pollutants and should not be treated as a generic CO₂ solution. Use ventilation to address a persistent occupant-generated CO₂ trend while choosing filtration for its own pollutant target. US EPA frames air cleaning as a supplement to source control and clean outdoor-air ventilation.
For an overnight bedroom trace, the timing, door position, occupancy and morning decay need a dedicated reading. A bedroom door may be part of a fire-safety plan; do not defeat it just to chase a monitor value. Consider a designed outdoor-air solution when a closed room persistently lacks adequate exchange.
Troubleshooting a surprising result
| Observation | First checks | What it does bukan prove |
|---|---|---|
| Large spike when someone approaches | Breath plume, sensor location, logging interval | Whole room briefly reached the same peak |
| Low value next to an open window | Supply stream at sensor, room mixing elsewhere | Every occupied corner is equally diluted |
| High value with window open | Wind, opening geometry, occupants, other air paths | The sensor is necessarily broken |
| Sudden drop after door opens | Inter-room mixing, occupant movement | Outdoor ventilation increased by the same amount |
| Flat line all night | Stable conditions atau stale log/power failure | A steady ventilation rate without checking data quality |
| Two monitors disagree | Location, accuracy, calibration, response and averaging | One brand is universally unreliable |
| CO₂ low but room feels unpleasant | Heat, humidity, odor source, particles, other gases | Indoor air quality is acceptable in every respect |
Use the instrument manual when a reading is implausible. A direct CO₂ monitor has an accuracy range, response behavior and environmental limits that belong to the finished product. Our CO₂ monitor accuracy guide explains how to read the specification rather than treating a small display increment as the measurement uncertainty.
Questions homeowners often ask
Is 1,000 ppm automatically unsafe at home?
No single instantaneous number answers that question. A guideline may apply to a particular jurisdiction and averaging period; a room's occupants, outdoor baseline, duration, monitor uncertainty and other pollutants matter. Treat a sustained high trend as a reason to examine ventilation and conditions, not as a stand-alone medical diagnosis or an all-clear below it. See the Health Canada and ASHRAE sources above for the different purposes of guidance values.
Why does my CO₂ reading rise when the window is open?
The opening may supply less outdoor air than expected under current wind and temperature conditions, or the indoor source may be large relative to the exchange. A monitor near someone breathing or a changing internal air path can also alter the trace. Keep occupants and location fixed, record window position, and compare a longer interval rather than one moment.
Can I calculate air changes per hour from one night of data?
Only under a defined measurement method with assumptions about mixing, source generation, baseline and the state of openings. A home graph without those controls supports a qualitative comparison, not a certified building airflow figure. ASHRAE discusses the conditions for using CO₂ as a tracer; a ventilation professional can design a suitable measurement if a numerical rate is required.
Should I keep the monitor outside to calibrate it?
Do not assume that “outdoor” means an exact calibration gas concentration. A brief outdoor comparison can reveal an implausible baseline, but forced or automatic calibration procedures are model-dependent. Follow the manufacturer's instructions and avoid breath, exhausts and sheltered locations during any reference check.
Does a lower CO₂ trace mean my purifier worked?
Usually it means another condition changed or the local air mixed differently. An ordinary particle purifier recirculates air; it is not an outdoor-air supply or a CO₂ scrubber. Check occupancy, door/window state and monitor position, then compare a particle channel separately if evaluating a particle filter.
What if a reading stays high after everyone leaves?
First check the device clock and whether the displayed point is live or the last stored sample. Then consider whether an adjacent occupied room, a lingering combustion source or limited air exchange is maintaining the concentration. A declining trace can take time to approach outdoor conditions, especially when the air path is weak. A reading that never responds to a clear change warrants an instrument check using its manual before a building conclusion is made.
Technical references
- ASHRAE, Position Document on Indoor Carbon Dioxide (2025).
- NIST, Indoor Carbon Dioxide Metric Analysis Tool.
- Health Canada, Carbon dioxide in your home Dan Residential indoor air quality guidelines: carbon dioxide.
- Health Canada, Guidance for indoor air quality professionals.
- UK HSE, Using CO₂ monitors.
- US EPA, Air Cleaners and Air Filters in the Home.
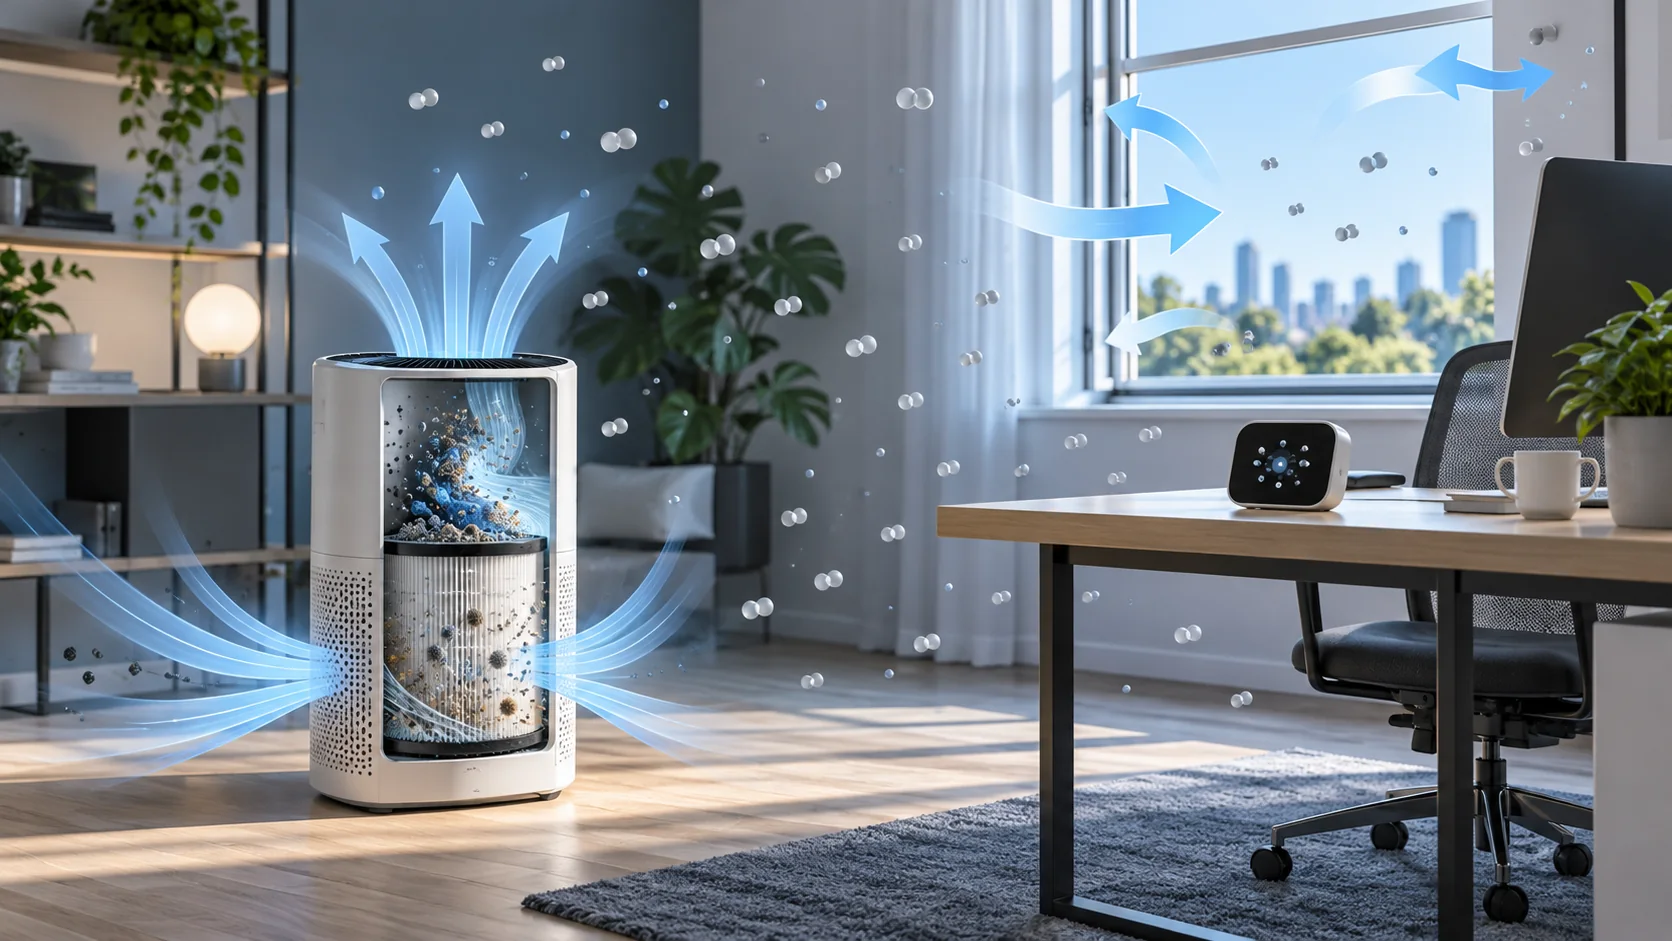
Apakah Pembersih Udara Menurunkan CO2? Pisahkan Filtrasi dari Pertukaran Udara Luar Ruangan
Pemurni HEPA biasa menangkap partikel tetapi tidak menghilangkan CO2 yang dihasilkan penghuni secara berarti. Pelajari cara memisahkan resirkulasi, ventilasi udara luar ruangan, dan memantau efek pencampuran.
Baca selengkapnya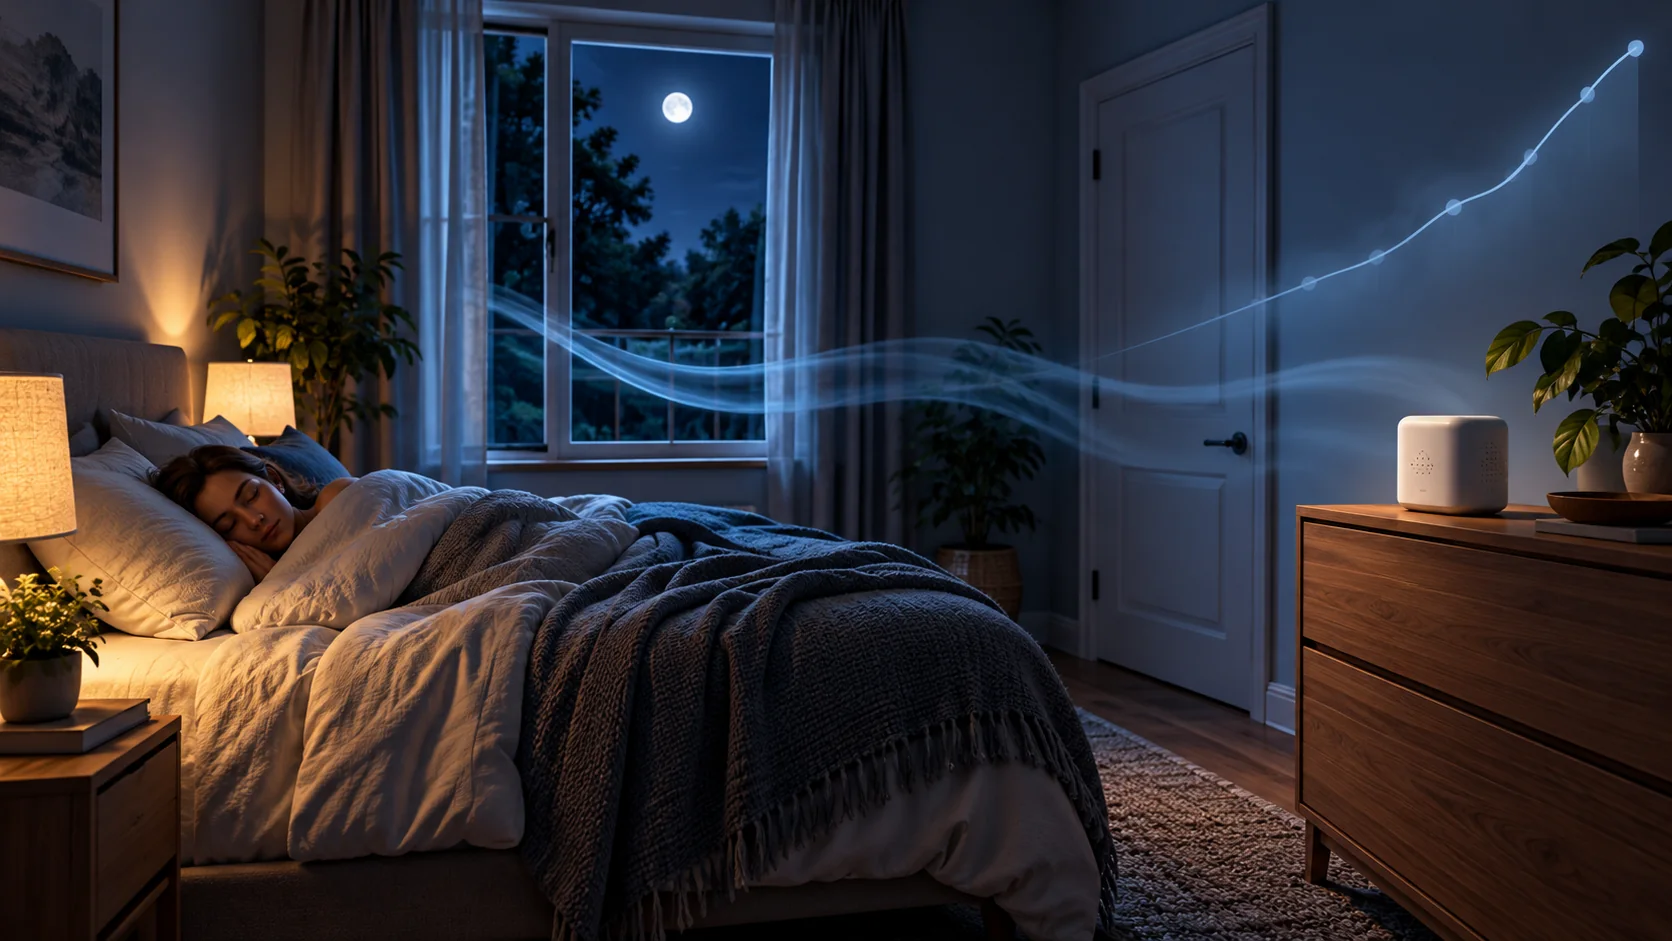
Cara Membaca Log CO2 Kamar Tidur Semalam
Interpretasikan jejak CO2 di kamar tidur semalaman menggunakan tingkat awal, kenaikan, dataran tinggi, dan respons pagi hari sambil memeriksa kualitas logger, jalur udara, dan malam hari yang sebanding.
Baca selengkapnya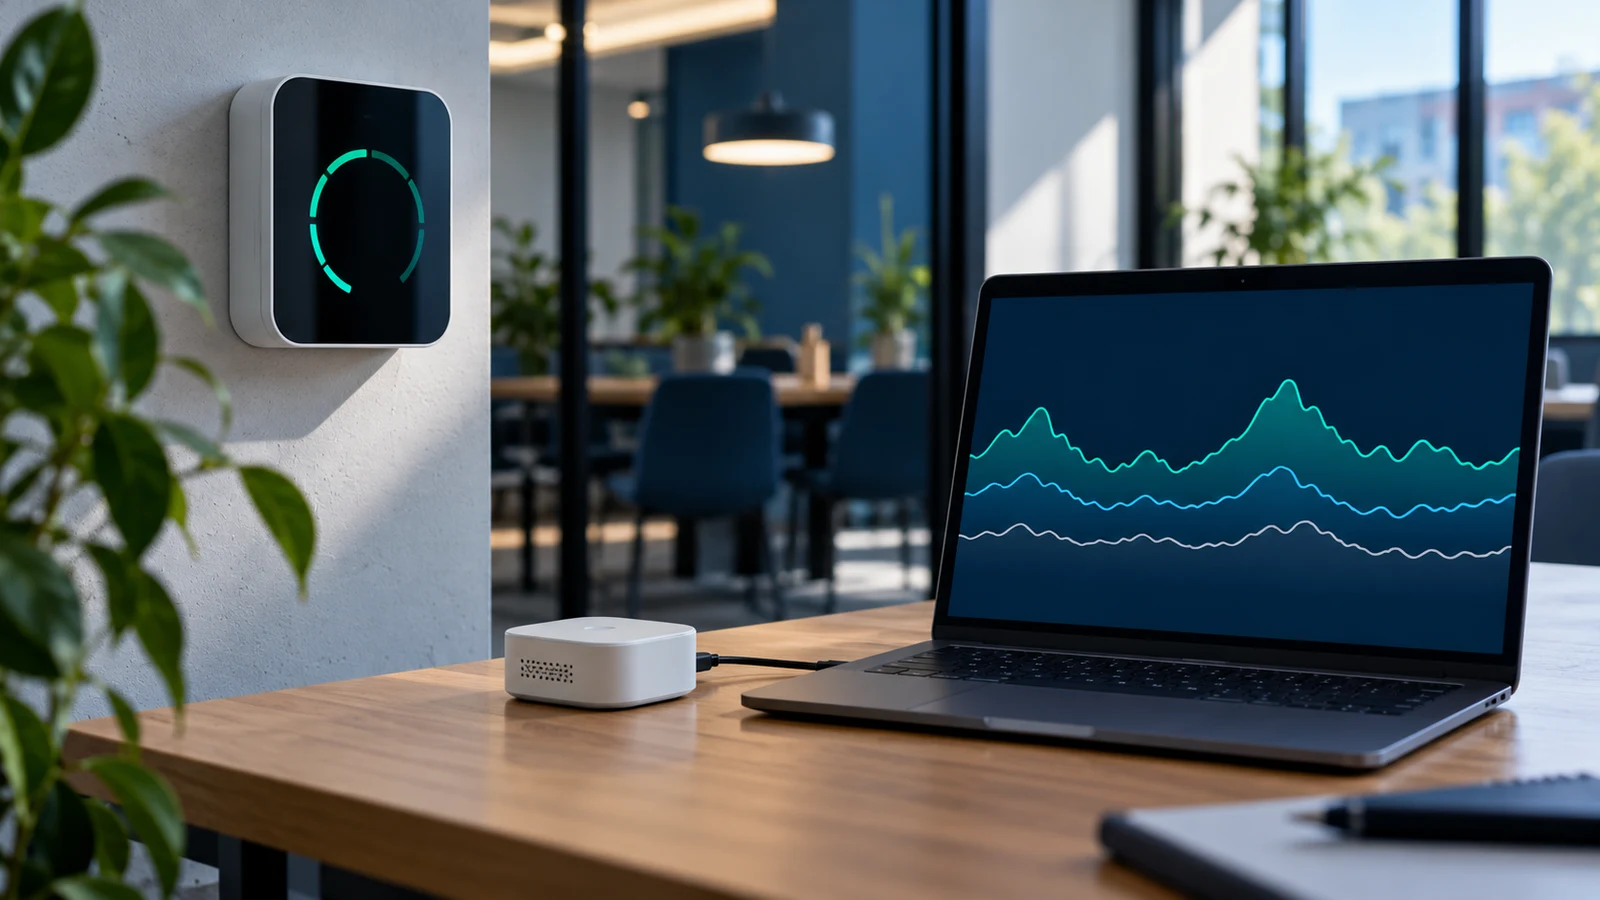
Pencatat Data CO2 atau Tampilan Langsung? Pilih Catatan yang Dibutuhkan Keputusan Anda
Pilih pencatat CO2, tampilan langsung, atau keduanya dengan membandingkan respons sensor, interval pembaruan dan pencatatan, stempel waktu, kesenjangan data, retensi, dan penggunaan.
Baca selengkapnya
Monitor Gas Tunggal vs Multiparameter: Bandingkan Salurannya, Bukan Layarnya
Bandingkan monitor gas tunggal dan multiparameter berdasarkan bukti untuk setiap saluran, lokasi sampel, kualitas data, pemeliharaan, dan tujuan penggunaan.
Baca selengkapnya
Lembar Kerja Persyaratan Pengukuran CO2: Tentukan Pekerjaan Sebelum Memilih Sensor
Buat ringkasan pengukuran CO2 praktis yang mencakup tujuan, sampel, jangkauan, waktu, data, kesalahan, pemeliharaan, dan bukti penerimaan sebelum memilih instrumen.
Baca selengkapnya
Kemurnian CO2 vs Konsentrasi CO2 Ambien: Dua Pekerjaan Pengukuran Berbeda
Kemurnian pasokan CO2 dan ppm CO2 ambien menjelaskan sampel dan analit yang berbeda. Pelajari mengapa monitor ruangan tidak dapat mensertifikasi lot gas dan sertifikat kemurnian tidak dapat menggambarkan udara ruangan.
Baca selengkapnya