
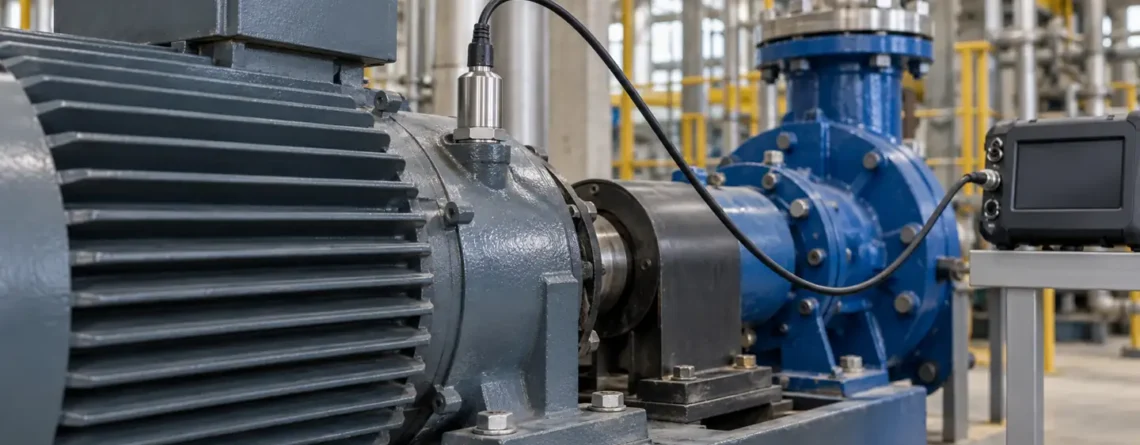
Choose an accelerometer by the motion you need to measure, the acceleration range and frequency band, and the way the sensor will be mounted and read. A three-axis MEMS device that measures gravity and slow tilt may be suitable for orientation monitoring. A piezoelectric vibration sensor may be a better fit for a particular machine's dynamic frequency range. The actual datasheet and installed measurement chain determine suitability; neither technology label guarantees the performance of a complete system.
Start by describing the decision: detect a change in a motor bearing, measure a shock, monitor slow structural motion, or estimate a stationary object's tilt. Then define the expected amplitude, relevant frequencies, environment, sensor location and output. This approach makes the range, noise, mounting and sampling requirements measurable instead of selecting a sensor solely because it has a familiar name.
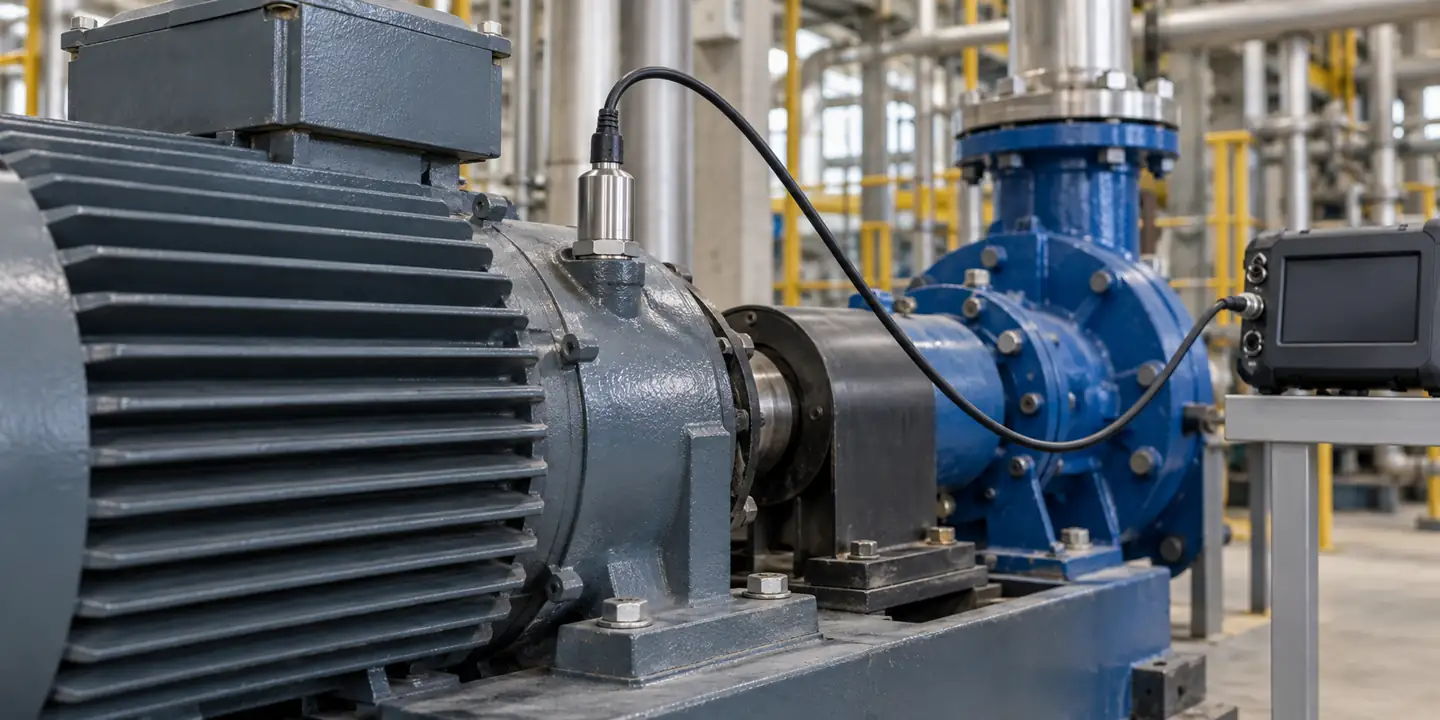
What an accelerometer measures
An accelerometer measures acceleration experienced by its sensing element relative to free fall, often called proper acceleration. At rest on a table, a DC-responsive accelerometer senses the support force associated with gravity. In free fall, an ideal accelerometer reads approximately zero even though the object accelerates relative to Earth. The sign and axis depend on the device's orientation and its coordinate convention.
For a stationary or slowly moving object, the gravity components across axes can be used to estimate tilt. During translation, vibration or rapid rotation, the measured signal also contains motion-related acceleration. A single instantaneous reading cannot always distinguish tilt from linear acceleration. Dynamic orientation systems commonly combine accelerometer data with other measurements and a suitable estimation algorithm; the appropriate approach depends on the accuracy and operating conditions.
An accelerometer does not directly measure displacement or velocity. These can be estimated by integrating an acceleration signal under suitable conditions, but bias, noise, unknown initial conditions and filtering can introduce large errors. For a specific machinery diagnosis, verify whether acceleration, velocity, displacement or another quantity is required and how it will be derived.
| Measurement task | Useful measurement | Primary selection questions |
|---|---|---|
| Stationary tilt | Gravity components and stable zero-g behavior. | Does the device respond to DC? What are bias and temperature effects? |
| Machine vibration | Dynamic acceleration over a defined frequency range. | Does the installed sensor and mount cover the frequencies and amplitudes? |
| Impact or shock | Peak and time history during a fast event. | Can the complete chain avoid clipping and sample the transient adequately? |
| Motion detection | Acceleration changes used to identify activity. | Are axis, range, power and decision latency suitable? |
| Monitoraggio strutturale | Often small signals over low frequencies and long periods. | What noise, drift, synchronization and environmental controls are needed? |
How the sensing element produces a signal
Many accelerometers contain a proof mass supported by a mechanical structure. Acceleration changes the force on that mass, and a sensing mechanism converts the resulting deformation or displacement to an electrical signal. The sensor's mechanical response, electronics, package and filter all influence the result.
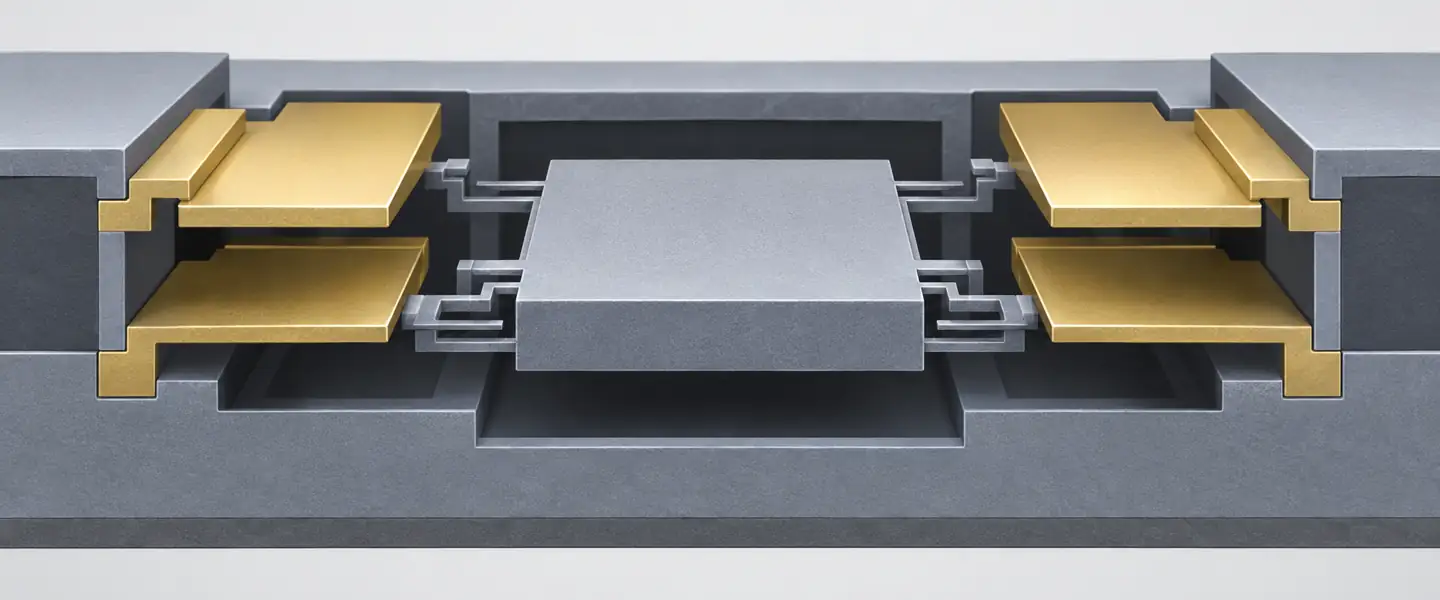
In a capacitive MEMS device, movement changes capacitance between structures in the sensor. Electronics convert that change to analog or digital output. Many designs can measure static acceleration, but bandwidth, noise, range and output depend on the specific device. MEMS describes the manufacturing scale and mechanical structure; it is not a single performance grade.
A piezoelectric accelerometer uses the charge produced when a sensing element is stressed. It is widely used for dynamic vibration and shock. Its usable low-frequency response depends on the sensor and signal conditioning. Conventional AC-coupled piezoelectric systems do not provide a sustained DC gravity reading for static tilt. Check the complete sensor and conditioning specification rather than treating a brief transient response as a stable tilt output.
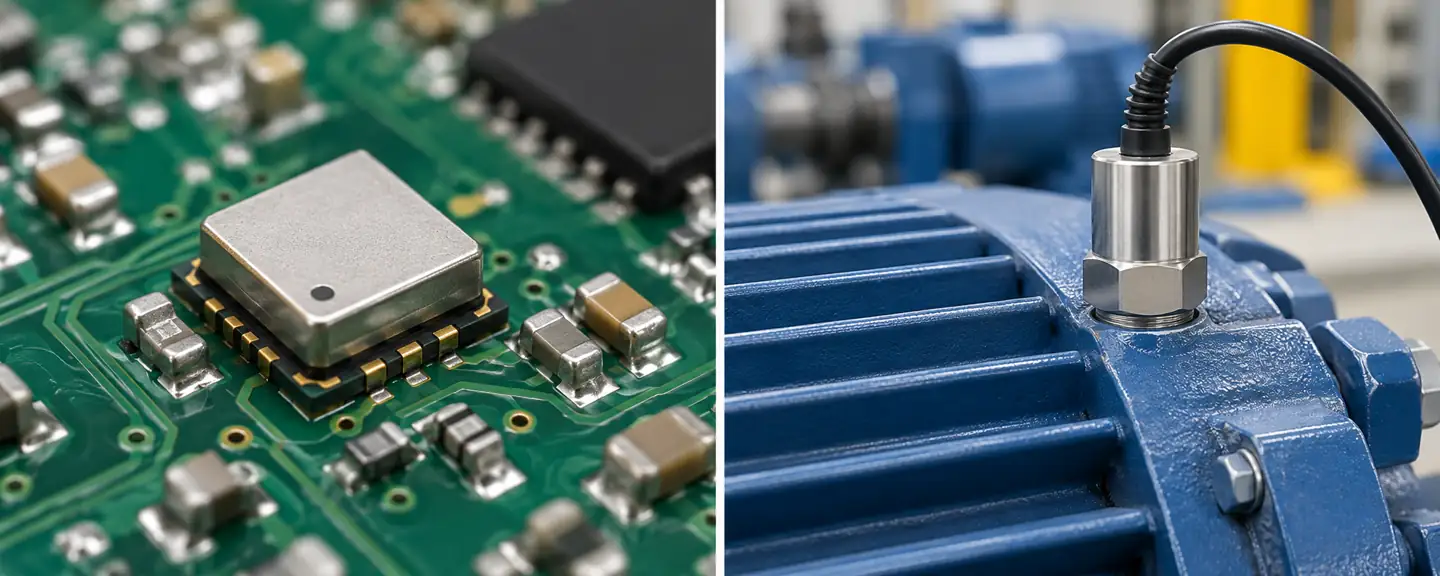
IL Analog Devices MEMS selection guide explains why bandwidth, range, noise and bias matter differently across applications. PCB Piezotronics' introduction describes piezoelectric vibration sensors and their conditioning. Use those principles to interpret an exact model's specifications rather than copying one example into a general requirement.
Range, sensitivity and clipping
The acceleration range is the input interval over which the device is specified to measure. A sensor can saturate or clip when an event exceeds its range, losing the real peak and distorting the recorded waveform. A mechanical shock survivability rating is not the same as a measurement range: a sensor might survive an event it cannot accurately record. Check both the sensing element and the acquisition electronics.
Choose a range that includes expected normal vibration and credible transients with suitable margin. A very large range may reduce the useful resolution for a small signal, depending on the device and output configuration. Conversely, a narrow range that performs well during steady operation may clip during startup or impact. If the system offers selectable ranges, verify how sensitivity, noise, output format and calibration change with the setting.
Sensitivity describes the change in output for a change in acceleration under defined conditions, such as mV/g or digital counts/g. It is not, by itself, the smallest detectable acceleration. For an illustrative sensor with 100 mV/g sensitivity, a 2 g dynamic signal corresponds to 200 mV under the assumed linear conditions. The real output limits, bias, frequency response and signal conditioner must still be checked.
One standard gravity, g, is conventionally approximately 9.80665 m/s². Specify whether a vibration figure is a peak, peak-to-peak or RMS quantity. These describe different properties and should not be interchanged without knowing the waveform. A single conversion factor between peak and RMS applies only to a specific waveform, such as an ideal sinusoid; it is not a general rule for random machinery vibration or shock.
Noise density, bandwidth and the smallest useful signal
Noise limits the ability to distinguish a small signal from random output variation. Manufacturers may quote noise density in µg/√Hz and a total RMS noise under a defined bandwidth and filter. For approximately flat noise density and an idealized equivalent noise bandwidth, total RMS noise scales approximately with the square root of that bandwidth. Actual filter shape and other noise sources matter.
For example, a hypothetical flat density of 50 µg/√Hz over an equivalent noise bandwidth of 100 Hz gives approximately 500 µg RMS from that component alone: 50 multiplied by √100. This is an illustrative calculation, not a sensor specification or a peak detection guarantee. A different filter, frequency-dependent noise or electronics noise changes the result. Analog Devices' definitions describe noise density and bandwidth in the context of its devices.
Reducing bandwidth can reduce integrated noise, but it also removes useful motion above the filter cutoff. Define the frequency content needed for the decision before narrowing the band. For tilt, bias stability and temperature-related offset may matter more than high-frequency bandwidth. For vibration, noise within the analysis band, mounting and the signal chain can dominate. Resolution in an ADC or digital output alone does not establish measurement accuracy or noise floor.
Frequency response belongs to the installed system
An accelerometer's frequency response states how its output changes with input frequency, often with a tolerance around a reference sensitivity. A datasheet's resonance frequency is not automatically the upper frequency limit for accurate measurement. Near resonance, response can be amplified and phase can change. Use the specified usable frequency range and tolerance for the exact model and mounting arrangement.
The sensor is mechanically connected to the structure through a mount. Studs, adhesive, magnets, brackets and handheld probes can change stiffness, mass and resonance. A soft or loose connection can attenuate or distort high-frequency motion. A heavy sensor can also alter the behavior of a light test structure. Compare the sensor and mounting assembly with the object being measured rather than treating mounting as a purely mechanical convenience.
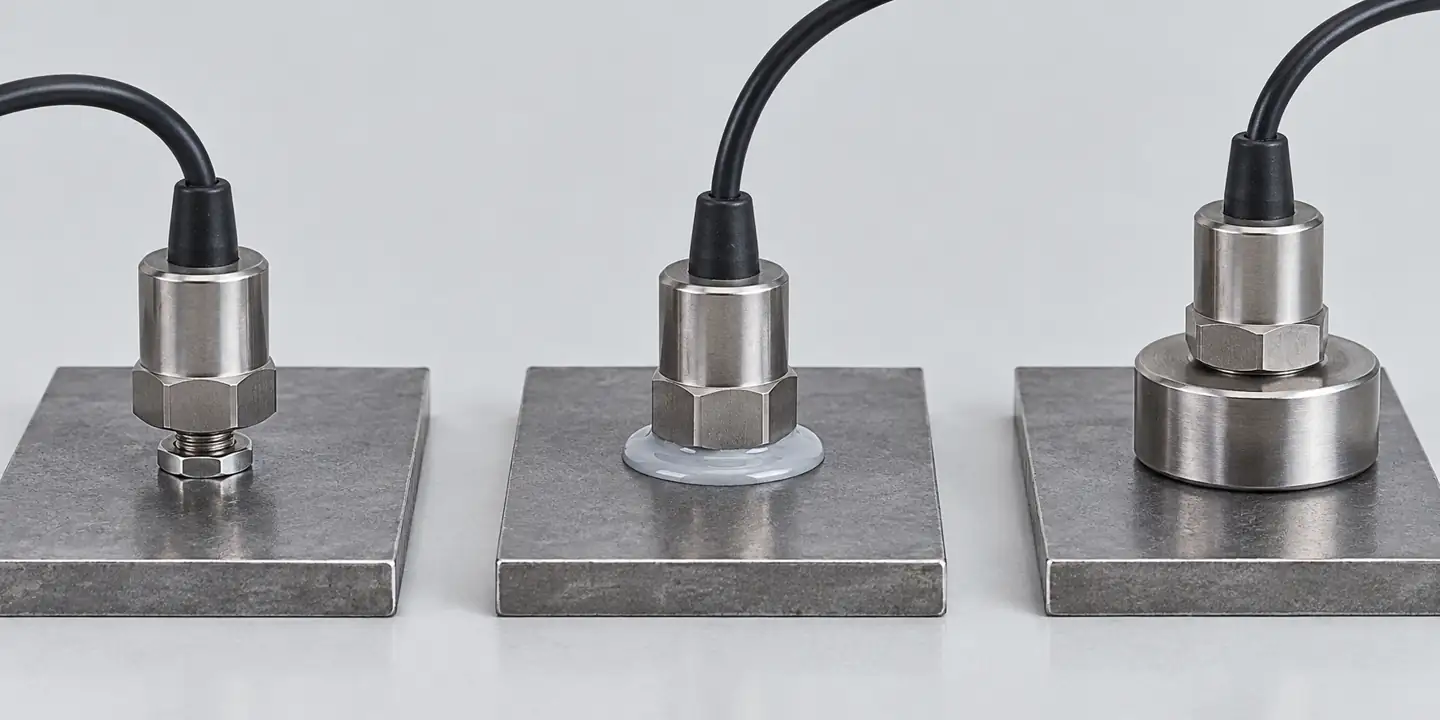
PCB Piezotronics' mounting guidance describes how mounting affects the usable response. A properly prepared stud mount can provide a stiff connection, but the right method also depends on access, surface, sensor design, safety and whether the installation is temporary. Follow the specific manufacturer's surface preparation, mounting hardware and torque instructions. Do not apply a generic torque or frequency limit to an unidentified sensor.
Sampling and aliasing
Sampling a signal too slowly can make frequency components above the Nyquist frequency appear at lower, incorrect frequencies. The Nyquist limit is half the sampling rate, but choosing a rate exactly twice the highest frequency of interest does not leave a practical transition band for a real anti-alias filter. Select the rate, analog or digital filtering and analysis bandwidth together. Verify what filtering is already inside the sensor or acquisition device and what remains to be supplied.
Output data rate and sensor bandwidth are related but distinct specifications. A digital accelerometer can report samples at a high rate while an internal filter limits the usable signal band. Conversely, high-frequency noise or vibration entering an inadequately filtered acquisition path can alias into the band of interest. The Analog Devices noise-performance note illustrates filtering and bandwidth for a specific model; its figures are not universal settings.
Why the analysis window matters
Sample rate does not determine how well nearby frequencies can be distinguished. The length of the recorded time window and the analysis method also matter. For a simple Fourier transform, frequency-bin spacing is the sample rate divided by the number of samples, equivalently the inverse of the recording duration. A two-second record has nominal bins spaced 0.5 Hz apart; that statement alone does not guarantee two closely spaced components can be resolved, because windowing, noise and signal behavior also matter.
Short records can miss an intermittent event; long records can mix different machine states. Record the operating speed and load, and use analysis settings suited to the question. If a machine accelerates during a measurement, a frequency peak may shift during the record. A baseline gathered at steady speed should not automatically be compared with a transient without noting that difference.
The processing chain can also change reported amplitude. A high-pass filter may suppress a slow trend, while averaging may hide brief impacts. Store the raw or least-processed data when practical, together with sample rate, filter, window and units. That context lets another engineer reproduce the calculation and decide whether a later change is physical or caused by a configuration update.
Axis, location and mounting orientation
A single-axis sensor measures along its sensitive direction. A three-axis device supplies multiple components, but its axes still need to be aligned and documented. Mark the sensor's coordinate system relative to the machine or structure. A change in orientation can change a trend even when the underlying motion is unchanged. Cross-axis sensitivity and alignment error also matter when comparing small components.
Place a machine vibration sensor where motion relevant to the diagnosis transfers reliably into the sensor, often near the bearing or component of interest. A thin guard, loose cover or flexible bracket may have its own vibration response. The best location depends on the machine, fault mechanism and monitoring method; a sensor on a convenient panel is not necessarily representative of the bearing.
For a lightweight component, evaluate mass loading from the sensor, cable and mount. Route cables so they do not pull on the sensor, rub on moving parts or introduce motion. Check connector sealing and strain relief for the environment. Repeat measurements with the same position, axis and mounting method when trend comparability is important.
Electrical output and acquisition compatibility
MEMS accelerometers can provide analog voltage, digital serial data or a module-level industrial output. Confirm supply voltage, output format, scaling, sample rate and timing with the receiver. Digital values must be converted using the sensitivity and selected range for the exact configuration. A firmware change that changes filtering or data rate should be recorded with the measurement history.
Piezoelectric systems may use a charge output requiring a suitable charge amplifier, or an integrated-electronics design such as IEPE requiring compatible constant-current excitation and signal conditioning. Their wiring and supply requirements are different. A standard voltage input cannot be assumed to power an IEPE sensor correctly, and a charge-output sensor cannot be treated as an ordinary powered voltage transmitter. Consult the sensor and acquisition manuals for the complete combination.
IL NI vibration guide explains the relationship between sensor type, excitation, coupling and data acquisition. Check temperature limits for both the sensing element and its electronics, and note whether the stated cable length or connector arrangement affects the installation.
Consider power, temperature and the entire enclosure
The sensor's storage temperature, operating temperature and range over which accuracy is specified may be different. A device that survives a hot machine enclosure does not necessarily meet its room-temperature accuracy there. Check temperature effects on sensitivity and zero, as well as connector, cable and mounting limits. Repeated thermal cycles may also change a mount or cable routing even when the electronics continue to operate.
Humidity, washdown, oil and electromagnetic interference can affect the installed system. An enclosure rating should be interpreted under its defined test conditions; it does not automatically establish compatibility with a particular cleaning chemical or continuous immersion. For an outdoor or battery-powered installation, account for the acquisition device, communications and enclosure as well as the sensor itself.
When comparing low-power devices, use the current consumption for the actual output rate, filter setting and operating mode. A wake-on-motion feature may reduce average power but can miss or alter the record of events depending on its threshold and wake latency. Decide whether the system must retain the entire waveform or only flag an event, and test that behavior in the intended configuration.
Verify before relying on the trend

Record the sensor model, serial number, sensitive axis, mounting position, orientation, hardware, range, sample rate, filter settings and date of installation. Confirm that the instrument reports the expected units and that the acquisition channel uses the correct sensitivity. A value can appear plausible with a factor-of-ten scaling error, so verify the configured conversion against the sensor's calibration information.
For a DC-responsive accelerometer used for tilt, a controlled orientation check against gravity can reveal an axis or gross scaling mistake. It does not by itself establish dynamic frequency response, low-noise performance or full calibration. For vibration measurements, use a suitable reference or calibrator within its specified conditions. Record the input, frequency, sensor configuration and observed output; follow the applicable manufacturer or laboratory procedure.
| Symptom | Possible contributors | Useful first check |
|---|---|---|
| Flat-topped peaks | Sensor, amplifier or ADC clipping. | Review raw waveform, range and output headroom. |
| Unexpected high-frequency change | Mount looseness, cable motion, sensor response or a real structural change. | Inspect mounting and compare under the same machine state. |
| Apparent low-frequency drift | Bias, temperature, integration or motion of the support. | Review temperature and raw acceleration before integration. |
| Frequency appears in the wrong band | Aliasing or incorrect sample-rate configuration. | Check filters, data rate and acquisition settings. |
| Different results after replacement | Changed axis, mount, sensitivity or processing. | Compare installation records and configuration. |
Calibration supports traceability at stated conditions. It cannot guarantee that an installation has the correct mounting, bandwidth or location. A meaningful acceptance check follows the signal from the mechanical interface through sensing, conditioning, sampling, processing and display.
Selection worksheet
Write down the motion and the decision first. Then specify the frequency band and amplitude range, whether DC response is required, the number of axes, relevant noise and bias limits, mounting surface, environmental conditions, cable requirements and available acquisition interface. Include the highest credible transient and the smallest change that matters.
Ask vendors to identify the exact part number, frequency-response tolerance, measurement range, shock survivability, noise and temperature conditions. Request mounting and electrical requirements for the proposed configuration. If a filter, mounting base or external conditioner is needed, include it in the evaluation; a sensor-only specification cannot describe the complete installed response.
Run a pilot where possible under representative conditions. Compare the mounted output with a suitable reference and check for clipping, loose mounting, aliasing and inconsistent operating states. For a trend application, preserve raw data and document the processing settings so future readings can be compared on the same basis.
Three example selection paths
Slow tilt of a stationary enclosure. Start with a DC-responsive sensor and a defined orientation range. Ask how zero-g offset, sensitivity error, axis alignment and temperature affect the inferred angle. Verify the reading at known orientations and under the expected temperature conditions. A sensor with excellent high-frequency response may add little value if bias stability is inadequate for the angle decision.
Routine vibration trend on a motor. Identify the bearing or measurement point, expected machine speed, frequency band and normal operating condition. Select a sensor and mounting arrangement with adequate installed response and dynamic range; confirm the acquisition system supplies the correct excitation where required. Establish a baseline at a repeatable load and speed. A numerical change does not identify a particular bearing fault without the appropriate diagnostic context.
Short impact on a product. Estimate the credible peak and event duration, then check both measurement range and survivability. The sensor, conditioner and ADC all need enough headroom. Select sampling and filtering to preserve the event features of interest and use a mounting arrangement that follows the object without materially changing the event. Examine the raw waveform for clipping before reporting its peak.
These examples are design starting points, not universal part recommendations. A system may need multiple sensors or additional measurements to capture different locations, axes or operating modes. Selecting from a catalog should follow the field question and its uncertainty requirement.
Questions to ask before accepting a quotation
Which frequency-response tolerance applies to the proposed mounted configuration? Is the quoted range the linear measurement range or the survivable shock limit? Is noise stated as density or total RMS, and what bandwidth and filter were used? What are the sensitivity and zero changes over temperature? For a digital device, which output data rate and internal filter are selected? For an IEPE system, what excitation and input coupling are required?
Also ask how the sensor is calibrated, what reference frequency is used, and whether a calibration certificate applies to the complete assembly or only the sensor. These questions make apparently similar catalog entries comparable and reveal where a separate mounting or acquisition cost may be required.
Keep measurements comparable over time
For a monitoring program, give each measurement location a stable identifier and retain photographs or drawings of the sensor position and orientation. Record the machine's speed, load and operating mode at the time of the reading. A change in sensor position or processing can create an apparent trend even if the machine itself has not changed.
When a sensor is replaced, compare the new device with the previous measurement arrangement under a representative condition where feasible. Document sensitivity, calibration, cable, mount and filter settings. If exact comparison is not possible, annotate the change rather than silently joining two data series. A useful trend is one whose measurement conditions are known well enough to explain what changed.
Domande frequenti
Can an accelerometer measure tilt?
A DC-responsive accelerometer can estimate stationary tilt from gravity components. During motion, linear acceleration and vibration can influence that estimate; dynamic orientation may require additional sensors and processing.
Is MEMS always less capable than piezoelectric?
No. MEMS and piezoelectric devices span different ranges of performance. Compare the particular sensor's bandwidth, noise, range, temperature behavior and interface against the task.
Does a high sample rate guarantee accurate high-frequency data?
No. Sensor response, mounting resonance, anti-alias filtering and acquisition bandwidth also limit the useful measurement band. A high output rate cannot recover motion the mounted sensor cannot measure accurately.
What is the difference between sensitivity and resolution?
Sensitivity relates a change in input acceleration to a change in output. Resolution concerns the smallest distinguishable change under stated conditions and depends on noise, bandwidth and signal processing.
Can I integrate acceleration to get displacement?
It is possible under suitable conditions, but offsets, noise, filtering and unknown initial conditions can produce substantial drift. Validate the resulting displacement for the intended frequency band and decision.
Is a magnetic mount equivalent to a stud mount?
Not necessarily. The added mass and stiffness of the mount affect mechanical response, particularly at higher frequencies. Test and use the manufacturer's guidance for the actual mounting assembly.





lascia un commento