
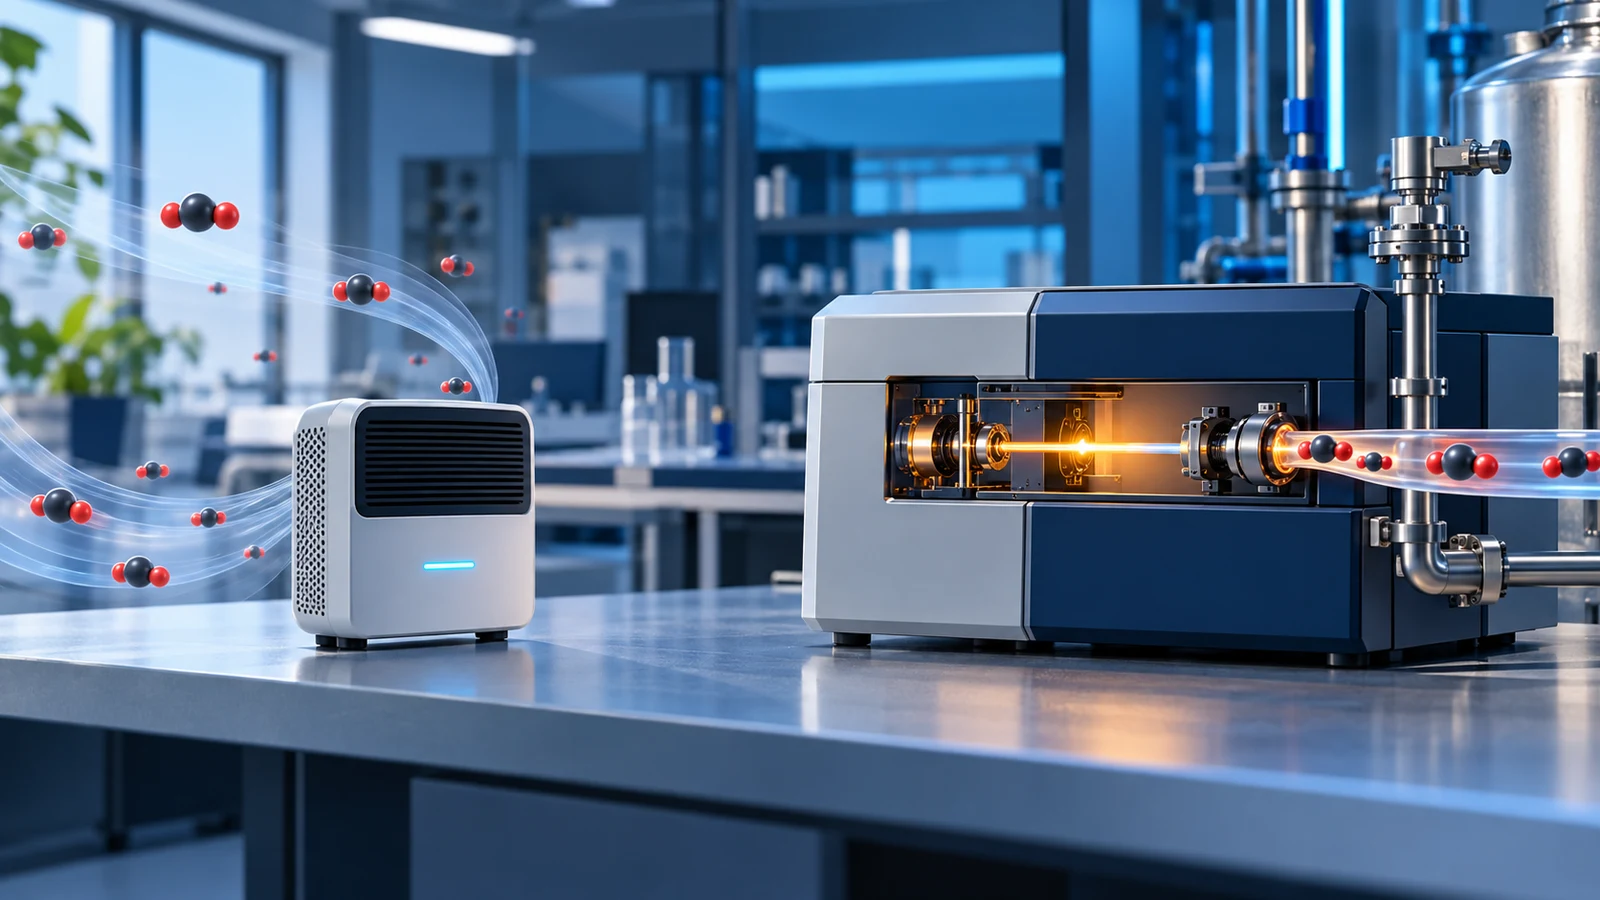
A CO₂ monitor usually tracks carbon dioxide at a defined place over time and presents information for observation, ventilation control or another stated purpose. A gas analyzer is commonly chosen when the composition of a defined sample stream must be measured and documented under controlled sampling conditions. The names overlap in product catalogs, so the decisive difference is not a box shape or price: it is which gas is sampled, how the sample is conditioned, what uncertainty applies, and what decision the output must support.
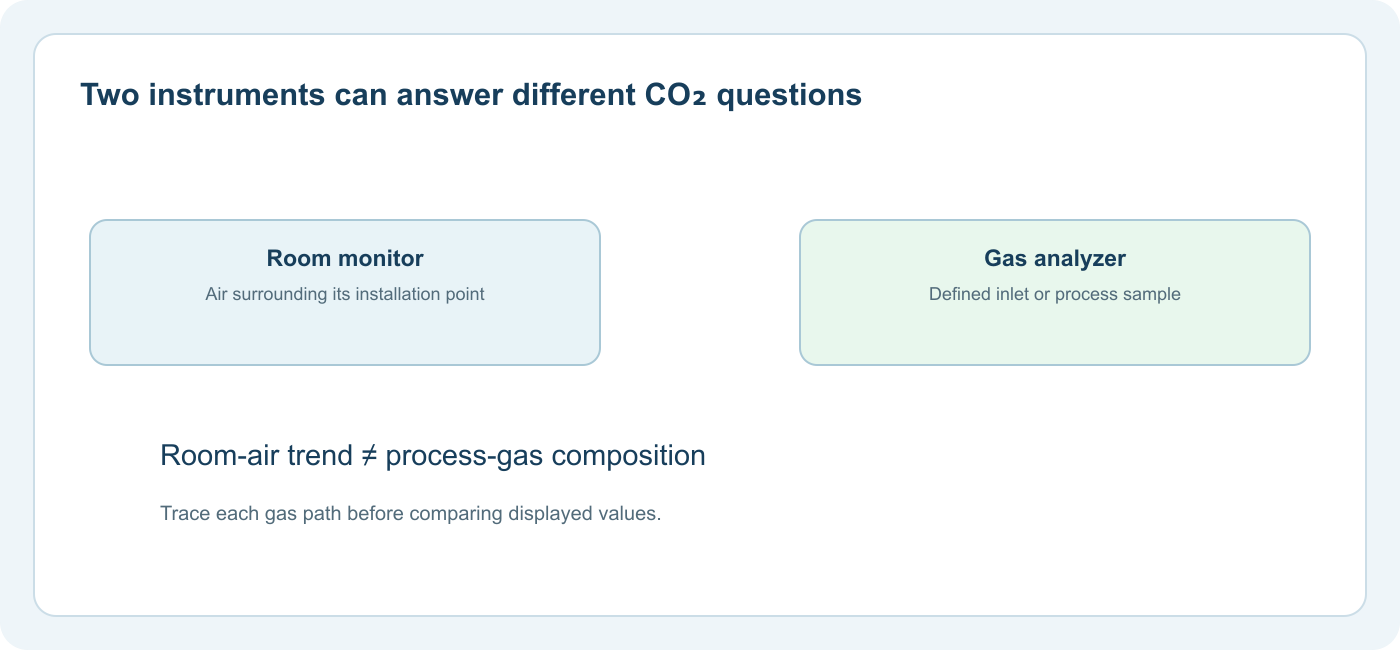
A wall-mounted room monitor cannot tell you the concentration inside a fermentation line. A process analyzer connected to that line cannot tell you whether nearby occupied air has the same concentration. Both may use infrared CO₂ technology, yet the sample path and evidence requirements are different.
Define the Measurement Question Before Naming the Instrument
The most useful brief begins with a sentence: “We need the CO₂ concentration of [specific sample] over [time and operating states] to decide [specific action].” If the sample is room air, decide whether one location is representative and what time record matters. If it is process gas, document the tap point, expected range, pressure, temperature, water content, flow and contaminants. If the result is used in a detection or alarm system, assess the complete equipment's intended use and installation requirements.
This framing avoids a common mistake: buying an apparently precise analyzer to answer a poorly defined location question, or using a convenient room monitor as evidence about a closed process. Our CO₂ measurement guide explains the full sample-to-output chain.
What a Typical Room CO2 Monitor Does
A room monitor admits surrounding air through its enclosure and reports a concentration at that installation point. It may display a live value, average it, log it or communicate it to ventilation equipment. Its useful strengths can be simplicity, continuous trend visibility and a direct link to the occupied-space question. It must still be placed and interpreted in context.
O US EPA's indoor-monitor guidance explains that a monitor may combine several sensors and only measures the parameters it was designed to measure. ASHRAE's indoor CO₂ position document cautions against treating a single indoor CO₂ value as a universal measure of ventilation or indoor air quality. A classroom, meeting room or office can have spatial and temporal variation. The instrument's location and logging period therefore belong beside any plotted trend.
A room monitor's displayed resolution should not be mistaken for its uncertainty. If a device shows a one-ppm increment, that alone does not prove one-ppm accuracy. For a ventilation trend, repeatability, drift, sampling location and averaging may be more important than the smallest digit on the screen.
What an Analyzer Adds to a Defined Sample
An analyzer is generally selected for a measurement process in which sample introduction and data handling are explicit. It may use a pump or a flow-through cell, provide pressure or water-vapor channels, support calibration procedures and output data with timestamps or diagnostic information. It may also be a probe incorporated into a larger system. These are possible capabilities, not a universal checklist that every product with “analyzer” in its name must satisfy.
LI-COR's LI-830/LI-850 specifications show a concrete analyzer example: measurement range, response definition, optical-cell volume, pressure compensation, gas-flow limit, outputs and, on the LI-850, an H₂O channel are all specified. Vaisala's GMP343 documentation provides another example with distinct diffusion and flow-through variants. These examples demonstrate what a sampling-aware specification looks like; neither implies that every analyzer has the same features or range.
An analyzer is not automatically “more accurate” than every monitor. A high-quality monitor and a poorly installed analyzer can each be useful or misleading for different tasks. Compare documented error under the actual sample conditions.
The Gas Path Is Often the Real Difference
| Question | Ambient monitor | Defined-sample analyzer |
|---|---|---|
| Where does gas come from? | Air around the installation point | Specified inlet, process tap or sampling probe |
| How does it reach the optical cell? | Usually diffusion through an enclosure | Often tubing, flow-through cell or controlled aspiration |
| What affects response? | Enclosure openings, local airflow and filtering | Tube length and volume, pump/flow, filters, cell and processing |
| What can distort the sample? | Local breath plume, poor placement, heat or drafts | Leaks, pressure change, condensation, adsorption or contamination |
| What should be recorded? | Location, time, settings and device status | Tap point, flow, conditioning, pressure, calibration and data basis |
For a remote sample, the gas at the inlet may not be identical to the gas at the detector at a given moment. Transit time and mixing matter. Moisture may condense if a warm humid stream cools in tubing. Filters can protect an optical cell but also need inspection. Pressure changes can affect a gas measurement or its reporting basis. Those details are part of the analyzer system, not minor accessories.
For a room monitor, the measurement can be locally valid but unrepresentative of the whole space. That is a sampling problem too. A device beside a door, supply vent or a person's exhaled plume may follow a local pattern. Moving it changes the question being answered.
A Simple Tube-Delay Calculation
Consider a hypothetical 3 m sample tube with a 4 mm internal diameter. Its internal gas volume is π × (0.002 m)² × 3 m ≈ 0.0000377 m³, or about 37.7 mL. At a hypothetical flow of 0.5 L/min, equivalent to about 8.3 mL/s, one tube volume takes about 4.5 seconds to move through at the average flow. This is only an idealized volume/flow estimate. Connections, filter and cell dead volume, imperfect mixing, flow variation and instrument averaging can extend or blur the actual inlet-to-record response. It would be wrong to report 4.5 seconds as the analyzer's measured response time.
The calculation is useful because it tells an engineer which quantities to collect: tube inner diameter and length, flow at the relevant conditions, added volume and the desired time resolution. If the event of interest lasts only a few seconds, a long sample route may be unsuitable even if the optical sensor itself updates rapidly. For a slow process trend, the same delay may be acceptable if it is documented and the sample remains representative.
Compare the Concentration Range and Reporting Basis
Range should cover the expected sample, including the concentrations at which decisions are made. Ordinary room-air trends and enriched process streams can occupy very different parts of the CO₂ scale. 10,000 ppm equals 1% on the same fraction basis, but conversion does not make instruments interchangeable. Our ppm-versus-percent range guide separates output range, accuracy interval and application range.
For an analyzer, determine whether the result is expressed as wet-gas fraction, dry-gas fraction, or another defined basis. If water is removed before analysis, the denominator changes. If a water-vapor channel is available, learn how the instrument reports and corrects CO₂. For a room monitor, ask how pressure or altitude is handled and whether the display applies environmental compensation. The applicable manual decides; there is no generic conversion that repairs unspecified sample handling. Our wet versus dry CO₂ readings guide works through the conditional conversion and sample-path checks.
An analyzer may report several channels, including pressure and water vapor, because the measurement task requires them. A room monitor may report CO₂, temperature and relative humidity for a different task. A larger number of outputs does not by itself prove better measurement quality.
Time Resolution and Logging Must Match the Decision
A live display can be enough to notice a slow occupancy trend, while a process investigation may require a time series aligned with valve position, flow or other operations. The relevant time interval is the full inlet-to-record response, not the optical sensor's update rate alone.
For instance, the GMP343 data sheet presents response figures for particular diffusion and flow-through configurations and averaging settings. That is the right way to state response: specify the configuration and definition such as a 90% step response. A different enclosure or tube can change the measured system response.
When logging data, record the sample point, timestamp, units, averaging interval, calibration state and error flags. For comparative studies, align clocks and note events that can change the gas sample. A visually smooth curve without these details can conceal a delayed or invalid signal.
Calibration and Evidence Are Task-Specific
Both monitor and analyzer may need calibration or checks, but procedures differ by model and duty. A room monitor may employ an automatic baseline algorithm that assumes periodic exposure to a suitable reference environment. A continuously enriched process may violate that assumption. An analyzer may provide user calibration points or reference-gas checks appropriate to its application. None of these statements mean that one device category never needs service.
Read the exact product manual for calibration frequency, conditions, reference gas, stabilization and whether a full-system check is required after installation. A sensor module's factory calibration is useful evidence about the component, but module-versus-monitor integration adds sampling and processing effects. Gasnose's guide to gas-sensor drift helps separate zero and span changes when reviewing long-term data.
If a result is used for a safety-related alarm, investigate the whole equipment's documented intended use and local requirements. A process analyzer result and a room monitor reading should not be swapped into an alarm function merely because they both report CO₂.
A Practical Selection Workflow
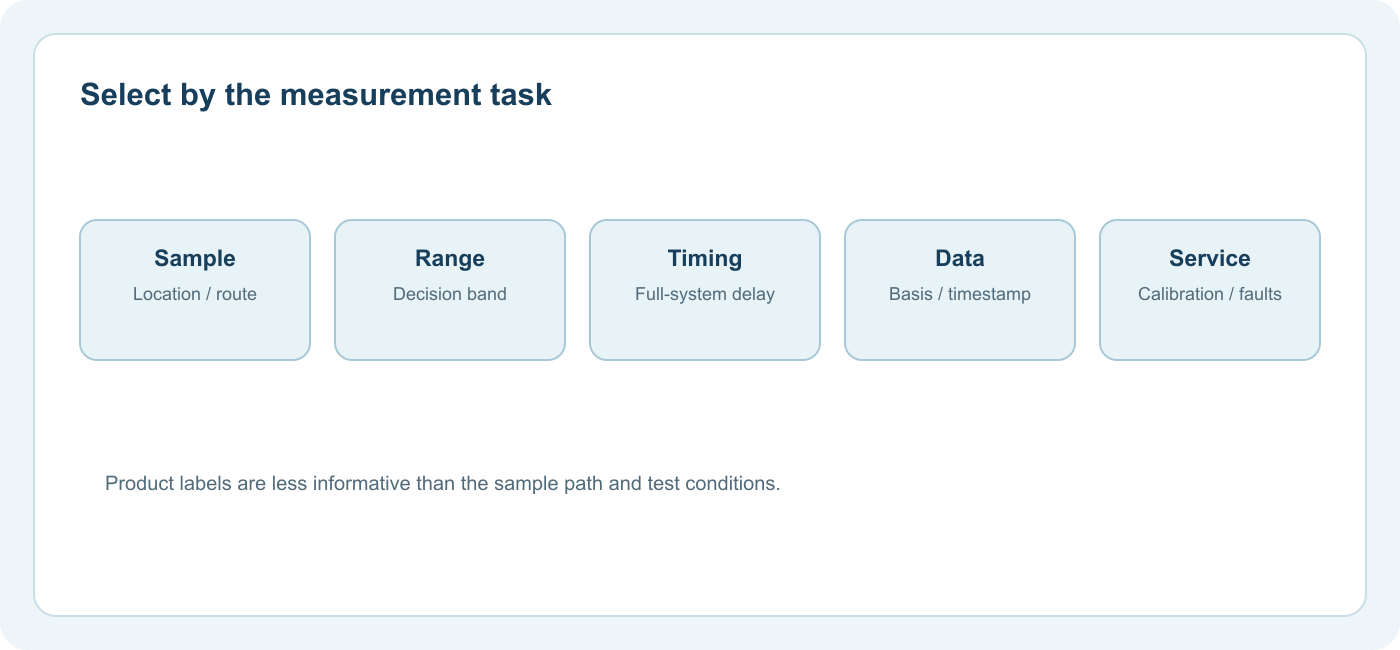
1. Identify the sample. Draw the measurement location and gas route. For a room, include representative placement. For a process, include tap, tubing, filters and exhaust or return.
2. Define the concentration profile. State normal, transition and maximum expected concentrations; identify the decision band. Compare that band with the manufacturer's specified accuracy interval.
3. Define the timing. Decide whether a live indication, periodic trend or event-resolved record is needed. Compare full-system response and output interval, not only sensor electronics speed.
4. Specify the data record. Identify units and gas basis, timestamps, status flags, averaging and any required data export. An analog signal may need another device to preserve these items.
5. Check environmental and service conditions. Pressure, temperature, moisture, contamination, calibration access and maintenance may determine the appropriate configuration.
6. Review the finished instrument. Verify model, manual, sampling configuration, intended use and stated test conditions. The word on the product label is less important than this evidence.
Consider a greenhouse and an adjacent work area. An instrument reporting the greenhouse's enriched growing atmosphere may be suitable for control at that sample point. A separate room monitor can answer a question about occupied air elsewhere. Combining those tasks into one number would erase the sampling boundary even if the hardware used similar NDIR optics.
Common Selection Errors
“An analyzer is always the right upgrade.” Only if its sample path and documented performance fit the decision. A more complex instrument can still sample the wrong place.
“The monitor and analyzer have the same sensor, so the readings are equivalent.” Their inlet, conditioning, pressure, averaging and calibration can differ.
“A room display tells us what is in the process line.” It measures surrounding air. The line needs its own defined sample.
“A tube-fed analyzer reads the inlet instantly.” Tube transport and mixing can delay or alter the gas reaching the cell.
“A long data log is automatically high-quality evidence.” It needs location, units, timing, validity and calibration context.
Perguntas frequentes
Can a monitor be used as an analyzer? Some products support defined sampling and documented performance for such use; many ordinary room monitors do not. Judge the exact configuration and sample route.
Can an analyzer monitor a room? It can measure a room-air sample if installed and configured for that purpose, but cost and complexity do not solve poor placement or interpretation.
Is a pump always required for an analyzer? No. Some analyzers or probes use diffusion or externally supplied flow. The sample introduction method must be documented.
What is the key first question when comparing products? Which gas reaches the measurement cell, and is that the gas the decision is about?
Should I compare ppm values from two devices directly? Only after checking gas basis, sampling point, timestamp, averaging, range and environmental conditions. Two numbers with the same unit may describe different samples.
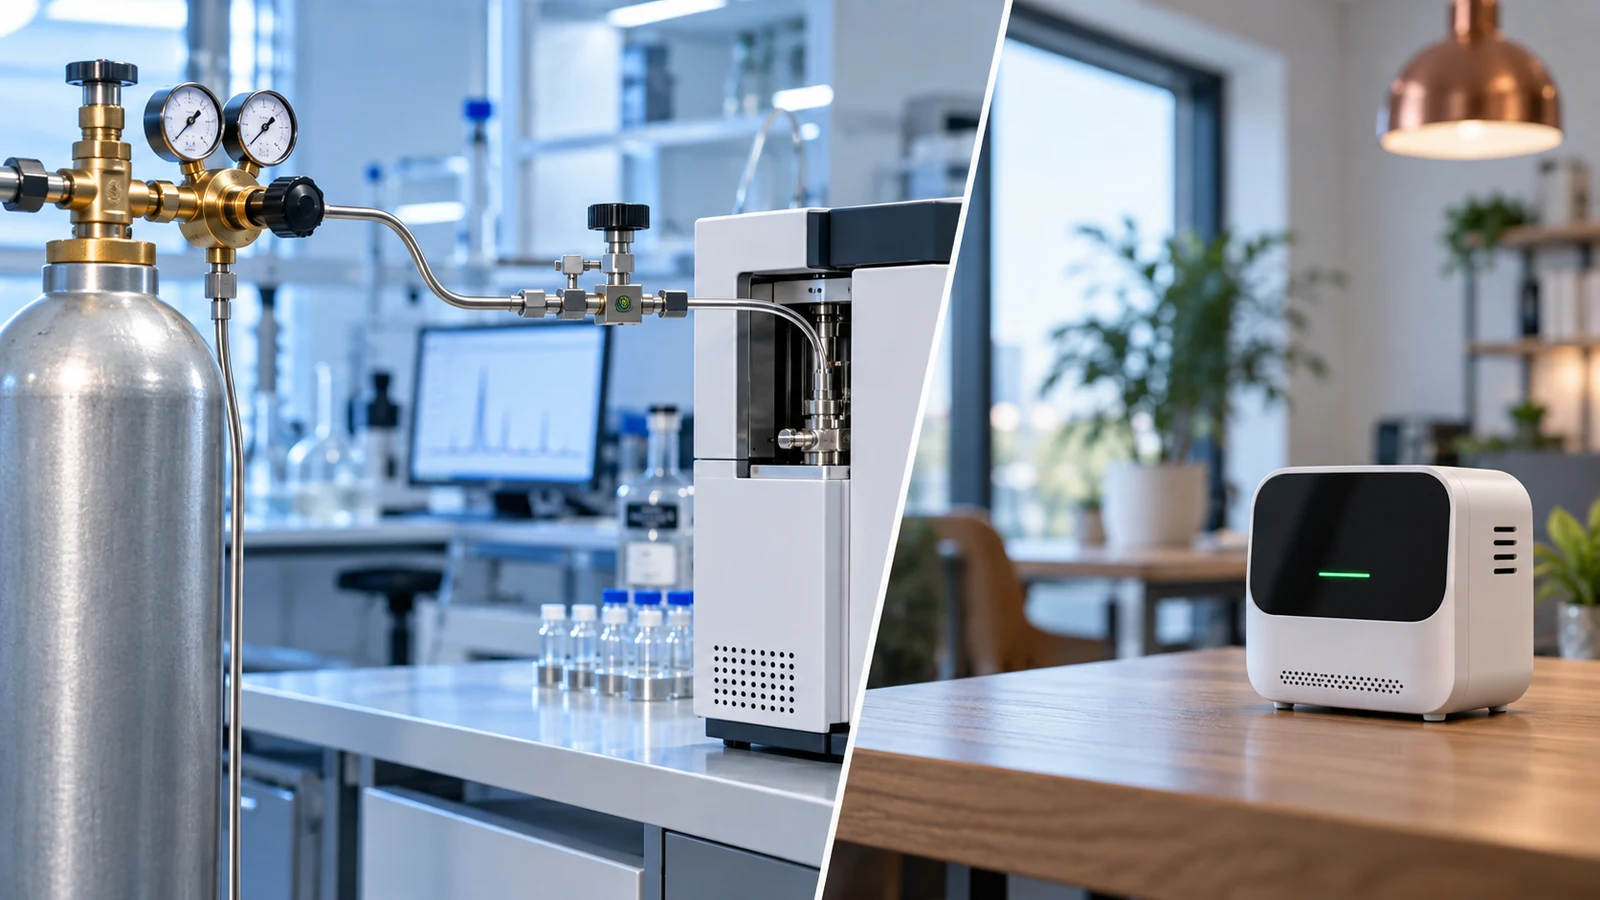
Pureza de CO2 versus concentração de CO2 ambiente: dois trabalhos de medição diferentes
A pureza do fornecimento de CO2 e o ppm de CO2 ambiente descrevem diferentes amostras e analitos. Saiba por que os monitores de ambiente não podem certificar lotes de gás e os certificados de pureza não podem descrever o ar ambiente.
consulte Mais informação
Índice de qualidade do ar versus concentração de gás: o que um monitor interno pode realmente dizer
Uma concentração de poluente é uma medida nomeada; uma pontuação de qualidade do ar é um mapeamento. Compare as pontuações internas com o AQI externo oficial dos EUA e inspecione os canais brutos de um monitor.
consulte Mais informação
Sensores CO vs CO2: Por que um instrumento de gás duplo precisa de dois canais de medição
Os sensores de CO e CO2 medem gases diferentes. Aprenda como verificar cada canal, seu princípio de detecção, alcance, calibração, caminho de amostragem e finalidade do dispositivo final.
consulte Mais informação
Leituras de CO2 úmido versus seco: por que a base da amostra altera o número
O CO2 ppm do ar úmido e do ar seco pode diferir porque o vapor de água altera o denominador da fração. Aprenda a conversão condicional e o que registrar em um sistema de gás amostrado.
consulte Mais informação
Faixa do sensor de CO2: escolha de medição em ppm ou porcentagem
Escolha uma faixa de medição de CO2 em torno das concentrações e decisões que importam. Compare unidades ppm e percentuais, intervalos de precisão, comportamento acima da faixa e condições de amostragem.
consulte Mais informação
Módulo Sensor de CO2 vs Monitor Completo: O que cada especificação prova
Um módulo sensor de CO2 e um monitor completo resolvem diferentes tarefas de engenharia. Compare gabinete, amostragem, potência, dados, calibração, alarmes e evidências de dispositivos acabados.
consulte Mais informação
Comentário (1)
[…] Our CO₂ measurement overview sets out the complete sample-to-output chain. For the distinction between module claims and finished equipment, read CO₂ sensor modules versus complete monitors. To compare different sampling and data tasks, read CO₂ monitors versus gas analyzers. […]