
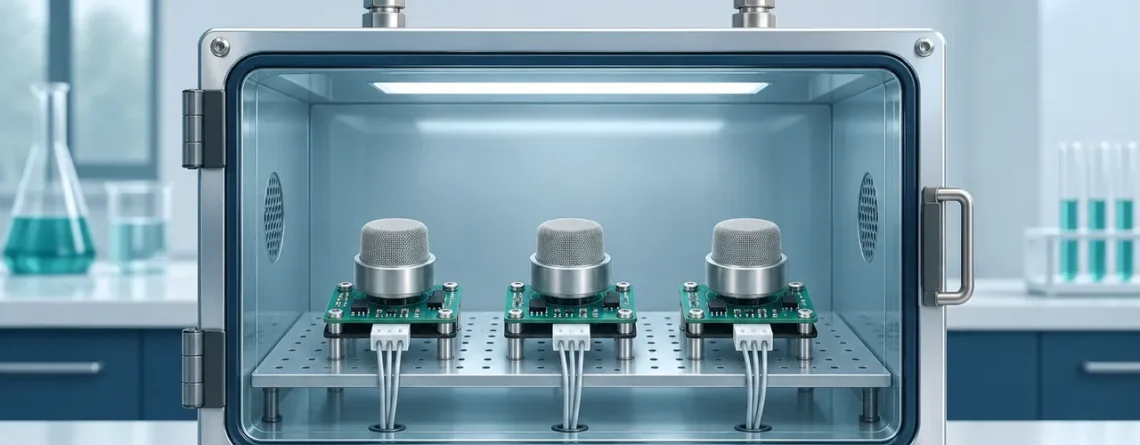
Repeatability describes how closely a gas sensor's readings agree when the measurement is repeated under defined, substantially unchanged conditions. Long-term drift concerns a change in its response over time that is not explained by a change in the measured gas. A tightly clustered set of readings today cannot establish that the same instrument will retain its reference agreement next month.
Test the two questions separately. Use a stable short observation window to characterize local scatter, then repeat reference comparisons over time with enough control of gas, environment, settings and reference stability to interpret a change. Track the mean deviation and within-check spread as separate results. A stable room concentration is not a substitute for a stable measurement reference.
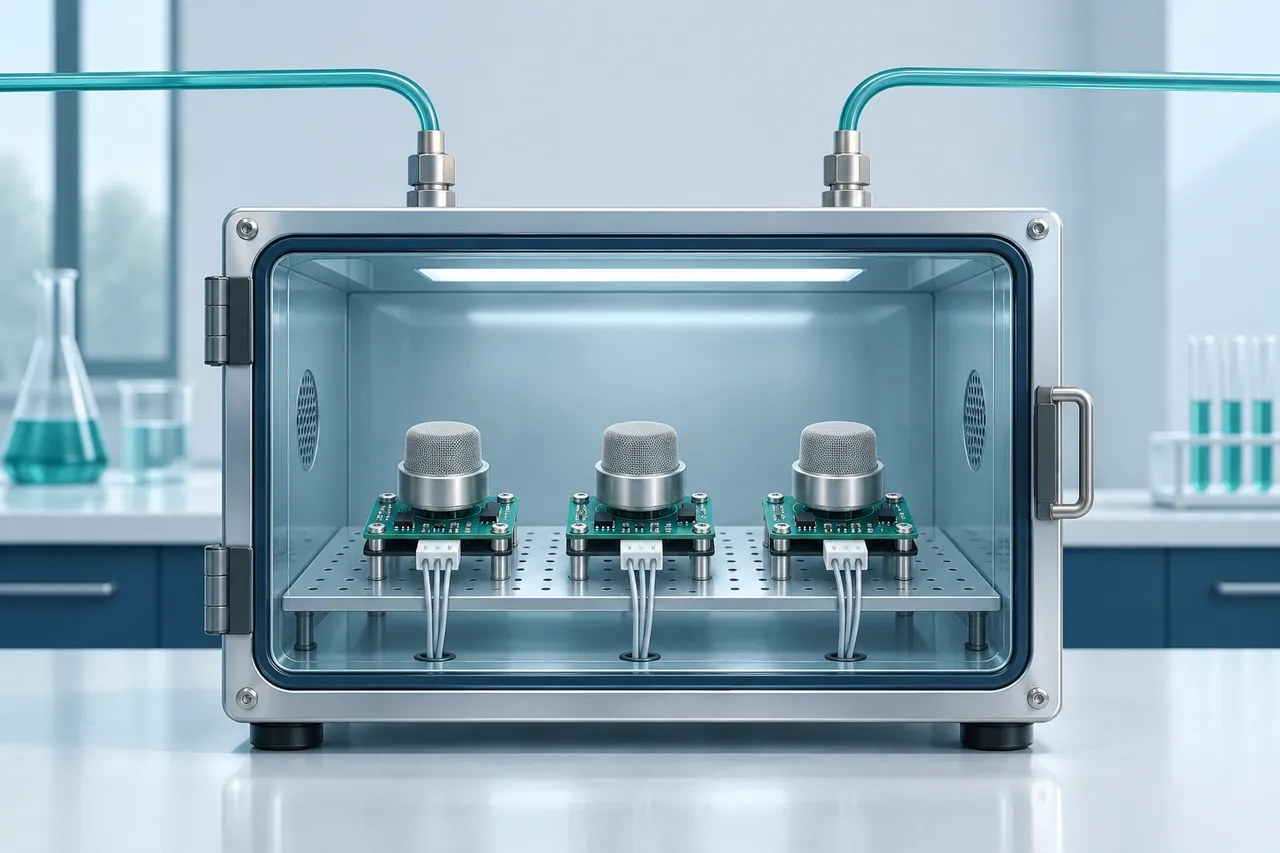
Conceptual comparison equipment. The numerical records in this article are constructed examples, not reported laboratory results.
Decide what you want the evidence to show
A repeatability check asks whether repeated observations agree over a defined period and arrangement. Its conditions should identify the instrument, gas point, measurement method, operator or automated sequence, environmental state and observation interval. If these change, the result may characterize a broader form of variability rather than the short-term repeatability you intended.
A drift study asks whether the indication-to-reference relationship has changed between checks. The instrument can remain very repeatable at each check while its mean response shifts. Conversely, the mean can stay approximately constant while the readings become noisier. Those patterns lead to different investigations and should not be collapsed into one “stability” score.
Các International Vocabulary of Metrology distinguishes precision under specified conditions from instrumental changes over time. For a gas-monitoring record, translate that distinction into two practical columns: spread within each check and signed deviation of that check from its reference. Keep the elapsed time and actual conditions with both.
| Câu hỏi | Useful observation | Inadequate substitute |
|---|---|---|
| Are readings locally consistent? | Repeated values at one stable point | One averaged display value |
| Has reference agreement changed? | Comparable as-found checks over time | A rising room concentration |
| Has sensitivity changed? | Changes in deviation at multiple points | An offset at one point alone |
| Did an adjustment help? | As-found and as-left comparison | Post-adjustment values only |
| Is the reference stable? | Traceability, cross-checks and history | Assuming every reference is exact |
The table is an evidence plan, not a universal test standard. Actual verification intervals, exposure methods and limits depend on the product and application. For a safety instrument, its approved instructions and applicable requirements remain controlling; an engineering trend record does not replace required checks.
Characterize short-term scatter with an explicit metric
Choose a stabilized gas point and retain the raw sequence. Record the duration, sampling interval, filter settings and any data-ready or validity state. A statistic without these details can be misleading: sixty one-second records from a heavily filtered instrument may contain much less independent information than their count suggests.
Mean, range, standard deviation and RMS error describe different things. The mean locates the center; the range uses only the extremes; standard deviation describes spread around the mean; RMS error relative to a specified reference also includes a persistent difference from that reference. A manufacturer's repeatability definition may use one of these with particular conditions. Compare like metrics rather than matching the word alone.
Các Bảng dữ liệu Sensirion SCD30, May 2020, gives separate accuracy, repeatability and lifetime-drift entries with footnotes. It defines its repeatability metric and qualifies the lifetime claim by field-calibration conditions. This is a model-specific example of why a short-term number must not be read as an unconditional long-term promise.
Worked example: small scatter, changed center
At an assumed reference concentration of 1,000 ppm, five day-zero readings are 998, 1,000, 1,002, 999 and 1,001 ppm. Their mean is 1,000 ppm; range is 4 ppm; sample standard deviation is approximately 1.58 ppm. The squared deviations sum to 10 ppm², and division by four gives a variance of 2.5 ppm².
At a later comparable check, the readings are 1,028, 1,030, 1,032, 1,029 and 1,031 ppm. The mean is 1,030 ppm, with the same range and sample standard deviation. Short-term scatter has not increased in this example, but the mean comparison deviation has changed from zero to +30 ppm. Good local consistency and a changed reference relationship coexist.
This conclusion assumes the reference value and delivered gas are comparable at both checks. If the later reference was actually 1,030 ppm, the sensor's relationship may be unchanged. If pressure or calibration settings changed, the shift needs to be attributed accordingly. The arithmetic is straightforward; the difficult work is preserving the basis for interpreting it.
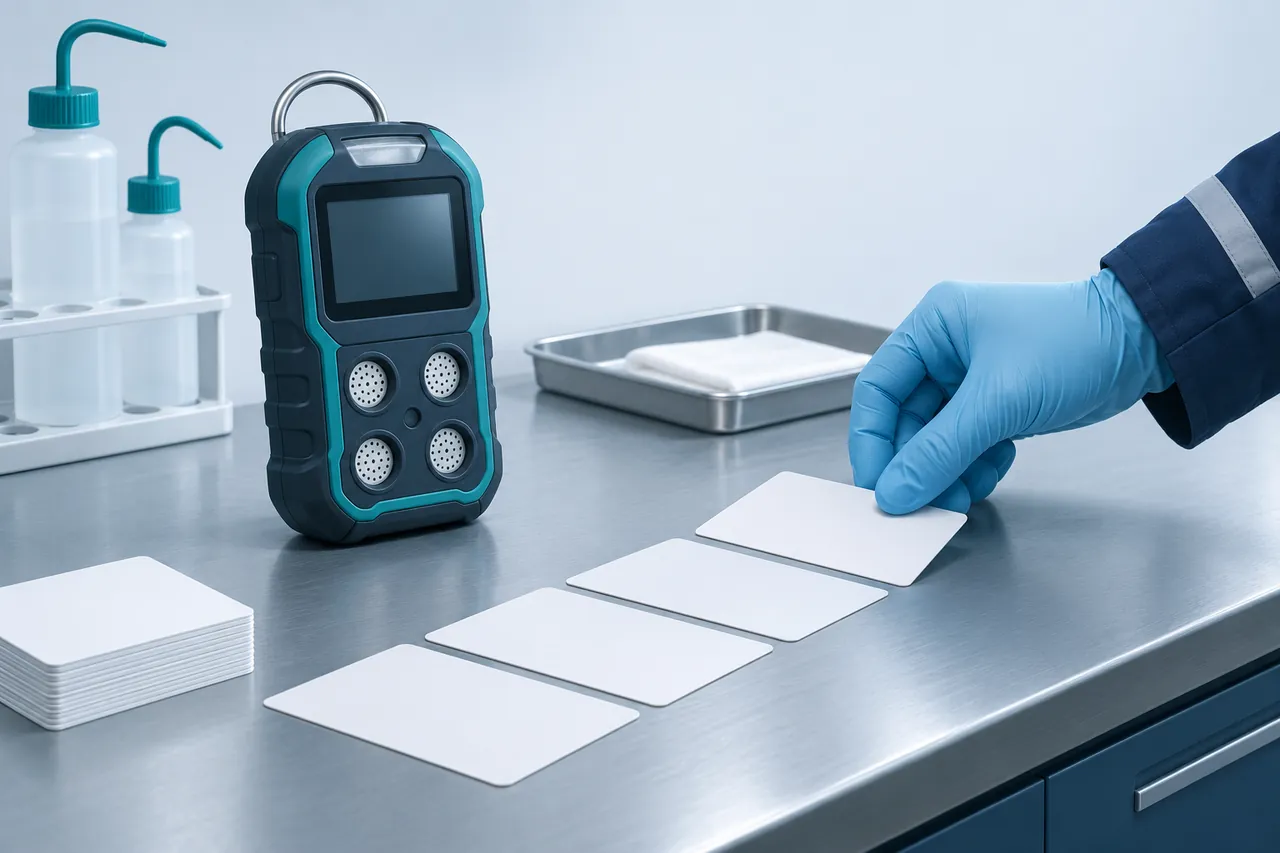
Short sequences help characterize local variation. Record their conditions and retain the observations instead of keeping only a smooth average.
Do not create false independence by logging faster
If a sensor produces one new measurement every several seconds but software polls it more frequently, successive records may repeat the same measurement. Even genuinely updated values can share a long filter history. State the actual measurement cadence and filtering before using sample count in an uncertainty calculation.
Gas delivery also has a time scale. Tubing exchange, chamber mixing and the instrument response can all create correlated changes. A trend during equilibration is not the same phenomenon as random scatter at a plateau. Separate the stabilization segment from the chosen analysis interval and retain both in the record.
When a short record slopes steadily, calculate or inspect that trend before summarizing everything as a standard deviation. Warm-up or changing exposure can broaden the distribution without demonstrating poor steady-state repeatability. The appropriate response is to establish a suitable stable condition, not to remove inconvenient readings without an explanation.
Build a reference chain that survives a long study
Long-term comparisons depend on the reference as much as the device under test. Record reference instrument identity, calibration status and uncertainty, or the certified gas identity, concentration basis, balance gas and validity. Retain enough information to recognize when a replacement cylinder or reference adjustment changes the comparison basis.
For each check, calculate the device-minus-reference difference rather than comparing device readings alone. If a certified gas value changes from one cylinder to another, use the appropriate assigned value for each check. The relevant question is whether the device's deviation changes, not whether it repeats the exact same displayed concentration despite a changed input.
An independent cross-check helps identify reference changes. If many devices shift together immediately after a reference service or cylinder replacement, investigate the common comparison chain. This pattern is a clue, not proof: a common firmware update or environmental change could also affect all devices. Preserve dates and event records so that alternative explanations remain testable.
Các NIST discussion of drift describes repeated checks and control-chart approaches for detecting changes in instrument response. Its examples are general metrology guidance. Applying the idea to gas sensors requires a suitable gas-delivery and reference method; it does not prescribe a universal gas concentration or calendar interval.
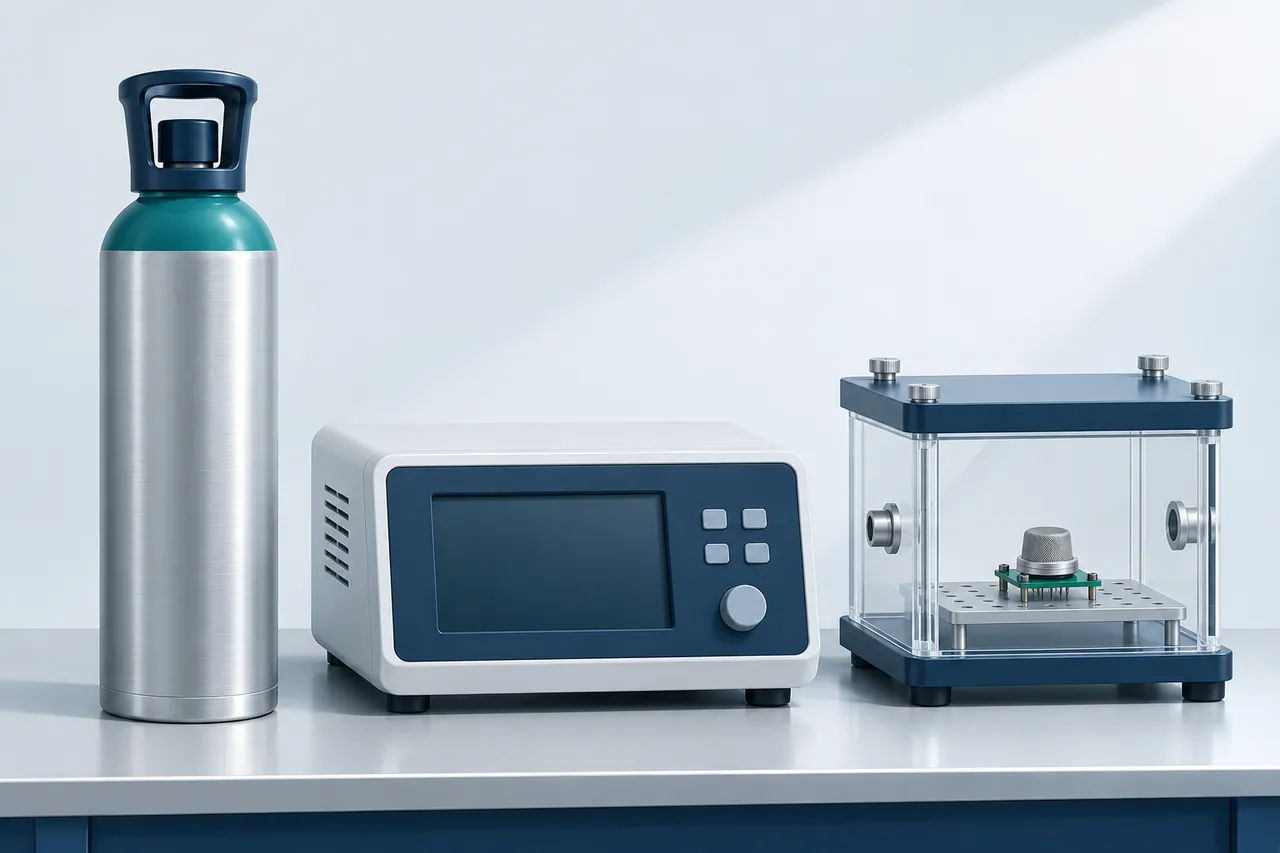
Reference identity, gas basis and delivery conditions must remain traceable across checks. This illustration is not a connection or operating procedure.
Track both offset and sensitivity where needed
A single check point cannot distinguish every change in calibration shape. An offset-like change produces a similar absolute deviation at different concentrations. A sensitivity-like change produces a deviation that grows with the input. Multiple suitable points help separate these patterns, while recognizing that a real response may contain both and may not be linear.
Consider two hypothetical reference points, 500 and 2,000 ppm. Initially, the deviations are +5 and +5 ppm. Later, they are +25 and +25 ppm. The changed deviation is +20 ppm at both points, an offset-like pattern. It suggests an investigation but does not prove the physical mechanism or justify a particular adjustment.
In a second constructed case, deviations change from zero at both points to +10 ppm at 500 and +40 ppm at 2,000. Both later deviations equal 2% of the reference value, a sensitivity-like pattern. A single 500 ppm check would reveal only the 10 ppm difference and could miss its significance at higher concentrations.
Do not assume two points establish a complete linear model. A third or additional point can reveal nonlinearity or a local issue. The manufacturer's method and application range determine the appropriate design. Retain individual deviations rather than compressing all points into one average error that might cancel positive and negative contributions.
Separate environmental response from time-dependent change
A gas sensor can show a changing indication because the gas changed, because conditions changed, or because its measurement relationship changed. Time alone does not identify which happened. An office record that rises during occupancy does not demonstrate drift. Neither does a comparison made cold on one date and warm on another without accounting for the difference.
Record gas-cell or relevant ambient temperature, absolute pressure, humidity and the compensation inputs actually used. A pressure value in a dashboard may be measured elsewhere or corrected to sea level. If it is not the input used by the gas sensor, it cannot explain the compensation state by itself. Configuration records are as important as environmental observations.
Các SCD30 design-in guidance describes thermal coupling, enclosure exchange and airflow concerns. A changed enclosure fan, nearby heat source or obstructed opening can therefore change the comparison arrangement. Documenting those events prevents an installation change from being labelled automatically as intrinsic sensor aging.
Where practical, repeat checks under a comparable reference condition. If the application requires several environments, treat them as separate documented test conditions. A comparison of the same device at two temperatures is useful environmental evidence, but it should not be inserted into a time-series drift record as if only elapsed time changed.
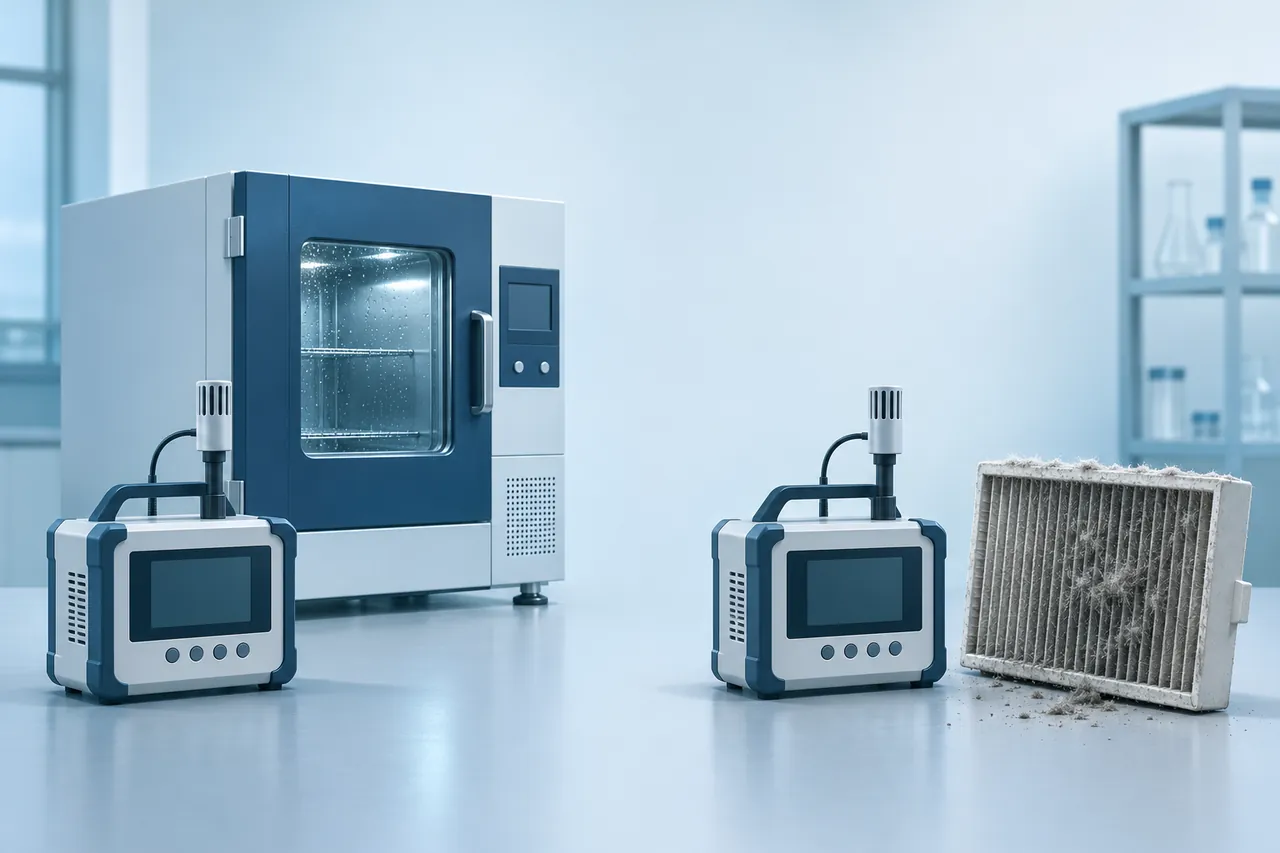
Environmental effects and physical changes can produce similar-looking indications. The investigation needs evidence about both.
Use reversible checks to test a suspected condition
If a difference appears after a temperature change, return to the original stable condition when the product and method permit it. Recovery toward the original comparison relationship supports a reversible environmental explanation. A persistent difference after recovery warrants further investigation. Neither result alone identifies the internal cause.
Similarly, compare the configured pressure value with an appropriate pressure reference before adjusting gas calibration. Correcting an erroneous environmental input may resolve the comparison difference without changing the calibration relationship. Preserve the original setting and as-found readings so that the effect of the correction remains reviewable.
Avoid changing several factors at once. Replacing a filter, updating firmware, changing calibration and relocating the device may improve the final result while making causation impossible to determine. If multiple repairs are necessary, record their sequence and intermediate checks where practical. The maintenance objective and the diagnostic objective should both be explicit.
Keep calibration events visible in the time series
Automatic baseline correction, forced recalibration and manual adjustment can alter the reported relationship. They are not neutral background events in a drift study. Record when they are enabled, their applicable assumptions, any detected recalibration events and the settings used throughout the study.
Automatic baseline methods are model-specific. A condition required by one module should not be transferred to another. A continuously occupied space, an enriched growing environment or a process mixture may not provide the baseline exposure an algorithm assumes. Use the exact manufacturer's documentation to decide whether the method fits the installation.
A post-adjustment record begins a new state of the instrument. Preserve the as-found deviation before adjustment and the as-left deviation afterward. Otherwise, a long record of good post-adjustment results can conceal substantial changes occurring between service visits. The history should allow a reviewer to see what the device did before maintenance intervened.
| Trường ghi | Mục đích | Example of an interpretable entry |
|---|---|---|
| Device identity and firmware | Maintain continuity | Serial identity and software revision |
| Reference identity and basis | Preserve comparison traceability | Certificate or analyzer record |
| As-found mean deviation | Observe change before intervention | Signed ppm at each point |
| Within-check spread and metric | Separate local variability | Standard deviation with sample interval |
| Environment and active compensation | Recognize changed conditions | Measured pressure plus value used |
| Adjustment and service events | Explain discontinuities | Date, action and as-left result |
| Decision and next check | Connect evidence to use | Rule applied and justified interval |
An incomplete historical record may support only a limited conclusion. State that a difference was observed between checks and identify the uncontrolled factors. It is better to preserve a useful but qualified observation than to claim a sensor aging rate from comparisons whose conditions are unknown.
Turn history into a maintenance decision
Plot or tabulate mean deviations by check date and gas point, with service events marked separately. Track within-check variability alongside that history. The first reveals changed reference agreement; the second can reveal an increasingly unstable signal even when average deviation stays small. Review individual points before fitting a trend.
Do not automatically extrapolate a straight line for years from a few checks. The direction and rate of change can vary, and a step caused by an event is different from a gradual progression. A trend line is a descriptive model whose usefulness depends on the data and interval. Keep the underlying observations available.
Các NIST guidance on recalibration intervals does not prescribe one interval for all instruments. It identifies application requirements, inherent stability and environmental influences as relevant, and describes using measurement assurance records to refine intervals. Gas-monitor maintenance must also respect manufacturer instructions and any applicable external requirements.
For a non-safety monitoring application, a history with ample margin may support review of the interval under a documented program. A result approaching the application's limit, an unexplained step, increased variability or a significant service event can justify an earlier check. The reasoning should be tied to actual evidence, not a generic claim that a sensing technology never needs calibration.
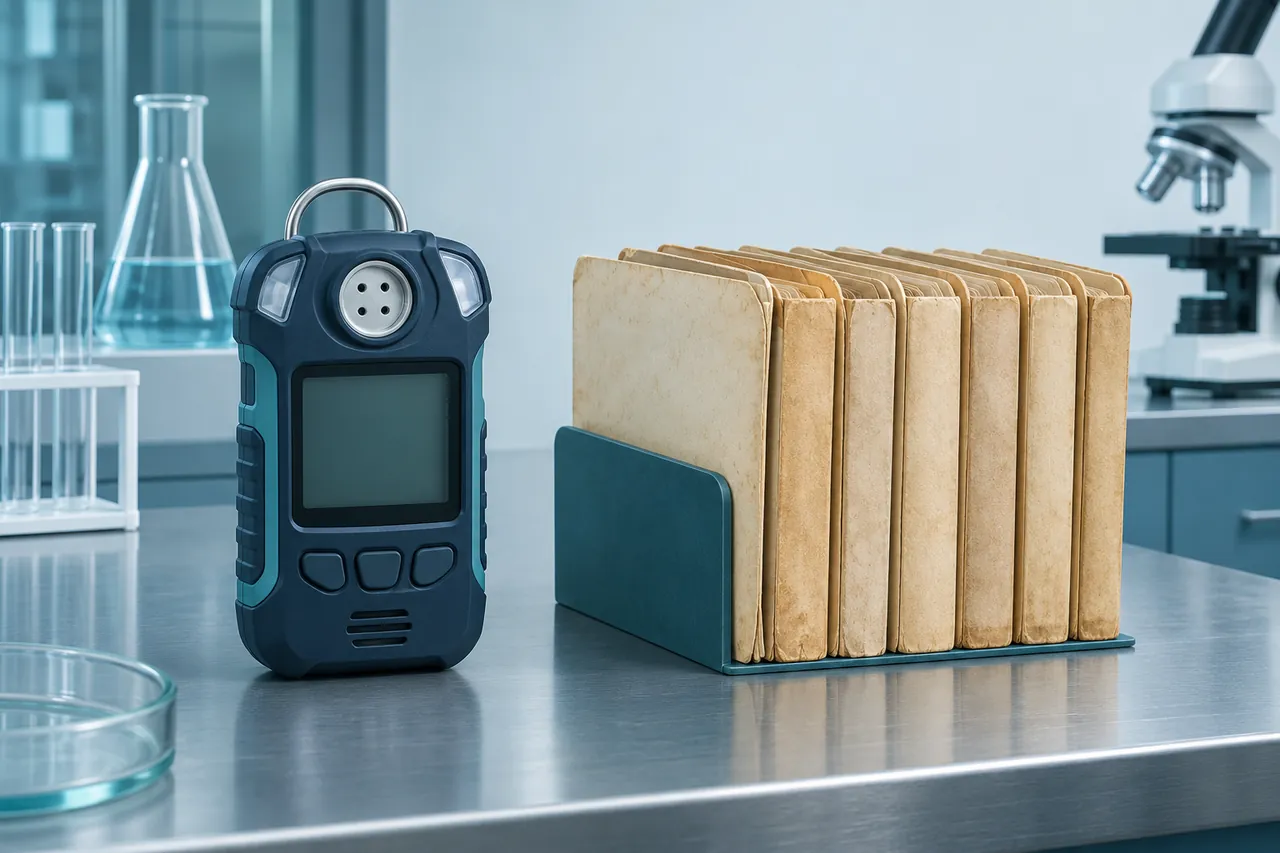
A long-term record is useful when it preserves comparable observations and identifies interventions, rather than merely accumulating dates.
A compact worked review
Imagine four comparable as-found checks at one reference point with deviations of +2, +8, +15 and +23 ppm. Within-check standard deviations remain near 2 ppm. This constructed history suggests a moving center with similar local scatter. It warrants reviewing environmental comparability, reference continuity and events before describing the pattern as instrument drift.
If the third check used a replacement reference with a documented +10 ppm change in assigned value, recompute each deviation against its correct reference value before fitting any trend. If the fourth followed an adjustment, it belongs to a different state. Correct bookkeeping can change the apparent pattern substantially without changing a single observed device reading.
Suppose the checks really are comparable and the application has a documented limit of 30 ppm at this point. The last deviation of +23 ppm is not automatically a comfortable pass: the decision rule and comparison uncertainty still matter. Nor should an assumed linear increase be used as the sole basis for predicting the next failure date. The evidence supports a maintenance review and a justified next check.
Design records that can distinguish a step from a trend
A long-term record should include events that can alter either the device or the comparison arrangement. Firmware changes, transport, storage, enclosure work, pressure-sensor replacement, reference service and gas-cylinder changes can all mark meaningful boundaries. Record the event even if no immediate problem is observed. A later reviewer may need it to explain a discontinuity.
Suppose monthly deviations are +3, +4, +5 and +26 ppm, with the last check immediately after a relocation. A fitted straight line would imply gradual deterioration, but the individual observations suggest a step near a documented event. Review the relocation and comparison conditions before fitting a rate. A statistical trend cannot supply missing physical context.
In another constructed history, the mean deviations remain +5, +6, +5 and +6 ppm, while within-check standard deviations increase from 2 to 3 to 7 to 12 ppm. An average-only chart would look reassuring. The spread record reveals that the measurement has become less locally consistent. Investigate noise, sampling, supply, contamination and status behavior rather than concluding that no change occurred.
Use consistent statistics and reporting intervals throughout the history. If the earlier records use ranges and later records use standard deviations, retain both definitions and avoid plotting them as if they were one metric. If the software filter changes, identify the change because it can alter observed scatter and response without representing a physical improvement in the sensing element.
Preserve exclusions and incomplete checks
Sometimes a reference check is invalid because of a documented gas-delivery fault, an unstable condition or missing status information. Keep the observation and the reason for exclusion. Deleting it entirely removes evidence of the comparison method's reliability and makes later reviews harder. An invalid check can still reveal a maintenance or procedural issue.
Define stabilization and exclusion rules before reviewing the result where practical. Selecting a quiet interval only after seeing the data can produce an artificially favorable repeatability estimate. A predefined interval or objective stability criterion is easier to defend. If the method must change, document why and retain the earlier data with its limitation.
Missing checks are also information. A six-month gap cannot establish what happened within it. A passing result at the end does not prove uninterrupted performance, especially if automatic corrections or undocumented service may have occurred. State the temporal coverage of the evidence and avoid filling gaps with an assumed straight line.
The same principle applies to replacement units. A new sensor can restore the application's performance, but it does not continue the old unit's drift trajectory. Mark the replacement and start an identifiable new record. Keeping application continuity and device identity separate allows both maintenance planning and technical analysis without mixing incompatible histories.
Make the next check answer a specific uncertainty
When the record is ambiguous, choose the next comparison to separate plausible explanations. If only one point has changed, a second suitable concentration can help distinguish an offset-like pattern from a sensitivity-like one. If all devices moved together, an independent review of the reference chain may be more informative than recalibrating every unit immediately.
If the short sequence contains a steady slope, extend or repeat the stabilized observation under the approved method instead of simply collecting more points during the same transient. If the environment changed, recover the original condition where practical and compare again. Each follow-up should change as little as necessary to answer the chosen question.
Write the expected discriminating observation in advance. For example: “If the pressure input mismatch explains the difference, correcting that input should change the comparison result in the predicted direction without a gas-calibration adjustment.” The actual result can support or challenge that explanation. It does not prove every other part of the measurement chain is correct.
This approach makes the history useful for decisions as well as archiving. A record of unresolved differences should identify the next evidence needed, while a completed investigation should state the supported conclusion and its scope. Preserve uncertainty where the data cannot distinguish alternatives. An honest boundary is more useful than an unsupported aging coefficient.
Câu hỏi thường gặp
Can excellent repeatability coexist with poor accuracy?
Yes. A sensor can produce closely clustered values centered away from a suitable reference. Repeatability describes consistency under the repeated conditions, while the mean comparison deviation identifies the difference from that reference. The constructed +30 ppm example illustrates this separation without implying a particular product's performance.
Is every slow change in a logged concentration drift?
No. Gas concentration, sampling, temperature, humidity, pressure and configuration can all change slowly. To identify a changed instrument relationship, compare against an appropriate reference under documented conditions. A time series of unknown ambient gas alone cannot separate a real concentration trend from a measurement change.
Can I estimate drift by comparing two ordinary monitors?
You can observe a changing difference, but either monitor or their exposure may be responsible. A stable, suitable reference or an independently supported comparison chain is needed to attribute the change. Several devices moving together can reveal a common influence, but does not by itself identify which value is correct.
Does automatic calibration eliminate the need for records?
No. Its operation and assumptions become part of the record. Automatic correction may maintain performance when its conditions are met, but can also obscure an unrecorded change in the underlying relationship. Record the enabled mode and relevant events, and use the manufacturer's specified method to verify the complete instrument.
Which statistic should I use for repeatability?
Use the metric defined by the applicable specification or test method. For your own characterization, label the statistic explicitly and retain the sampling and filter conditions. Range, sample standard deviation and RMS error are not interchangeable. A small sample is useful preliminary evidence but does not establish a lifetime population claim.
How often should I check long-term performance?
Follow the product instructions and any applicable requirements, then use a documented measurement assurance history to inform the interval where discretion exists. Application tolerance, environment, instrument history and consequences of a missed change matter. This article does not assign one universal calendar interval across gas technologies or uses.
Should I erase old results after replacing a sensor?
Retain them, but identify the replacement as a new device state or identity. The history can explain why service was needed and how the new system compares. Combining pre- and post-replacement data without a clear boundary would create a misleading drift series. Preserve both continuity of the application and identity of the measurement device.
Sources and further reading
- JCGM 200:2012, International Vocabulary of Metrology: precision and instrument behavior terminology.
- Sensirion SCD30 datasheet, May 2020: separate repeatability and conditional lifetime-drift entries.
- Sensirion SCD30 design-in guidelines: integration factors that can change a comparison.
- NIST/SEMATECH handbook: Drift: reference-check and time-series principles.
- NIST: Recommended calibration interval: evidence-based interval review.
- Reading a CO2 monitor accuracy specification: keeping a stated allowance distinct from observed comparison results.






Để lại một câu trả lời