
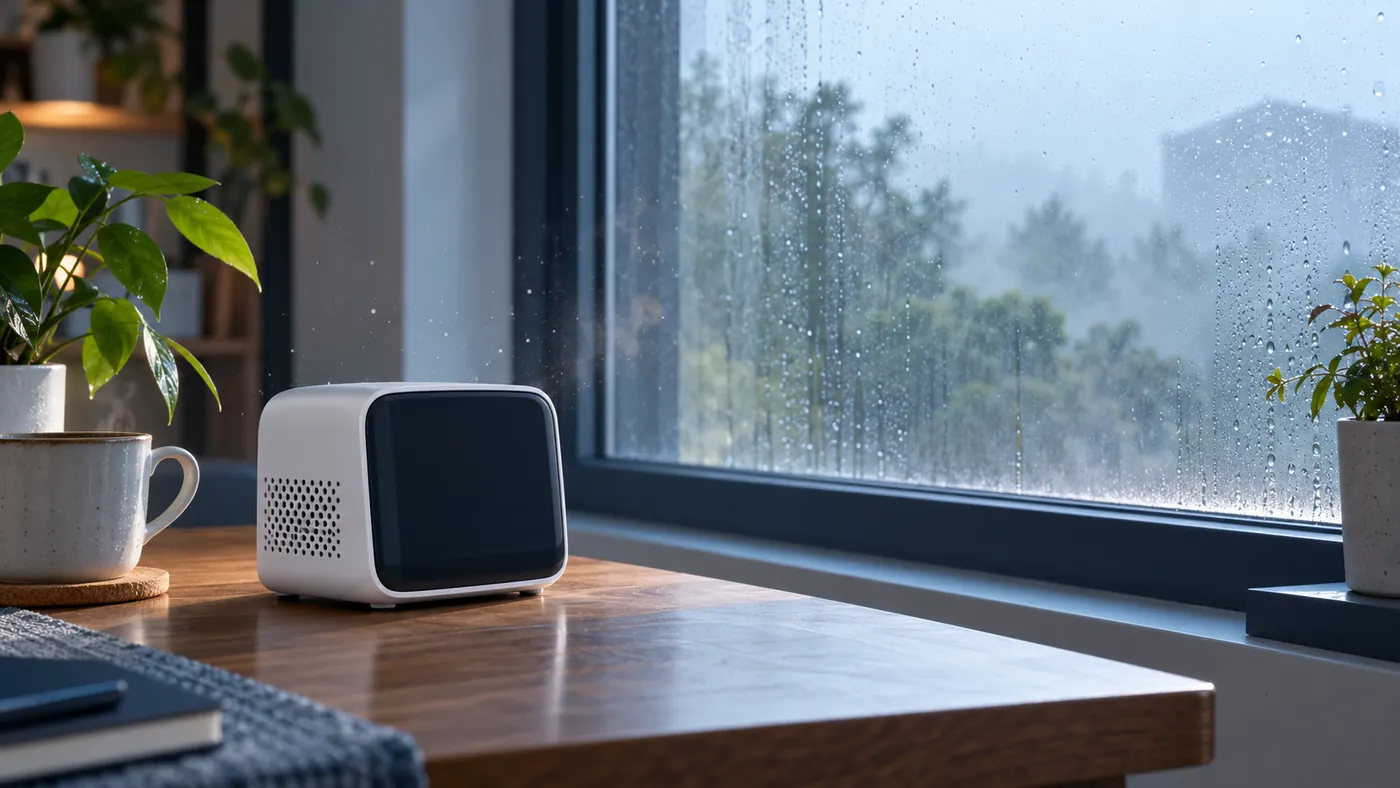
Humidity can raise an optical PM₂.₅ reading without the same increase in dry particle mass, but it can also accompany a real particle event. Some airborne particles absorb water and grow, fog or steam droplets may enter the sensor, and condensation can disturb the optical chamber or sample path. Each mechanism changes what reaches the light beam or how it scatters light. A simultaneous rise in relative humidity and displayed PM₂.₅ is therefore a reason to investigate, not a reason to delete the data or subtract a fixed percentage. Identify the environment and device, log the event, and compare with an appropriate reference when the decision matters.
The distinction matters in homes, public rooms and outdoor monitoring networks. A monitor may report mass concentration in µg/m³, but an inexpensive optical instrument usually estimates mass from scattering and an assumed relationship between particle size, number, density and optical properties; it does not weigh collected particles. The US EPA's guide to low-cost indoor monitors stresses that such outputs have limitations and should be interpreted for their intended question. The EPA air-sensor performance evaluation likewise separates sensor performance from simply having a digital number on a display.
What the optical sensor actually measures
Air enters an inlet and passes through an illuminated sensing volume. Particles scatter light toward a photodetector. Electronics process the scattering pulses or signal to estimate particle size and number, then software derives outputs such as PM₁, PM₂.₅ and PM₁₀ mass concentration. The exact optical geometry and algorithm vary by model. Some components also provide number concentration in specified size channels. The Sensirion SPS30 datasheet illustrates the difference between its reported mass concentration in µg/m³ and number concentration in particles/cm³. These are distinct quantities, even when derived from the same optical signal.
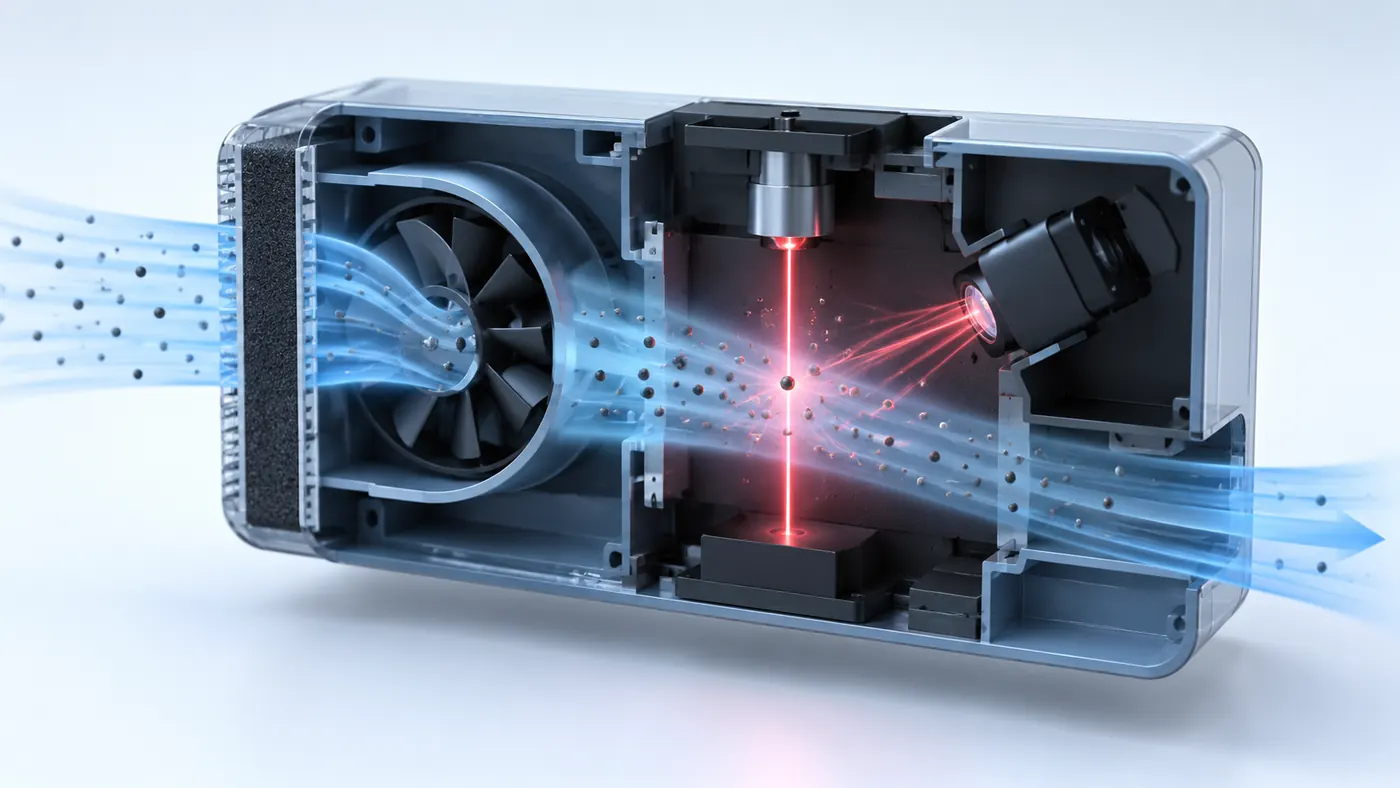
Scattering depends on more than dry mass. Particle diameter, shape, refractive index and composition affect the amount and direction of light. A small dry particle and a larger water-coated particle made from the same dry material can have different optical signals. The conversion algorithm is tuned for a chosen particle model and test conditions. If the actual aerosol differs—for example, combustion smoke, dust, sea salt or water droplets—the estimate may have a different bias. The sensor's displayed precision, such as a decimal place, does not tell you its uncertainty for every aerosol type.
The inlet is part of the measurement. A monitor mounted beside a humidifier, shower door or kitchen source may sample a concentrated local plume. A second device several meters away can record a different time course. Airflow, fan condition, filters, dust on optics and the enclosure's ventilation all matter. Before interpreting a humid “spike,” identify which air mass the device sampled, whether the inlet was wet, and whether the device was operating inside the manufacturer's environmental limits.
Four mechanisms behind a humidity-linked rise
Humidity itself is water vapor, a gas. An optical PM sensor is intended to respond to particles or droplets, not to invisible vapor molecules directly. The humidity link usually enters through changes in the aerosol or sensor conditions. Keep the pathways separate:
| Pathway | Physical change | What the PM trace may show | Evidence that helps distinguish it |
|---|---|---|---|
| Hygroscopic growth | Existing aerosol takes up water and becomes optically larger | A gradual or reversible increase as RH changes | Composition and RH context, dry/reference comparison, repeated similar conditions |
| Fog, mist or steam droplets | Liquid droplets reach the sensing volume | A rapid rise near a humidifier, shower, fog bank or cooling plume | Visible moisture source, inlet position, event timing and dew/fog observation |
| Condensation or wet contamination | Water accumulates on inlet or optics, disturbing sampling and scattering | Erratic, delayed or persistent abnormal output | Device inspection and self-check according to maker instructions, recovery after drying/service |
| True concurrent particle emission | A real source releases or draws in particles while humidity changes | A legitimate particle increase, perhaps mixed with water effects | Source/ventilation log and suitable independent measurement |
These mechanisms can coexist. Cooking may release both water vapor and fine particles. Opening a window on a humid, smoky day changes moisture and real particle exposure together. A humidifier can introduce liquid droplets and, depending on water quality and device design, other airborne material. A logger that records only RH and PM cannot by itself separate all pathways. Treat the table as an investigation map, not a formula to correct every reading.
Hygroscopic growth: the aerosol changes before it reaches the detector
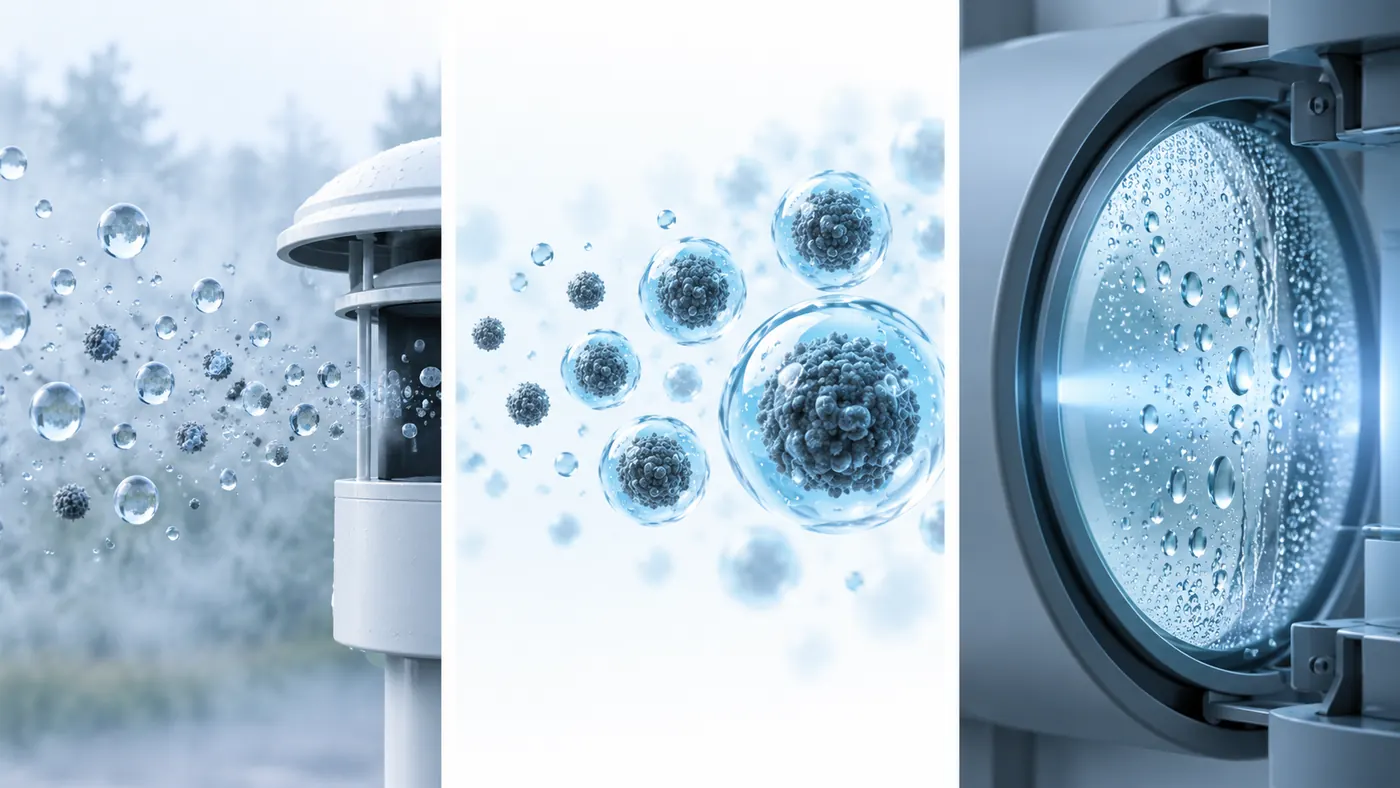
Some particles contain salts or other water-attracting material. As ambient RH increases, they take up water and their diameter and optical properties change. The dry material may remain nearly the same while scattering increases. The displayed PM₂.₅ estimate can then rise even if a gravimetric method that dries or conditions the sample would report a different dry mass. This does not make the optical observation imaginary: the particle in humid air really is different. It means that which mass or exposure question is intended must be stated.

Composition matters. A hydrophobic soot-rich aerosol and a salt-rich aerosol may behave differently at the same RH. There is no universal RH value at which every low-cost PM sensor suddenly becomes “wrong,” nor one fixed correction for all sites. A device may also have its own inlet design or firmware adjustment. A 2018 field study by Jayaratne and coauthors examined a particular optical PM sensor under high humidity and fog and found that the influence differed by conditions; the authors cautioned against treating fog with a simple RH correction. That study is evidence about its tested sensor and environment, not a correction coefficient to paste into an unrelated monitor.
Fog and droplets: the instrument may count liquid as particles
Fog consists of suspended liquid droplets. Steam can cool into droplets. If droplets enter an optical chamber, they scatter light and may be interpreted as particles within the device's size estimation scheme. Whether they are included or excluded depends on inlet, size range, flow and processing. A short high peak during a shower or fog passage need not represent an equal increase in dry combustion particles, but it is still a measurement event worth retaining with a quality flag. Deleting it without context hides the behavior of both the air and the instrument.
An indoor humidifier is a particularly useful example because the source is often close to the monitor. Move the monitor away from a direct plume according to the manufacturer's siting guidance, but do not move it mid-comparison and then claim the room improved. Log its position before and after. If the concern is actual inhaled aerosol produced by the device, the analysis should not automatically write off all of the signal as “humidity error.” The question may call for investigating the humidifier, its water and maintenance as well as the sensor.
Condensation: a device state problem
Condensation forms when a surface or air sample cools enough for water to deposit. A wet inlet can alter flow; droplets or films on optical surfaces can produce abnormal scattering or block light. The signal may not recover as soon as ambient RH falls, especially if contamination remains. This is different from reversible hygroscopic growth in airborne particles. Check the manufacturer's permitted humidity and non-condensing conditions, and follow its inspection and cleaning instructions. Do not heat, block or modify the inlet ad hoc to force a desired reading; that changes the sampled aerosol and may damage the device.
Real particle sources can occur at the same time
A humidity rise does not invalidate a PM₂.₅ rise. Cooking, combustion, cleaning, outdoor wildfire smoke or traffic infiltration can produce real particles while air moisture changes. A building system may turn on at the same time as a humidification or ventilation cycle. Compare timestamps and source observations, not merely the direction of two lines. For decisions such as filtration effectiveness, it is important to know the particle source, air exchange and sensor location. Our shared-space IAQ monitoring guide explains how to tie each channel to a room-use question.
What research says—and what it does not
Optical PM sensors can be useful, but their performance is conditional. The Jayaratne et al. field study evaluated a specific low-cost PM sensor in high-RH and fog conditions. Its observed artifacts demonstrate that liquid water and humidity can matter greatly, but the result is not a universal threshold for all instruments. The Barkjohn et al. 2021 multi-site study developed and evaluated a correction for PurpleAir outdoor PM₂.₅ data in a particular reference-comparison setting, including RH. Its method should not be transferred untested to an indoor monitor, a different sensor or a fog event.
The strongest lesson from both is methodological: document the instrument and aerosol context, compare against a suitable reference, evaluate performance across conditions, and report the limits of any correction. “Humidity affects PM sensors” is true but insufficient. A correction that reduces average bias across ordinary outdoor data may still fail for a new aerosol type or at a wet inlet. Similarly, a device that performs well in a manufacturer test at one temperature and aerosol challenge may not have the same uncertainty in a steamy bathroom.
For a finished product, check the whole monitor's validation, not only the particle module. Enclosure airflow, firmware, maintenance and installation affect performance. The SPS30 datasheet defines outputs and specified conditions for that component; it does not certify every enclosure that contains it. The EPA's emerging air-sensor evaluation resource gives a framework for performance claims and testing questions.
A practical investigation of a humid PM spike
Start by preserving the raw event and adding context. A time plot is helpful, but the minimum record is the PM channel and unit, RH and temperature, device/inlet location, observed fog or steam, activities, ventilation or window state, and whether the instrument was restarted or serviced. If possible, note the sensor's own status and whether its sample chamber could have been wet. A short event close to a humidifier suggests a different test than a multi-hour regional smoke episode.
- Confirm the channel and clock. Is it PM₂.₅ mass estimate, particle count or an air-quality score? Are the timestamps synchronized with the RH logger and activity record?
- Inspect the environment. Note fog, showers, cooking, humidifiers, cleaning, open windows and outdoor conditions. RH at a distant wall sensor may differ from RH at the particle inlet.
- Check the instrument state. Was it within its operating envelope? Is there evidence of condensation, inlet blockage, fan failure or maintenance need? Follow the maker's procedure.
- Look for a repeated pattern. Does the rise occur only with a particular source or site? Does it return after drying or persist? Does an independent monitor show a similar timing?
- Compare with the right reference. A co-located optical monitor may share the same humidity bias. For a consequential dry-mass conclusion, use an appropriate conditioned or reference method and qualified interpretation.
- Document the decision. Keep the event, mark uncertainty and state what was and was not resolved. Do not silently replace the series with a hand-adjusted line.
| Observed pattern | Plausible first hypotheses | Next useful check |
|---|---|---|
| Sharp rise during shower or humidifier use near the inlet | Droplets or local plume; possibly real aerosol | Move future sampling to a representative point, log source and inspect model limits |
| Gradual PM rise with widespread outdoor RH increase | Hygroscopic growth, changing aerosol source or both | Compare outdoor reference, aerosol context and repeated weather conditions |
| PM remains abnormal after RH falls | Wet/dirty optics, altered flow or ongoing particle source | Follow instrument diagnostics and maintenance; compare another suitable method |
| PM and RH rise during cooking | Real emission plus moisture and possible droplet effects | Log cooking method, distance, ventilation and recovery; do not assume all artifact |
| Two optical monitors disagree most on foggy days | Different inlet, optics, algorithms or device states | Co-locate under controlled conditions and compare against a suitable reference |
This is a triage table, not an automatic diagnosis. The absence of visible fog does not rule out water uptake by particles, and the presence of a humidifier does not prove every particle is liquid. When uncertain, preserve the competing explanations and design the next comparison to separate them.
Can a humidity correction fix the data?
Sometimes a model-specific, site-validated correction improves a defined output against a defined reference. That requires paired sensor and reference data spanning the relevant aerosol types, RH and temperature range, seasonal or activity variation, and wet events. Fit on one subset and test on data not used to fit the model. Report both raw and corrected outputs, the reference, the allowed conditions and the residual error. If the monitor already applies internal compensation, avoid blindly applying a second correction.

A generic “subtract 20% when RH is high” rule is unjustified because the contribution of water and the optical response vary. Even a well-fitted average correction can fail near fog or condensation, where the relationship changes abruptly. Excluding a subset can be reasonable for a precisely defined analysis, but retain the original readings and flag the exclusion criterion. If the purpose is detecting a real humidifier plume, a correction designed to estimate dry outdoor PM mass may erase the very event of interest.
For a new installation, first decide whether the intended quantity is ambient aerosol as experienced in humid air, a dry/reference PM₂.₅ mass concentration, a trend in a particular room, or a simple event alarm. Those objectives are related but not identical. The reference method and correction depend on the choice. A low-cost monitor can support a trend investigation while its absolute mass estimate remains uncertain. Do not claim a regulatory-grade value because software produced a more plausible curve.
What a correction study must keep separate
First distinguish calibration from validation. A fitted relationship between an optical monitor and a reference on the same days describes those days; it does not prove performance on future fog, smoke or indoor steam events. Hold back independent periods for testing, including high-humidity episodes if the intended application includes them. Report how many observations were excluded because of condensation, missing data or maintenance and why. A correction that looks excellent after removing every difficult episode may not solve the operational problem that prompted the study.
Second, record which outputs are already processed. Some modules report a raw or factory-calibrated particle estimate, while a finished platform may apply another humidity or network-level correction. A data export may contain both. Mixing them can lead to double correction or an apparent improvement that is merely a change of column. Label version, firmware and transformation applied to each series. If two sensors are compared, align time stamps and averaging intervals and check whether they actually sampled the same air. Correlation alone can be high when both follow the same daily cycle even if one is systematically biased.
Third, interpret errors by event type. A model may reduce average error on ordinary days yet perform badly at the start of a fog episode or near a humidifier plume. Look at residuals versus RH, temperature, aerosol source and time since wetting. A slow recovery after condensation may need a quality flag and maintenance, not an additive correction. In a building, compare occupied and unoccupied periods separately when activities change both PM and humidity. State the range in which the correction is supported; outside that range, retain the raw data and uncertainty rather than extrapolating a precise-looking answer.
PM₂.₅ is a size fraction, not a source label
PM₂.₅ refers to an operational particle-size fraction, commonly used to describe fine particulate matter. A displayed PM₂.₅ value does not tell you whether particles came from cooking, traffic, wildfire smoke, salt, dust or droplets. Optical devices infer the fraction through their own size response and conversion model. Hygroscopic growth can move particles across an optical size boundary as well as change scattering intensity. Thus a difference between PM₁ and PM₂.₅ channels during a humid event may reflect size estimation and water uptake, not necessarily the arrival of a new dry-particle source.
This distinction matters for health and filtration questions. If wildfire smoke is suspected, use the event context, outdoor information and relevant guidance, not an RH adjustment that was derived for routine urban aerosol. If evaluating an air purifier, note whether its filter targets particles, whether the room's source and mixing conditions stayed comparable, and whether the monitor is directly in the purifier jet. A device might remove dry particles while humidity increases the scattering of what remains; one channel's apparent stability would not negate the filtration. Conversely, a falling optical reading might follow drying air rather than removal. A defensible comparison describes both possibilities and gathers the data needed to separate them.
Placement, maintenance and comparison design
Choose a position representative of the question and within the device's specified conditions. Keep the inlet away from direct steam, water spray and exhaust jets unless that plume is deliberately the target. Provide the clearance and airflow the manufacturer requires. Record mounting height, nearby openings and moves. An instrument beside a bathroom door may be ideal for detecting bathroom-related events but poor for representing an entire apartment. Outdoor networks need weather protection that still admits a representative sample; an enclosure can change temperature, RH and airflow.
Maintain the instrument according to its manual. Dust buildup, insects, fan wear and wet optics can degrade performance. After a condensation event, a return to an apparently normal display does not itself prove calibration was restored. If a decision is consequential, perform a documented check or comparison. A second inexpensive optical sensor can reveal disagreement but may share the same environmental susceptibility. A conditioned reference measurement, where appropriate, asks a different question than a second identical monitor.
When comparing before and after an air-cleaner or ventilation change, match source activity, occupancy, outdoor conditions, device placement and operating state as closely as practicable. If RH also changed, say so. A lower reading after a change may reflect actual particle removal, less water uptake, a different source or a combination. The result is more useful when the uncertainty is explained than when one number is presented as absolute proof.
A small field record that preserves the evidence
| Cánh đồng | Example of what to write |
|---|---|
| Mục đích | Room trend, outdoor event, filtration check or dry-mass comparison |
| Dụng cụ | Full model, firmware, PM output, unit and inlet configuration |
| Site | Location, height, nearby moisture and particle sources |
| Conditions | Time series of RH/temperature, ventilation, weather and observed fog |
| Event | Start/end, source activity and any move or restart |
| Data quality | Wet/dirty inlet, fan warning, missing data, known algorithm correction |
| Comparison | Reference type, co-location period and results under comparable conditions |
| Interpretation | Supported conclusion, plausible alternatives and follow-up action |
This record turns a suspicious spike into a testable observation. It also prevents a later analyst from assuming that a gap, correction or sensor relocation was an environmental improvement. For multi-room programs, use a consistent record across locations and keep each room's use and inlet position visible. Our shared-space monitoring plan provides a broader framework for linking measurements to decisions.
Questions readers ask
Does humidity always make PM₂.₅ sensors read high?
No. The direction and size of error depend on aerosol composition, humidity, droplet presence, sensor design and algorithm. A concurrent real particle source can also change the reading. Investigate the event rather than applying a universal assumption.
At what RH does a PM sensor become inaccurate?
There is no single threshold for all optical PM sensors or aerosols. Use the model's operating conditions and performance data, distinguish ordinary high RH from fog or condensation, and validate the intended measurement against a suitable reference where accuracy matters.
Is steam from a shower “real PM₂.₅”?
Steam is water vapor; as it cools it can form liquid droplets that scatter light and may be counted by an optical sensor. Whether a displayed PM₂.₅ mass estimate corresponds to dry particulate mass is another question. Keep the event and its context rather than labeling it automatically as pollution or error.
Can I dry the inlet to remove the humidity effect?
Changing the sample with a dryer or heater is a measurement-system design decision that can alter particle size, composition and losses. Do not modify a consumer device ad hoc. Use a method built and validated for the quantity you need.
Why do two monitors show different PM₂.₅ during fog?
They may differ in inlet design, optical geometry, size thresholds, algorithms, maintenance or sample humidity. Co-locate them and check instrument state, but use an appropriate reference before declaring either one correct for dry mass.
Should I remove humid spikes before comparing an air purifier?
Do not erase them without a stated quality rule. Retain raw data, flag the events, and compare periods with similar source and moisture conditions. If a correction or exclusion is used, report the rule and test whether the conclusion survives without it.
Nguồn kỹ thuật
- US EPA, Low-Cost Air Pollution Monitors and Indoor Air Quality
- US EPA, Evaluation of Emerging Air Sensor Performance
- Sensirion, SPS30 Datasheet
- Jayaratne et al., Influence of humidity and fog on a low-cost aerosol sensor, 2018
- Barkjohn et al., PurpleAir PM₂.₅ correction across the United States, 2021
Portable vs Fixed Refrigerant Detection: How Their Jobs Differ
Compare handheld leak locators, fixed-point monitors and aspirating systems by sample location, response chain and commissioning needs.
Đọc thêm
Refrigerant Identification vs Concentration Measurement: Which Test Do You Need?
Distinguish a sealed-charge identifier from ambient concentration monitoring, handheld leak location and formal refrigerant purity testing.
Đọc thêm
Cách giải thích kết quả đo CO2 trong cabin xe
Đọc xu hướng CO2 trong cabin xe cùng với hành khách, chế độ HVAC và điều kiện tuyến đường, đồng thời tách các manh mối thông gió khỏi các câu hỏi về an toàn hạt và khí thải.
Đọc thêm
Giám sát máy sưởi gas tại nhà: Cảnh báo và cảm biến nào hoạt động gì?
Hiểu các vai trò riêng biệt của thiết bị báo động CO trong gia đình, máy phát hiện khí nhiên liệu, thiết bị giám sát CO2 và dịch vụ sửa chữa máy sưởi đủ tiêu chuẩn, bao gồm cả những việc cần làm sau khi nhận được cảnh báo.
Đọc thêm
Cách lập kế hoạch giám sát IAQ trong không gian chung trong nhà
Lập kế hoạch giám sát chất lượng không khí trong nhà cho các thư viện, khu vực chờ và phòng chung bằng cách kết hợp CO2, các hạt và các kênh khác với một quyết định xác định.
Đọc thêm
Cách xây dựng hồ sơ giám sát IAQ của trường dẫn đến hành động
Sử dụng nhật ký phòng, sự kiện có người sử dụng và nhật ký phát hành được liên kết để biến quan sát CO2 của trường thành hoạt động theo dõi thông gió đáng tin cậy.
Đọc thêm