

A classroom CO₂ reading is most useful as a clue about the balance between people producing CO₂ and outdoor air replacing room air during a particular lesson. Read it with the room's occupancy, the time since the class began, the monitor's position and the ventilation state. Then compare several occupied periods. A single ppm number is not a universal health verdict, a measurement of every pollutant, or proof of the outdoor-air flow rate. The UK Department for Education's current school guidance provides one jurisdiction's practical action bands; ASHRAE's position document on indoor CO₂ explains why a number needs conditions and a suitable sensor before a broader inference is made.
This distinction matters in schools because occupancy changes sharply. A room may be empty before the bell, crowded through a lesson, partly empty at a break and used again soon after. One room's afternoon starting point may reflect the previous class. Teachers need a usable signal, while facilities staff need enough context to decide whether to check a ventilation schedule, a window strategy, a diffuser or the instrument itself. The following reading method keeps those jobs connected without making the classroom monitor do work it cannot do.
Start with what the instrument actually samples
People exhale CO₂, and a direct CO₂ monitor measures concentration in the air reaching its inlet. In an occupied classroom, concentration is influenced by the number and activity of people, room volume, air arriving from outdoors or adjacent spaces, air mixing, and the amount of time those conditions have persisted. It is also influenced by the device's measurement method, response time, averaging and calibration state. The display shows the air at one location at one time; it does not automatically equal the room average.
The word direct matters. A genuine CO₂ channel, commonly using nondispersive infrared (NDIR) measurement, is different from an “eCO₂” value inferred from another gas sensor. The DfE names NDIR as an effective monitor type for this use. If the product label or data sheet says that the displayed number is estimated from VOCs, do not treat it as a measured CO₂ concentration. Our direct CO₂ versus eCO₂ guide explains the difference. A complete monitor also includes enclosure, airflow path, software and display behavior, so a sensor component's specification is not the finished product's guaranteed performance.
If a teacher glances at a monitor as children enter, the number may still describe the room left by the previous class. If the monitor sits beside an occupied desk, exhaled breath can bias it upward. Near an open window or supply outlet it can sample a local stream that is lower than much of the occupied space. A steady display can reflect a stable condition—or a slow update or missing data. The HSE's monitoring guidance recommends representative placement and repeated readings in occupied spaces, while ASHRAE highlights location and calibration as conditions for meaningful inference.
For a school response, first write down: Which room? Which device? Where is its inlet? How many people were present? What was the room doing? These are not optional footnotes. They are the minimum facts that turn a number into an observation worth acting on.
Why a lesson produces a changing trace
A typical classroom trace has phases. The level before entry tells you the starting condition, not the quality of the next lesson's ventilation. After entry, more people generate CO₂; the room and instrument take time to respond. During a long, similarly occupied period the line may rise, flatten or fluctuate as windows, doors, occupancy and system operation change. At the break, a falling line may reflect fewer people, more outdoor air, an open corridor door or several events together. After departure, the source from those occupants drops, but the rate of decline still depends on air exchange, mixing and the monitor.
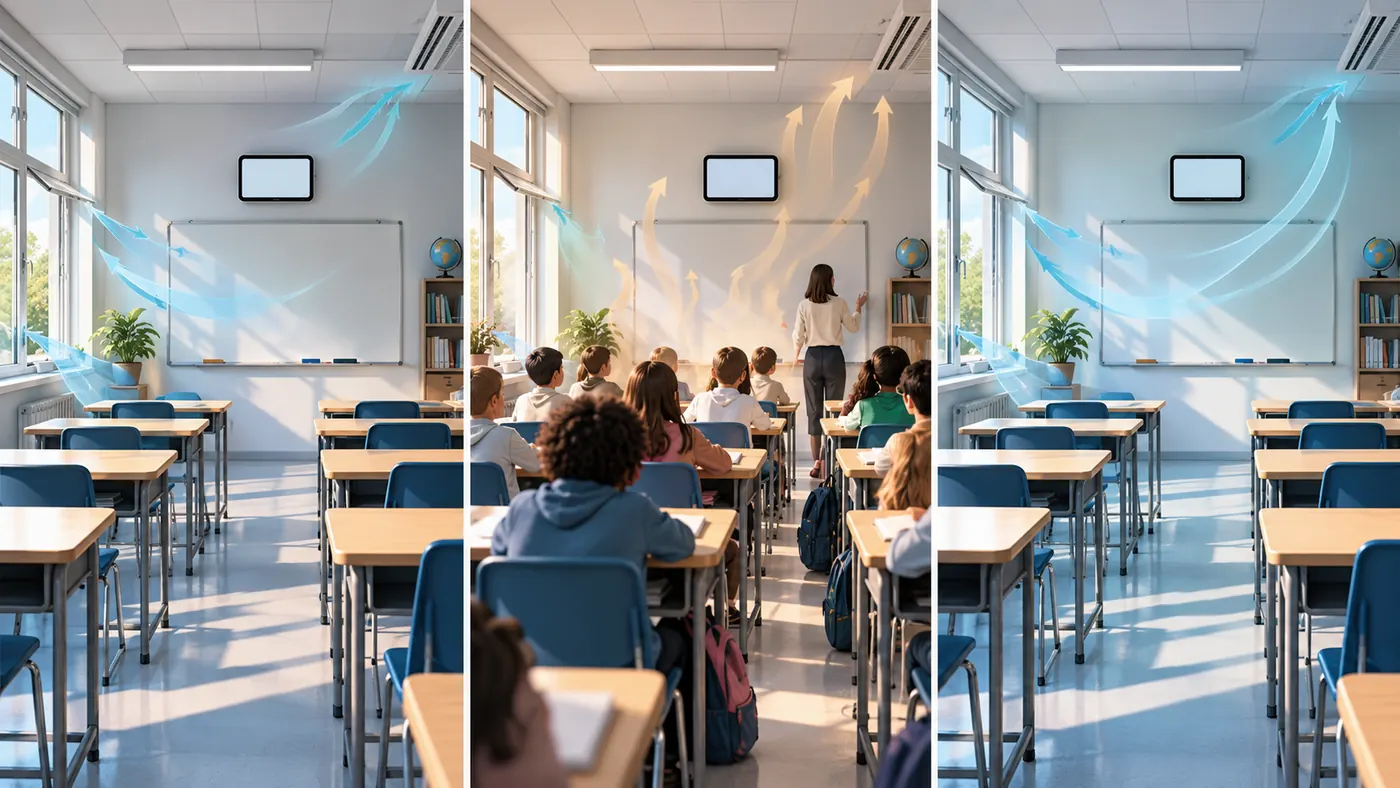
The image shows sequence, not measured ppm. There is no numerical curve because a real classroom's shape depends on conditions. A short class may finish while concentration is still rising. A longer class may look flatter, but a plateau does not by itself prove that a design ventilation rate has been met. A flat-looking line can also be produced by dashboard smoothing or a disconnected logger. The useful comparison is an occupied time window with documented conditions, not the highest number without a timestamp.
Consider two lessons that end at the same displayed value. One began after the room had been aired and rose rapidly with a full class. The other began higher after back-to-back use and rose slowly with fewer people. Their final numbers match, but the ventilation questions differ. Conversely, two rooms with different end values may have different class sizes or starting conditions. To compare rooms or a before-and-after change, keep the occupancy and operating context as similar as practical and explain differences that remain. Our office-zone comparison method describes instrument agreement and synchronized time-series checks that also apply to multi-classroom studies.
Read local school guidance as an action scheme, not a universal health table
The Department for Education's 2026 guidance for England gives a clear example for settings to which it applies. It describes readings under 800 ppm as indicating good ventilation, 800–1500 trang/phút as adequate while suggesting opportunities to improve it, and over 1500 ppm as poor ventilation calling for an increase in ventilation where possible. Its page also advises locating the monitor representatively and considering room use. These numbers are that guidance's management bands for education settings. They should be cited with their jurisdiction, current version and intended use, not presented as world-wide medical toxicity limits.
| Reading in the DfE guidance for England | How the document uses it | What it does không establish by itself |
|---|---|---|
| Under 800 ppm | A practical indication of good ventilation in that scheme; continue providing background ventilation and observing conditions. | That all pollutants are absent, infection risk is zero or the room will stay at that level when full. |
| 800–1500 trang/phút | Adequate in that scheme, with consideration of safe ways to improve ventilation. | That every room in every country meets its design or legal requirement. |
| Over 1500 ppm | Poor ventilation in that scheme; increase it where possible and investigate recurring occupied conditions. | That the number is a direct health-injury threshold or identifies the failed component. |
The DfE page includes practical suggestions such as safe window opening and maintaining mechanical ventilation; it also warns against wedging fire doors open. Apply the school's actual fire, security, weather and building requirements. An indoor CO₂ monitor does not authorize an unsafe change to a controlled door or laboratory room. Where the local school authority or building code has a different decision rule, use that rule with its full context. A US classroom program, UC Davis WCEC's CalSHAPE sensor guide, uses its own bands and follow-up steps for sensors installed under that program. Its values are helpful for that program, not a replacement for all other school guidance.
ASHRAE also distinguishes a ventilation/IAQ indicator from direct health evidence. Its 2025 position document states that research on direct effects of CO₂ at commonly observed indoor levels is inconsistent and does not support turning one ordinary classroom number into a prediction of learning or symptoms. The old habit of calling 1000 ppm a universally “safe” or “dangerous” line loses the conditions that make measurements useful. A school should not dismiss a repeatable ventilation concern because a value sits just below a copied number, or alarm families by calling every brief crossing a toxic exposure.
Use a five-step reading ladder
1. Confirm the monitor and its location
Confirm the device measures actual CO₂, has completed its required startup, is powered and has a readable clock or log. Check the monitor's manual for operating conditions and calibration behavior. The final device's stated accuracy has conditions; the screen's resolution is not the same as accuracy. If a reading is implausibly low or jumps when a person speaks next to the inlet, move to a representative position and repeat before diagnosing the room. The CO₂ monitor accuracy guide explains why small displayed increments do not guarantee small uncertainty.
For a typical classroom in England the DfE suggests one sensor as a starting point, at table or head height when seated, away from doors, windows and ventilation outlets and at least 0.5 m from occupants. A naturally ventilated or unusually shaped room may vary spatially; an observation at one point is a screening point, not a guarantee of uniformity. Where the reading drives a serious facilities decision, test another location or use a qualified assessment.
2. Identify the occupied interval
Mark the start and end of the class, head count and any period when the room was partly empty. Compare a reading during a genuinely occupied interval with other periods that have similar use. A number recorded before pupils arrive is a useful starting point but not evidence of the occupied ventilation condition. A single value after a short burst of activity may reflect local disturbance or sensor response more than a stable room pattern. The Welsh Government's education guidance, for its own settings, advises repeated occupied measurements because snapshots can mislead.
3. Note air-path events
Record whether windows, doors, vents or the mechanical outdoor-air system changed and when. A corridor door transfers air between spaces; it is not necessarily an outdoor-air supply. An air cleaner that filters particles may improve particle exposure but ordinarily does not provide outdoor air or lower CO₂. The DfE explicitly separates air-cleaning units from ventilation in its school advice. If a line falls just when pupils leave and windows open, attribute the fall to the combined event rather than confidently to either one.
4. Look for repetition, not just a peak
Does the same occupied-phase pattern recur on comparable days? A single unusual lesson can be caused by a field trip, a closed window in heavy rain, a timetable change or a device that was moved. If the concern repeats when occupancy and ventilation modes are similar, the facilities team has a stronger lead. Preserve exceptions rather than deleting them: they often explain why a simple before-and-after comparison is weak. A logger can help if the decision depends on trend, but a screen-only device can still support a structured set of manual checks. The logger-versus-display guide sets out that choice.
5. Apply the relevant decision rule and test the response
Use the applicable local school guidance and building plan after the observation is credible. For a recurrent concern, check that designed ventilation operates during occupied hours, that outdoor-air paths are open as intended, and that staff know what controls they can safely use. Record a specific action, the time it was made and comparable readings afterward. A lower value on one subsequent day is encouraging but does not by itself prove the system has been fixed; class size, weather and opening state may have changed. A review over several similar periods is more persuasive.

The laptop-like trend in the illustration is conceptual and has no calibrated scale. A real facilities record should retain raw timestamps, units and device details. Do not invent an air-change rate by reading the slope of a routine lesson trace: tracer-gas methods require assumptions about source generation, mixing, outdoor background and system stability that may not hold while children enter and leave.
What a low or high CO2 reading does not tell you
CO₂ is one part of indoor air assessment. It can help reveal patterns in the accumulation of occupant-generated air under appropriate conditions, but it does not measure PM₂.₅, carbon monoxide, formaldehyde, cleaning-product emissions, mold or outdoor traffic pollution. A room can have a reassuring CO₂ value while a cleaning chemical, smoke or moisture problem still needs attention. A room can have a high CO₂ value without proving that CO₂ itself caused a pupil's headache or that a particular person will become ill. The US EPA's school IAQ reference guide treats source control, outdoor air, temperature and humidity as connected parts of school IAQ. ASHRAE explicitly says CO₂ is not a good overall IAQ metric.
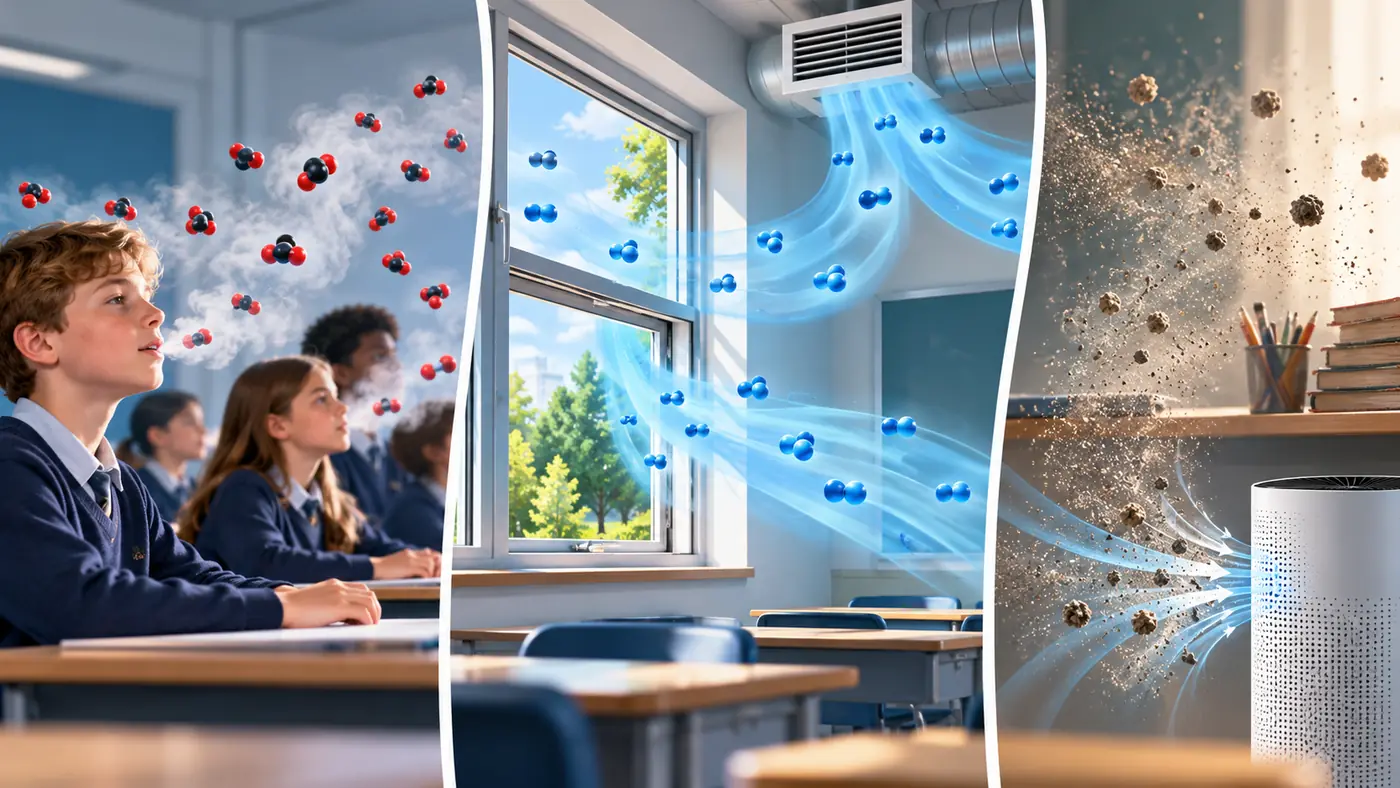
The molecules and air streams in that image are explanatory symbols, not a claim that a classroom contains those exact paths or quantities. A particle air cleaner may address certain airborne particles while leaving exhaled CO₂ essentially unchanged; a drop in CO₂ does not confirm that particles were removed. Our air purifiers and CO₂ guide examines that distinction. A device marketed as a single “air-quality score” may combine unlike channels with undisclosed weighting. Read the measured parameters separately before using the score for a school decision.
CO₂ is also not carbon monoxide (CO). A classroom ventilation monitor does not replace a properly selected CO alarm or a gas-safety assessment. Nor does CO₂ alone quantify airborne infection risk: emissions, activity, filtration, mask use and other conditions matter. A general classroom CO₂ display should never be presented as an infection-safety clearance. Formal ventilation commissioning and any legal compliance decision need the specified local method and trained personnel.
A practical teacher-to-facilities handoff
Teachers should not have to become ventilation engineers. A short observation makes their message useful: room and monitor location, date and time, approximate pupils and staff, how long they had been present, displayed value or log segment, window/door state, and whether the same pattern appeared before. If the monitor is missing data or recently moved, say so. Send the observation through the school's normal facilities process rather than a public class leaderboard.
Facilities staff can then check the room timetable, serving air system, occupied schedule, manual settings and maintenance history. They can compare another room only if device and use conditions are comparable. When conditions permit a safe intervention, note what was changed and follow up under similar occupancy. If a reading remains concerning under the relevant local guidance, the next step might be a targeted equipment inspection or professional ventilation measurement. If it resolves after a simple authorized operational change, keep the record that shows both the action and the repeat condition.
This handoff also protects against a subtle mistake: treating the school dashboard as the whole IAQ program. Complaints about odors, dampness, temperature or particles need their own source investigation even when CO₂ appears low. The EPA's approach to schools combines observations, maintenance, staff communication and problem solving. If the issue includes symptoms or an urgent safety concern, follow the school's established health and emergency procedures rather than using a blog chart as a decision rule.
Questions schools commonly ask
Is a classroom at 900 ppm safe or unsafe?
That single number cannot answer a general health question. In the DfE scheme for England, 900 ppm falls in its 800–1500 ppm ventilation-management band; the page suggests considering safe ways to improve ventilation. Another jurisdiction may use a different scheme. First confirm the monitor, occupied context and whether the pattern is recurring. CO₂ by itself does not describe every hazard in the room.
Why does the reading rise after students sit down?
Occupants are a CO₂ source, and the room and sensor need time to respond. How quickly the trace changes also depends on outdoor-air supply, room size, mixing, activity and where the monitor is placed. A rise is expected in many occupied rooms; its context and repetition determine what to investigate.
Does opening a window prove the school fixed ventilation?
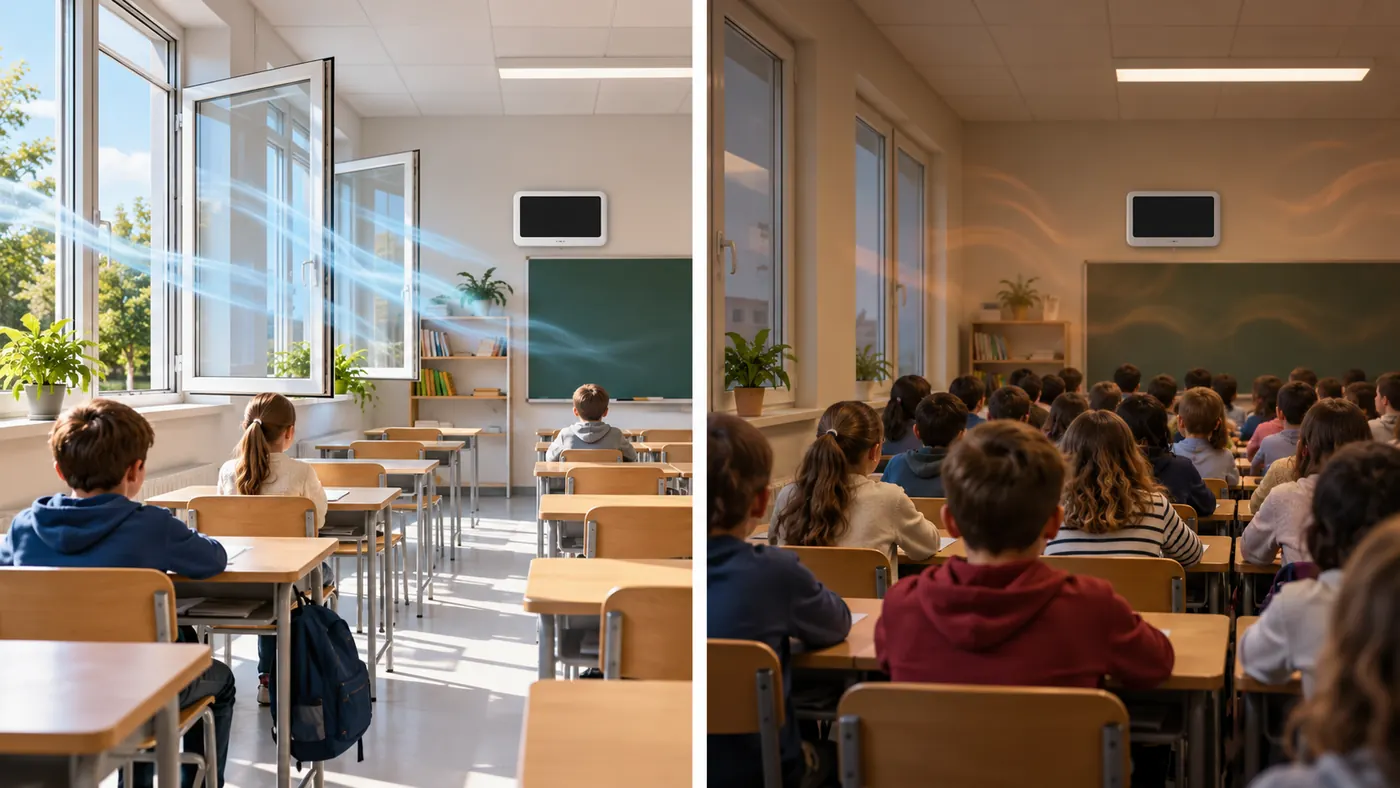
An open window may increase exchange, depending on weather and the available air path. It may also cause drafts or conflict with safety and security conditions. A falling line after a window change is evidence about that observed period, not proof of year-round design performance. Repeat under relevant conditions and involve facilities staff when the concern persists.
Can a corridor CO2 monitor represent every classroom?
Usually not. A corridor has different occupancy, volume and air transfer. It may be useful for a specific corridor question but should not be relabeled as the occupied air in multiple rooms. Choose a representative classroom position for a classroom question.
Should we use the same numerical alert in every country?
No. Keep the applicable jurisdiction, document version and intended purpose with an action value. The DfE, Welsh and CalSHAPE examples were written for their own settings. A globally portable method is to verify the measurement, document conditions, compare relevant occupied periods and apply the governing local guidance.
Why do two monitors disagree?
They may differ in accuracy, calibration, response, averaging, clock settings or sampling position. Put them side by side in representative air for a check, then read each finished product's instructions. Agreement between two devices is not a calibration certificate, and a small difference may be inside their combined uncertainty.
Does a flat line mean the outdoor-air rate is adequate?
Not necessarily. It may reflect an approximate source–removal balance under the particular conditions, fewer pupils, a changed door, a slow display or a data gap. A ventilation-rate estimate needs an appropriate method and assumptions; a visually flat dashboard line is not a commissioning report.
What if the reading is low but the room smells bad?
Investigate the odor or source separately. CO₂ does not measure most chemical, moisture or particle problems. The EPA school IAQ guidance stresses source control and building inspection alongside ventilation. A low CO₂ display should not close an unrelated complaint.
Source notes
This reading method draws on the UK Department for Education's current education ventilation guidance, ASHRAE's 2025 indoor CO₂ position, HSE workplace CO₂ monitoring advice, cái US EPA school IAQ reference guide, and the UC Davis CalSHAPE classroom sensor explanation. The numerical bands in the table belong to the named UK document; equipment manuals, local rules and the actual building govern an individual school.

How to Build a School IAQ Monitoring Record That Leads to Action
Use linked room, occupied-event and issue logs to turn school CO2 observations into reliable ventilation follow-up.
Đọc thêm
Where to Place CO2 Monitors in School Classrooms
Choose representative school classroom CO2 monitor positions by occupancy and air paths, then verify, document and maintain the installation.
Đọc thêm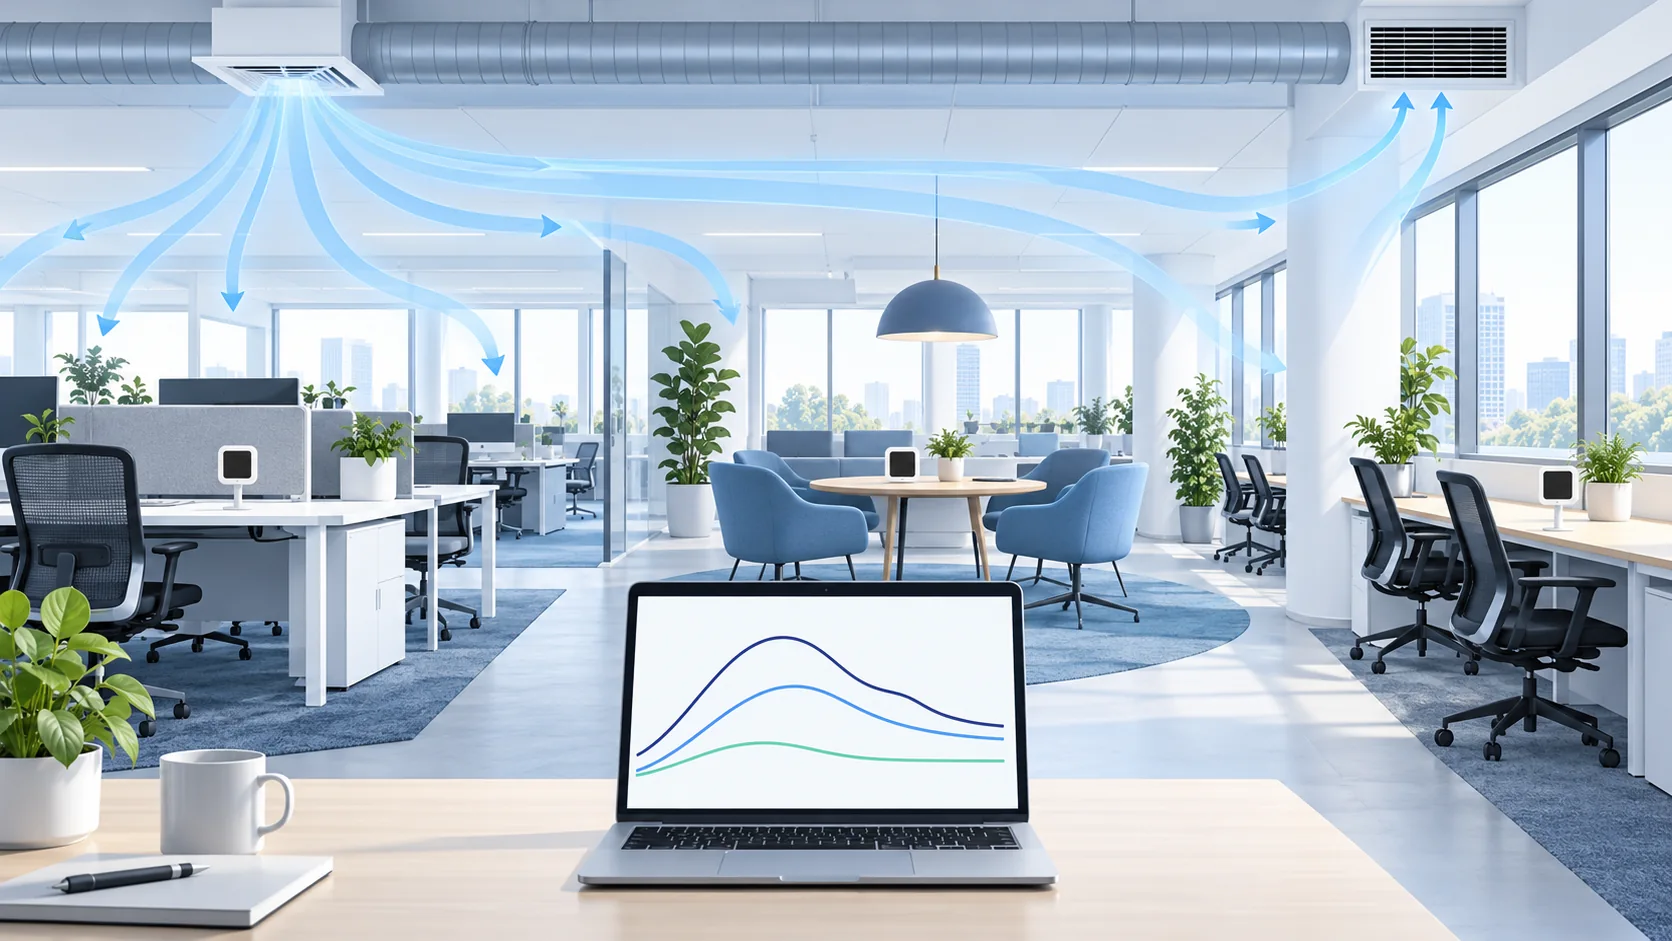
Cách so sánh chỉ số CO2 giữa các khu văn phòng có kế hoạch mở
So sánh nhật ký CO2 được đồng bộ hóa của khu vực văn phòng sau khi kiểm tra thỏa thuận giám sát, vị trí, công suất sử dụng và các sự kiện hệ thống không khí; tìm hiểu khi nào có sự khác biệt về vùng cần được điều tra.
Đọc thêm
Cách đọc xu hướng CO2 trong phòng họp so với tỷ lệ lấp đầy
Đọc xu hướng CO2 trong phòng họp với các sự kiện sử dụng và thông gió, phân biệt mức độ bắt đầu, mức tăng sử dụng, can thiệp và giảm sau cuộc họp.
Đọc thêm
Cách lên kế hoạch đặt thiết bị giám sát CO2 trong văn phòng
Lập kế hoạch các vị trí giám sát CO2 của văn phòng đại diện theo mục đích đo lường, tỷ lệ sử dụng và đường dẫn khí, sau đó xác minh vị trí và bối cảnh nhật ký trước khi sử dụng dữ liệu.
Đọc thêm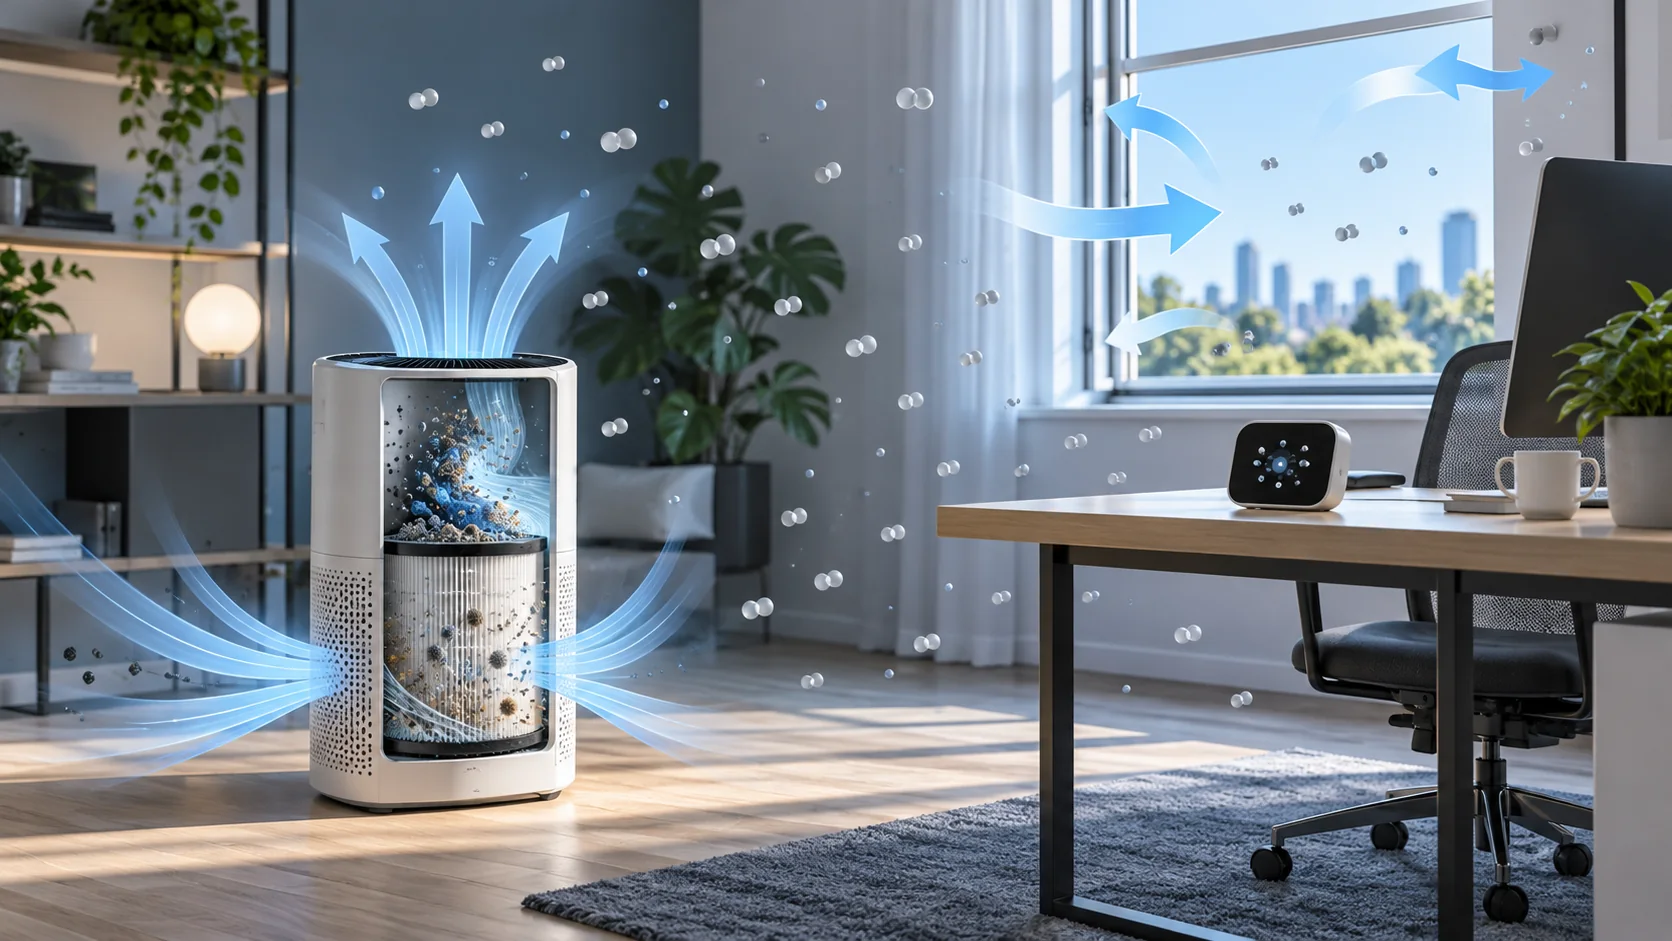
Máy lọc không khí có làm giảm lượng CO2 không? Tách lọc khỏi trao đổi không khí ngoài trời
Máy lọc HEPA thông thường thu giữ các hạt nhưng không loại bỏ đáng kể lượng CO2 do người sử dụng tạo ra. Tìm hiểu cách tách tuần hoàn, thông gió ngoài trời và theo dõi hiệu ứng trộn.
Đọc thêm
Bình luận (1)
[…] This guide is for teachers, facilities staff and school leaders establishing routine ventilation observations. It does not replace the local building code, a commissioned ventilation test or a specialist assessment. If a formal compliance decision is needed, the school should use the specified local measurement method and a competent practitioner. For the meaning of the resulting number, see our guide to interpreting classroom CO₂ readings. […]