
A defensible demand-controlled ventilation (DCV) energy-savings claim compares measured reporting-period energy with a credible estimate of what the same system would have used without the change under comparable conditions. It also shows that the system delivered the required ventilation service. The most useful evidence links a documented baseline, an energy meter, operating variables such as weather and occupancy, and a test of outdoor air delivery.
A CO₂ trend can establish when the controller saw demand. An outdoor airflow trend can show whether the measure reduced the air being conditioned during suitable periods. An energy trend can quantify use within a defined boundary. Each answers a different question. The savings claim depends on connecting all three, while accounting for changes unrelated to the retrofit.

Identify the equipment and energy streams included in the claim before comparing baseline and reporting data.
Write the claim before choosing the meters
Start by specifying the systems, energy carriers, period, and measure that the claim covers. A statement about electric energy for one rooftop unit over a reporting period has a different meaning from annual whole-building energy savings across electricity and gas. A claim for a combined retrofit can be legitimate when the meter covers all participating equipment. A claim attributed to DCV alone requires evidence that separates DCV from other changes.
A usable claim also says what the baseline represents. Common choices include the actual previous sequence, an agreed reference sequence, and a modeled code-compliant design. These are different counterfactuals. A meter history collected under an earlier control fault can describe actual use while presenting a poor comparator for a service-equivalent energy claim. If the baseline supplied more outdoor air than the design required, describe that fact. If it delivered too little, make the service difference visible and decide which baseline is appropriate to the question.
| Proposed claim | Minimum evidence | Boundary or attribution question |
|---|---|---|
| The new sequence reduced outdoor air in defined low-demand hours | Verified flow, mode and demand trends before and after or under a controlled comparison | Did the service floor still hold? |
| The rooftop retrofit reduced metered electric energy | Unit electricity, comparable conditions, baseline model and reporting data | Were gas heat, upstream plant or other loads excluded? |
| DCV by itself reduced HVAC energy | Measurement or model that separates DCV from fan, economizer and other changes | Can the influence of the control measures be identified individually? |
| Annual building energy fell because of the controls package | Utility or whole-building meter data, credible adjustments, substantial effect relative to noise | Did other end uses or concurrent projects change? |
| Annual savings are projected for a different building | A model with site-specific conditions, reference case and disclosed assumptions | Which inputs transfer and which remain to be measured? |
這 DOE Federal Energy Management Program M&V Guidelines, version 5.0 explain how the measurement boundary, period, choice of variables and selected method determine the interpretation of a savings result. The guidance was written for performance-based contracts. The counterfactual and measurement principles also help define a smaller building-level investigation.
Establish how the change could affect energy
Outdoor ventilation may require heating, cooling, dehumidification, or humidification. When outdoor conditions create a substantial conditioning load and fewer people are present, reducing excess outdoor intake can reduce that load. The impact depends on the difference between outside and indoor air conditions, the amount of flow changed, hours affected, equipment efficiency, and heat or energy recovery. A flow reduction that looks large in mild conditions can have little mechanical cooling effect.
Outdoor air can also provide useful cooling. During economizer operation, a properly coordinated system may bring in more air than the DCV minimum because outdoor conditions are favorable. A reporting period with many economizer hours can behave differently from a hot or humid period. The sequence and data should show whether the economizer was allowed to operate and how it interacted with the minimum-air control.
Fan energy depends on the supply and return flow, pressure and equipment response. A reduction in outdoor air fraction while the unit maintains the same total supply flow can affect coils without greatly changing the supply fan load. A retrofit that also lowers fan speed can reduce electricity substantially, but a unit-level meter by itself does not split the change between the fan sequence and DCV. If the equipment contains gas heating, a single electric meter also cannot characterize its gas use.
這 PNNL Advanced Rooftop Control field-test report is an example of a packaged-controls evaluation. The project considered integrated economizer control, fan-speed control and DCV. Its results belong to the documented package and studied equipment. The ASHRAE research summary for RP-1747 describes simulation and lab-scale work on a multizone sequence. Use those studies to understand mechanisms and design a measurement plan. Savings for a particular project depend on the system and baseline actually compared.
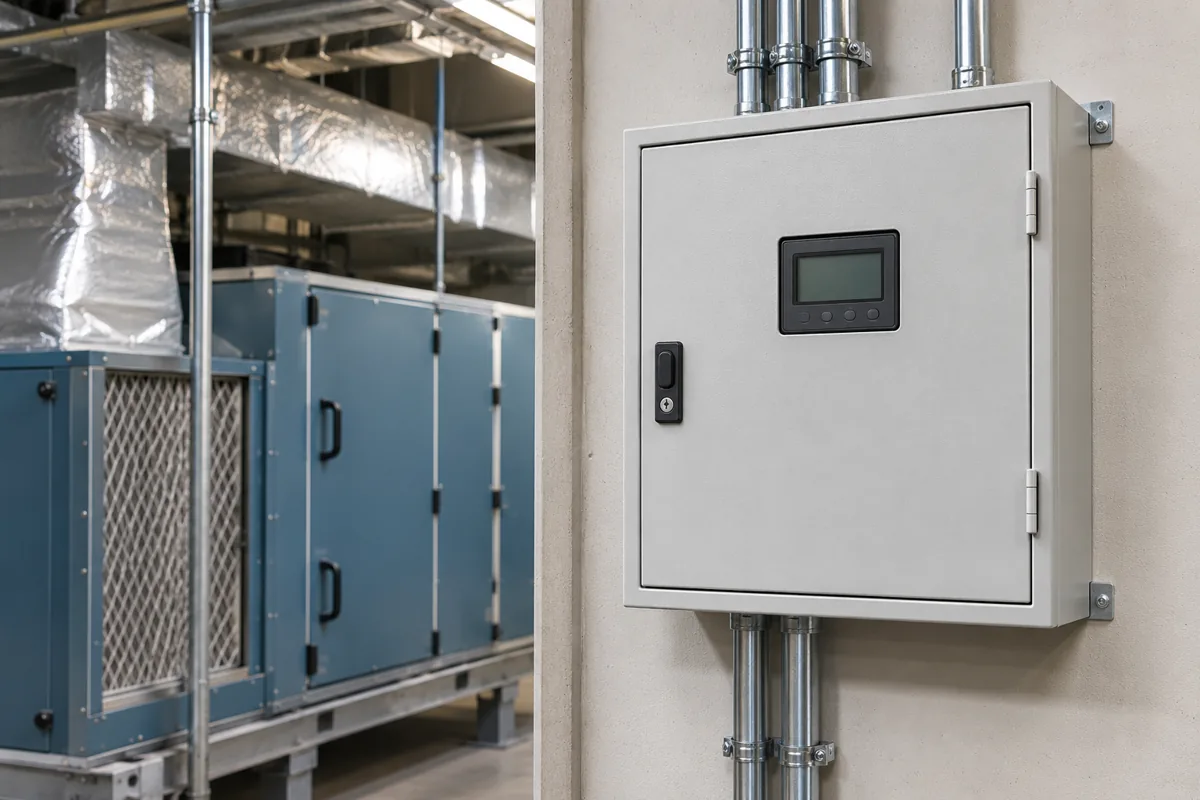
Meter placement determines which loads the result covers. Document equipment served by each meter and any energy stream outside its boundary.
Choose a measurement boundary that matches the question
For a self-contained electric rooftop unit, a submeter can capture compressor and fan energy together when its circuit includes both. If the unit has gas heat, add gas measurement or state that the claim concerns only unit electricity. Where an air handler draws chilled or hot water from a shared plant, its feeder meter may show fan electricity while most conditioning energy is elsewhere. A useful air-handler analysis may therefore need water flow and temperatures, or another means of allocating plant energy under documented assumptions.
A whole-building meter is suitable when the combined change is discernible against other loads and the operating data can explain ordinary variation. It is usually a weaker basis for a small isolated measure when lighting, plug loads, production or tenant schedules changed at the same time. Treat a meter as one boundary, and the retrofit claim as another. If they differ, describe how the extra loads or missing energy streams are handled.
FEMP distinguishes retrofit isolation with key parameters measured and other factors estimated under Option A, retrofit isolation with all relevant parameters measured under Option B, whole-facility measurement under Option C, and calibrated simulation under Option D. The label matters less to a reader than seeing which variables were measured, stipulated or modeled. A complex DCV strategy can have time-varying effects that make a short spot test suitable for proving function and insufficient for quantifying seasonal energy.
Define demand and energy separately. Electrical demand is typically measured as an average power over a specified interval. Energy adds use over time. Lower monthly energy does not establish a reduction during the utility's billing peak. A cost claim also depends on rates, demand charges and fuel prices. If the project reports cost, retain both the physical energy result and the tariff calculation.
Establish data integrity before relying on the trend
Verify meter IDs, units, scaling and time conventions. A cumulative kWh register can reset or roll over. A recorded kW point may be a snapshot, an interval average or a derived load. Electrical meters can be wired to the wrong equipment or have incorrect scaling. For thermal energy, a sensor pair with poor differential accuracy can produce large relative errors when the temperature difference is small.
Align meter data with HVAC mode, fan speed, damper position, measured outdoor airflow, outdoor temperature, outdoor moisture when material, and occupancy or an appropriate schedule proxy. The timestamps matter especially when equipment cycles between modes. Preserve gaps, sensor quality flags and periods with overrides. A missing block during high-load weather should be visible in the report and handled according to a documented method.
Adjust the baseline to comparable weather and use
Energy savings are usually calculated as baseline energy adjusted to the chosen conditions minus measured reporting-period energy, with separately documented changes when needed. One approach evaluates the old sequence under the reporting period's actual weather and occupancy. Another compares both cases under a stated set of normal conditions. The choice changes the meaning of the answer. Describe the conditions explicitly so a reader can distinguish a period-specific result from a normalized annual result.
Expected changes in temperature, humidity, operating hours and occupancy can be explanatory variables if the project captures them and the model supports their use. An unexpected expansion, major schedule change or permanent shift in occupancy may call for a non-routine adjustment under the chosen plan. FEMP's final guidelines include a DCV example in which the building adds occupants and the rooftop unit's energy rises. The adjustment prevents the unrelated occupancy increase from being mistaken for poor measure performance.
Avoid treating a control outcome as an independent adjustment variable. For example, actual post-retrofit damper position is part of the effect the measure is intended to change. Feeding that position into a counterfactual model for the old sequence can remove the very difference being measured. Actual occupancy, when measured independently and relevant to both conditions, is a stronger explanatory variable. CO₂ itself depends on both occupancy and ventilation, so use it with care when comparing across sequences.
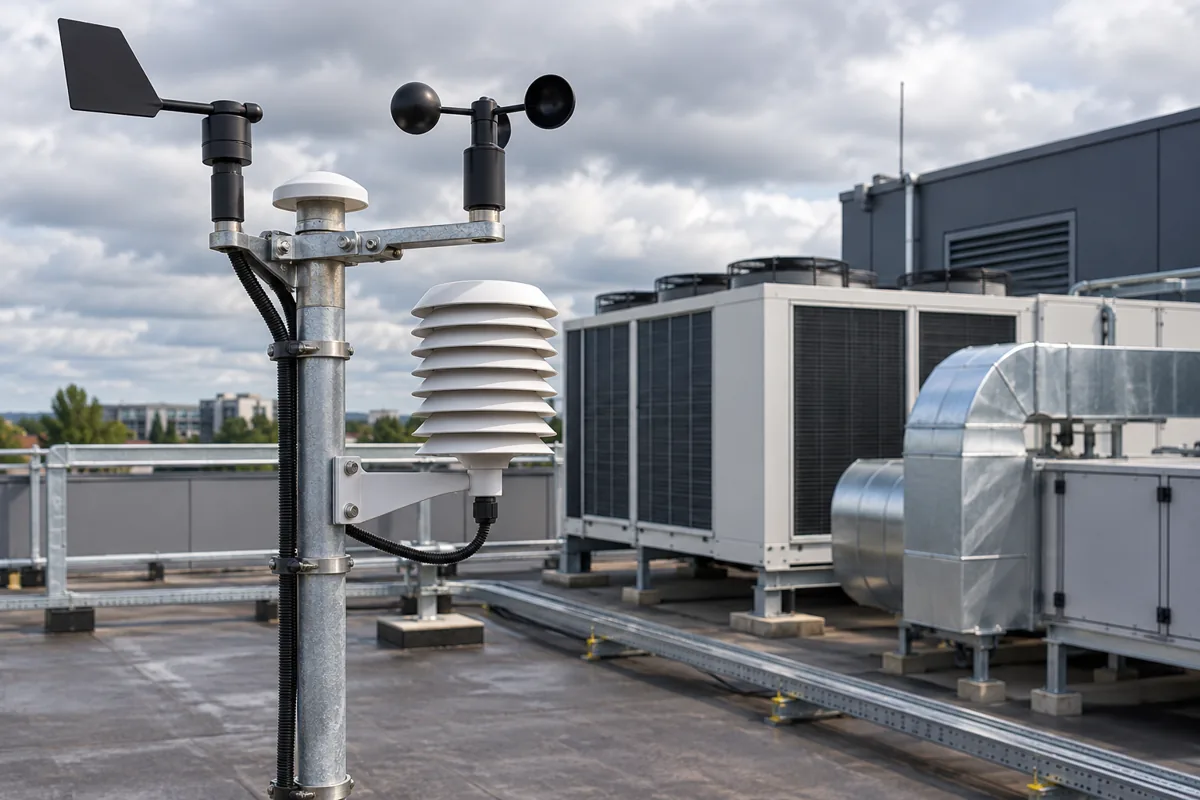
Weather is an input to the comparison. Humidity and economizer conditions can matter alongside outdoor temperature.
Worked example of an adjusted baseline
A hypothetical all-electric rooftop unit used 9,800 kWh in a reference period before a controls change. In a later reporting period, its meter shows 8,500 kWh. The difference between raw totals is 1,300 kWh. Suppose an acceptable baseline model, developed from a broader baseline dataset, predicts that the old sequence would have used 9,200 kWh under the reporting period's weather and occupancy. The adjusted estimate is 9,200 − 8,500 = 700 kWh for the stated period and meter boundary.
That arithmetic is illustrative. A real report would show why the model supports the adjustment, whether the reporting conditions fall within its reliable range, and how model uncertainty compares with the estimated effect. If the uncertainty on the adjusted result is comparable to 700 kWh, the magnitude may remain unresolved. A real uncertainty statement depends on the model, measurement uncertainty, residual behavior and reporting-period conditions.
| Example quantity | 價值 | 意義 |
|---|---|---|
| Raw baseline-period meter total | 9,800 kWh | Old sequence under old conditions |
| Raw reporting-period meter total | 8,500 kWh | New sequence under later conditions |
| Adjusted baseline prediction | 9,200 kWh | Estimated old sequence under the selected reporting conditions |
| Raw arithmetic difference | 1,300 kWh | Includes period differences beyond the controls change |
| Adjusted arithmetic difference | 700 kWh | Example energy result pending service, model and attribution checks |
Test model behavior across operating regimes. A single regression line can miss the transition from heating to economizer cooling to mechanical cooling. A plausible model might use different relationships for identifiable regimes or a validated change-point structure. Check holdout periods where data permit, and inspect bias by weather and occupancy, rather than relying on a single goodness-of-fit number. Disclose periods outside the observed range, such as an unmeasured design-cold week.
If the site lacks a reliable baseline period, consider a safely authorized and project-approved comparison that switches between permitted sequences under suitable conditions, or an independently calibrated model. A temporary comparison must preserve required ventilation and record the switching schedule. It can help distinguish mechanisms over the modes represented, while leaving seasonal inference uncertain if it never captures important conditions.
Make ventilation service a separate acceptance test
Energy savings evidence is stronger when the project can show that intended outdoor airflow continued to reach the spaces served. Start with the project design and applicable ventilation criteria. Determine the required occupied minimum, response to higher occupancy, applicable exhaust or pressure constraints, and governing mode overrides. Then establish a measurement method for each relevant point. At a minimum, distinguish air-handler outdoor intake from total supply and from outdoor air delivery to a specific zone.
An outdoor airflow station can be useful when its installation and low-flow performance are verified. A damper command alone gives an opening request. It can be the same at two fan speeds while the actual intake differs. A CO₂ reading can support interpretation under the conditions of the measurement. A low value in a lightly occupied room leaves the airflow floor unproven. Use airflow evidence along with point status and tests of the active sequence.

Conceptual commissioning scene. A point velocity reading at an intake does not establish the bulk outdoor flow. Use the specified test method and pair central intake with zone checks where needed.
Check representative operating and fault states
Review occupied minimum and rising demand, along with representative occupied areas and any room with unusually high demand. Confirm that the reduced-flow mode still supplies the required outdoor air. Verify economizer interaction, fan speed changes and the operation of any air or energy recovery device. When economizer air is favorable, a low DCV request should not inadvertently block the approved cooling sequence.
Verify sensor validity and fallback. A sensor can stay plausible while drifting or freezing. Confirm representative placement, valid scaling and timestamps, and documented response to detected failure. Retain a record of outages and any periods when staff overrode the system. A system may pass a commissioning test yet spend weeks in fallback due to a communications problem. Such periods can materially change realized savings and require separate reporting.
這 FEMP Energy Efficiency and Indoor Environmental Quality Assessment Guide connects DCV configuration with sensor reliability and IEQ review. A suitable project also checks constraints beyond CO₂ where material. Examples include thermal comfort, humidity, building pressure and ventilation needed for nonoccupant sources. A period of lower energy associated with reduced service should be identified as such.
Document the result and what can be attributed
The report should describe the retrofit date, relevant baseline and reporting periods, meter boundary, treatment of missing data, selected normalization variables, and changes to the facility or controls. It should disclose which operating conditions were represented and which remained untested. Provide enough detail to recreate the calculation from the retained input records. For a bundled project, use language that preserves the boundary of the measured result.
| Evidence in the report | Details that make it usable |
|---|---|
| Baseline | Old sequence, representative periods, occupancy, meter and operating states |
| Reporting period | Metered energy, trends, exclusions, missing intervals and reasons |
| 調整 | Model method, variables, normal or actual conditions and non-routine changes |
| Service verification | Outdoor flow evidence, zone and system modes, alarm tests and constraints |
| Attribution | Changes made together, what can be isolated, and applicable exclusions |
| 堅持 | Sensor checks, mode or override drift, and how future changes will be captured |
A useful review separates measurement from causal language. “The unit used 700 kWh less than the adjusted baseline estimate in the stated period” identifies an energy comparison. “The DCV-only change saved 700 kWh” asserts that other changes were successfully separated. For example, if a new fan motor and a DCV sequence were installed on the same day and measured with one circuit meter, report the combined change unless an appropriate additional analysis isolates the individual contributions.
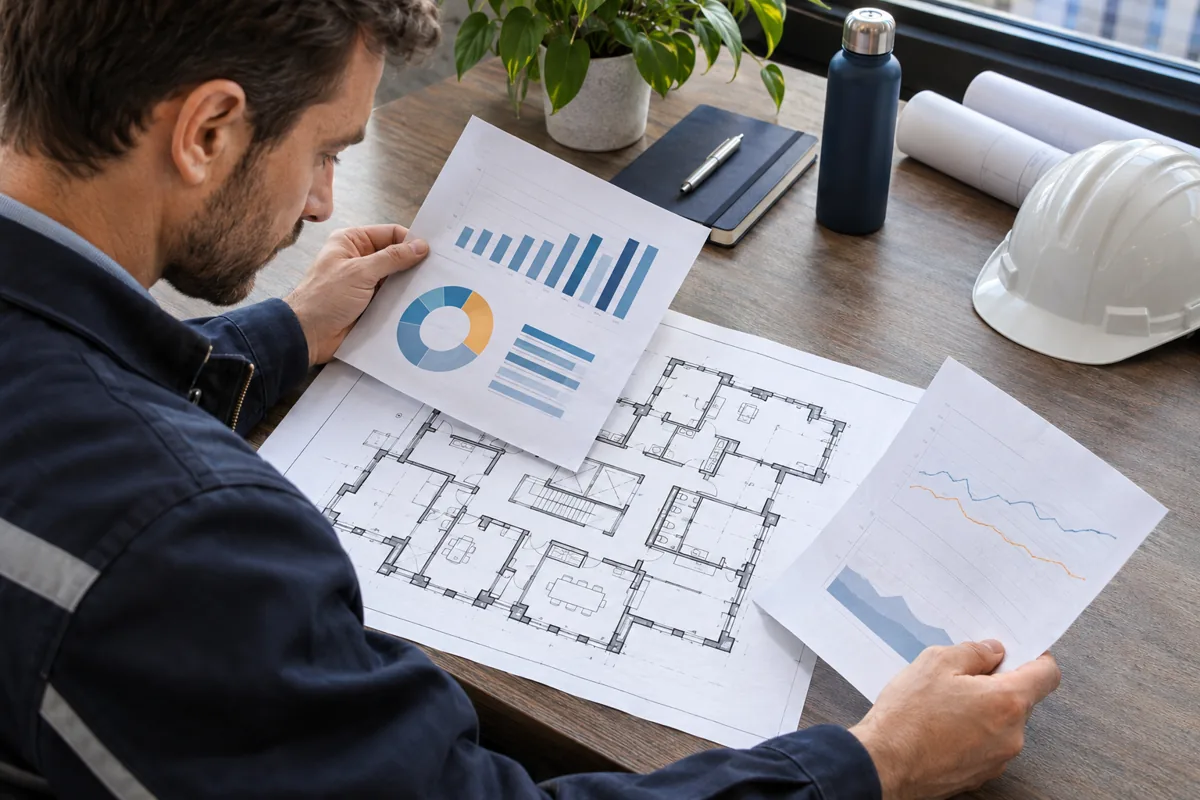
Illustrative report graphics. Keep the actual energy result, normalization inputs, ventilation tests and change record together.
Recheck the conditions that determine persistence
A sequence can change after handover through software updates, sensor replacement, equipment repair or operator overrides. A season with unusual occupancy can also affect the benefit without indicating a fault. Follow the points that explain the mechanism. Examples include hours at the occupied minimum, frequency of high-demand response, economizer hours, outdoor flow in tested modes, and time spent in fallback.
For a follow-up interval, use the original boundary and agreed adjustment method or document a justified change. A new tenant schedule may require a non-routine adjustment under the plan. A trend showing persistently low CO₂ may reflect fewer occupants or greater outdoor air. Pair it with outdoor airflow, mode and occupancy before drawing a conclusion about why energy changed.
Build the reporting intervals around the mechanism
Choose a reporting interval that includes the modes capable of contributing materially to the claim. A few mild days can show whether DCV reduces outdoor intake at low occupancy, yet leave heating and dehumidification effects unresolved. If the retrofit is expected to affect summer coil load, retain weather and occupancy data in that regime. If gas heat dominates winter use, verify gas coverage or limit the claim to the electric boundary. Document a mode that was expected to contribute but did not occur during measurement.
A useful intermediate calculation separates hours from magnitude. For example, classify occupied intervals by low and high demand, and within those groups identify minimum-air, economizer and protection states. Compare the old and new sequences only in categories that can be meaningfully reconstructed. This shows whether a small measured result follows from few opportunities, small changes during qualifying hours, or a meter boundary that misses important loads.
Before aggregating, align data to a common basis. If the electricity meter stores 15-minute interval energy and the control system samples one-minute operating states, retain a defensible method for assigning each interval. One option calculates the share of valid minutes spent in each state. A rule that labels an entire interval by the first recorded mode can misclassify cycling units. A consistent aggregation rule matters more than false precision in the final decimal places.
Ask what changed at the same time
A baseline record should capture service schedules, temperatures, major equipment and operating practices. Suppose a unit controller and a building-wide start-time program changed during the same weekend. Both can lower unit energy. An adjustment for schedule is defensible only if the relevant schedules and effect can be established and if the plan treats the schedule change as outside the measure. If the scheduling change is itself part of the installed package, it belongs in the combined result.
Keep a dated change log with supporting records and the rationale for treating each change. A note such as “occupancy varied” is too broad to reproduce. A more useful entry identifies the area, date, scale, evidence, and which part of the model or comparison was affected. FEMP distinguishes ordinary variation that can be modeled from unexpected changes to otherwise stable conditions. That distinction is especially useful when the measure responds directly to occupancy.
Test whether the measured signal is large enough
The value of a tightly metered boundary is greatest when the expected change is small relative to other loads. If the reported reduction is smaller than typical model errors or meter variations over comparable periods, retain the estimate with the supported uncertainty and avoid a precise attribution. A tighter comparison may use more operating data, a suitable smaller boundary, or a designed sequence comparison. In some projects the best conclusion is strong evidence of correct operation with an unresolved energy magnitude.
A report can show a range of results across reasonable modeling choices, such as two defensible occupancy treatments. Explain which model was selected for the primary result and why. If both produce materially different outcomes, the sensitivity is part of the result. It helps distinguish a claim based on robust evidence from one driven by a single assumption.
Evaluate recovery and simultaneous plant effects
An outdoor-air reduction at the air handler can reduce the load on upstream equipment while leaving the same fan and terminal power. Where a heat-recovery device conditions the outdoor stream before it reaches a coil, the coil sees the air leaving recovery. The estimated energy impact should use the appropriate entering conditions, recovery operation and equipment boundary. A dry-bulb comparison may be insufficient when dehumidification is material.
If two air handlers share a central plant, reducing load on one may change the plant operating stage or efficiency. Estimate that effect only with data or a model that can support it. A unit-level ventilation report can establish an outdoor flow reduction while reporting a limited energy result at a separately metered boundary. Clear boundaries let the reader see which savings are directly quantified and which are outside the calculation.
常見問題
Is a utility-bill comparison enough?
Bills can show a change in whole-building energy. To attribute savings, establish a comparison under credible conditions, account for other building changes, and confirm the expected change is large enough to distinguish from background variation. A smaller equipment boundary may be more informative when the measure affects only a few units.
Can reduced outdoor airflow be converted directly into energy savings?
Only with a defensible account of the hours affected, outdoor and indoor conditions, the heating and cooling equipment, recovery, and how other controls respond. A flow measurement verifies part of the mechanism. The energy calculation needs a meter or an adequately supported model.
Can a field study's savings be used as a guarantee?
Field studies establish results for their studied systems, baselines and conditions. Use them to define plausible mechanisms and inform what to measure. A site-specific claim needs its own documented comparison.
Does a reduction in occupied CO₂ validate an energy claim?
It provides evidence about concentration under the conditions measured. Energy use depends on the operating change, conditioning load and equipment. Verify energy and ventilation service with their respective measurements.
What if only one heating or cooling season has useful data?
Report the observed season and operating range. Annualizing the result requires assumptions and a valid way to represent the unobserved modes. Label any extension separately from the verified period.








發表評論