

A gas monitor's resolution describes the smallest increment represented by its output or display. Measurement deviation is the difference between its indication and an appropriate reference value in a defined comparison. A display that changes in 1 ppm increments can still read tens of ppm away from a reference. More visible digits do not demonstrate smaller deviation.
The practical question is which part of the measurement chain creates the number you see. Sensor noise, calibration, compensation, digital conversion, filtering, scaling and display rounding perform different tasks. Check them separately before changing a calibration setting or buying a monitor with another decimal place.

A fine display increment is an interface property. The examples below are hypothetical and do not describe the pictured monitor.
Define the output before judging its resolution
Start by identifying the physical quantity and its units. A CO2 indication in ppm, an oxygen indication in volume percent and a combustible-gas indication in percent of a defined reference are not interchangeable. A smallest displayed change of 0.1 means very different things in these channels. Include the gas and unit whenever recording a resolution claim.
Next identify the output location. A module may send a floating-point digital value, while the finished monitor rounds that value for its screen. A controller may receive an analog voltage, convert it with a separate ADC and display an integer. A data portal may round it again. Each location has its own effective increment, and none alone describes the complete chain's agreement with a reference.
Suppose a module reports 1,002.6 ppm, the monitor shows 1,003 ppm, and a portal shows 1,000 ppm because it rounds to ten-ppm increments. These values can represent the same underlying observation. The difference is formatting, not necessarily sensor drift or a calibration fault. Retaining a synchronized record from each stage makes the distinction visible.
Do not assume every last digit is useful signal. A value can be transmitted with many decimal places because of a numerical conversion or filter calculation. The underlying sensor may have noise and uncertainty much larger than that decimal increment. Conversely, coarser display rounding can hide small real changes that remain available through an appropriately documented digital interface.
| 學期 | Question it answers | 它無法單獨建立什麼 |
|---|---|---|
| Display increment | What smallest change can the screen show? | Reference agreement |
| Digital output increment | What numerical steps can the interface represent? | Independent information in every step |
| 重複性 | How closely do observations agree under repeated conditions? | Absence of a consistent offset |
| Reference deviation | How far is the indication from the comparison value? | Cause of the difference |
| 回應時間 | How quickly does the measurement approach a changed gas value? | Final steady-state accuracy |
| Detection limit | What small signal can be distinguished using a defined method? | General accuracy throughout the range |
這 International Vocabulary of Metrology helps keep these concepts distinct. The table here applies those distinctions to a practical gas-monitoring chain. A manufacturer's usage may add specific test conditions or statistical definitions, so retain its original wording alongside your interpretation.
Quantization creates steps without proving correctness
An ideal rounding operation maps a continuous numerical value to a permitted set of outputs. With a uniform step q and rounding to the nearest value, the rounding difference is bounded by q/2 except for details of tie handling at exact midpoints. If q = 1 ppm, this formatting contribution is at most approximately half a ppm. It does not include sensor error, noise or reference uncertainty.
For example, an underlying value of 1,000.2 ppm rounds to 1,000 ppm, while 1,000.8 ppm rounds to 1,001 ppm. A change of 0.6 ppm crosses a display boundary. Another pair, 1,000.1 and 1,000.4 ppm, produces no visible change even though the underlying value changed. The screen therefore represents intervals rather than proving that the gas stayed exactly constant.
Truncation behaves differently. If software simply discards positive fractional parts, 1,000.9 becomes 1,000 rather than 1,001. Its rounding contribution is directional over that interval. A display specification may not identify the algorithm. For a demanding comparison, inspect the interface and software documentation or test the known conversion path before assigning a quantization model.

Conceptual illustration of a stepped representation. It contains no measured curve, scale or performance claim.
Worked example: a fine increment with a large offset
Assume a stable reference value of 1,000 ppm. A monitor produces five indications: 1,048, 1,050, 1,049, 1,051 and 1,052 ppm. The mean is 1,050 ppm because the sum is 5,250 ppm and there are five observations. The mean comparison deviation is +50 ppm. The observed range is 4 ppm.
The monitor clearly represents 1 ppm steps. Its readings also cluster closely in this short constructed sequence. Neither fact removes the +50 ppm mean deviation. Reformatting the mean as 1,050.000 ppm adds zeros without adding reference agreement. Rounding the individual readings to 10 ppm could make the sequence look completely constant, but the underlying offset remains.
With sample standard deviation, the deviations from the mean are −2, 0, −1, +1 and +2 ppm. Their squared sum is 10 ppm²; dividing by n−1 gives 2.5 ppm²; the square root is about 1.58 ppm. This statistic describes this small sequence only. It is not a reliable estimate of long-term performance, and it is not automatically the same metric as a manufacturer's repeatability specification.
The reference itself has uncertainty, and the gas delivered to the monitor may differ from the reference's gas. In a real report, label the result “deviation from the reference in this comparison” and document the arrangement. Do not silently promote the reference indication into an exact true value.
A coarse increment can conceal otherwise good agreement
Now imagine a device that rounds to 10 ppm but whose underlying indication under one stable condition is 1,003 ppm against a 1,000 ppm reference. Its screen shows 1,000 ppm. That display agreement does not demonstrate zero underlying deviation. A second device showing 1,003 ppm might actually expose a small difference more honestly because its display is finer.
This example is a reason to compare like outputs. A specification based on digital values should not be judged solely using a coarse front-panel display unless the verification procedure permits it. Likewise, a control-system requirement applies to the value the controller uses, including the relevant receiving and conversion stages.
Follow the gas measurement chain to find the cause
The sensor converts a physical interaction into a signal. The electronics condition and digitize it. Firmware applies calibration and environmental compensation. Output software formats, filters or scales the result. The installation determines which gas reaches the sensor and how quickly. A discrepancy can enter at any of these stages.
這 Texas Instruments LMP91051 application report, SNAA207, May 2013, illustrates an NDIR front end and considers ADC resolution relative to noise. It supports a general design point: making the electronic increment smaller than the signal noise does not make all represented increments independently meaningful. Its example electronics are not a specification for every NDIR module.
這 Sensirion SCD30 design-in guide addresses enclosure exchange, thermal placement and airflow. These factors explain why a digital module with a documented output format still needs careful integration. Poor gas access or a thermal gradient cannot be repaired simply by displaying more digits.
這 Dräger sensor handbook, fifth edition, discusses measurement deviations and separates systematic contributions from precision. Its technology-specific sections also reinforce the need to read the applicable instrument instructions. A portable safety instrument, an indoor CO2 monitor and an OEM sensing element cannot share an assumed universal deviation limit.

A digital value can pass through several conversions before it appears in a dashboard. Record the value at each relevant stage.
Worked example: analog scaling can dominate the last digit
Consider a hypothetical 0–5 V transmitter mapped to 0–5,000 ppm and an ideal 12-bit receiving conversion with 4,096 equally spaced codes over that voltage interval. Using the simplified span-over-code-count convention, one code corresponds to about 5,000/4,096 = 1.22 ppm. Exact endpoint mapping depends on the converter and implementation; its documentation determines whether the divisor is 4,096 or another endpoint convention.
If the receiver has a voltage offset of 20 mV, the concentration-equivalent offset is 0.020/5 × 5,000 = 20 ppm. The screen could still display 1 ppm increments. The receiving offset is far larger than its last digit. This is a scaling calculation, not a claim about a particular ADC or product's achievable performance.
Check the output and input using the approved instrument procedures. If the digital module value agrees with the reference while the controller value does not, inspect output span, receiver range, wiring and conversion settings before adjusting the sensor. If both disagree together, the shared measurement or compensation path deserves attention. These observations narrow the investigation; they do not replace electrical and gas-sampling verification.
Do not infer resolution from nominal bit depth alone. Noise, reference stability, input range, gain, unused codes and software formatting affect the effective result. A high-bit-count converter applied to a small fraction of its range can provide fewer useful concentration increments than a simpler converter using its range effectively.
Distinguish noise reduction from improved reference agreement
A moving average can make a display steadier by reducing the visible effect of some short-term fluctuations. It does not automatically correct a constant calibration offset. If the five hypothetical values average to 1,050 ppm against a 1,000 ppm reference, averaging more observations with the same stable offset still centers the result near 1,050 ppm.
For independent observations with similar random variability, averaging can reduce uncertainty associated with the mean. Real gas monitor observations may be correlated by internal filtering, slow gas exchange or a common thermal transient. Treating every one-second record as an independent sample can greatly overstate the information gained. The sampling and filter settings belong in the test record.
Smoothing also delays visible response. Suppose a display looks steady because a long average includes older lower concentrations. During a rising gas concentration, it may lag a faster reference. The difference then reflects dynamics and timing as well as steady-state performance. Compare stabilized plateaus for a steady-state deviation check, and use a separate method to evaluate response.
An unchanged display can have several causes: stable gas, coarse rounding, a filter, an infrequent refresh, a retained last-valid value or a communications fault. Check the timestamp, data-ready or validity status where supported. A display that never moves is not automatically evidence of excellent repeatability.
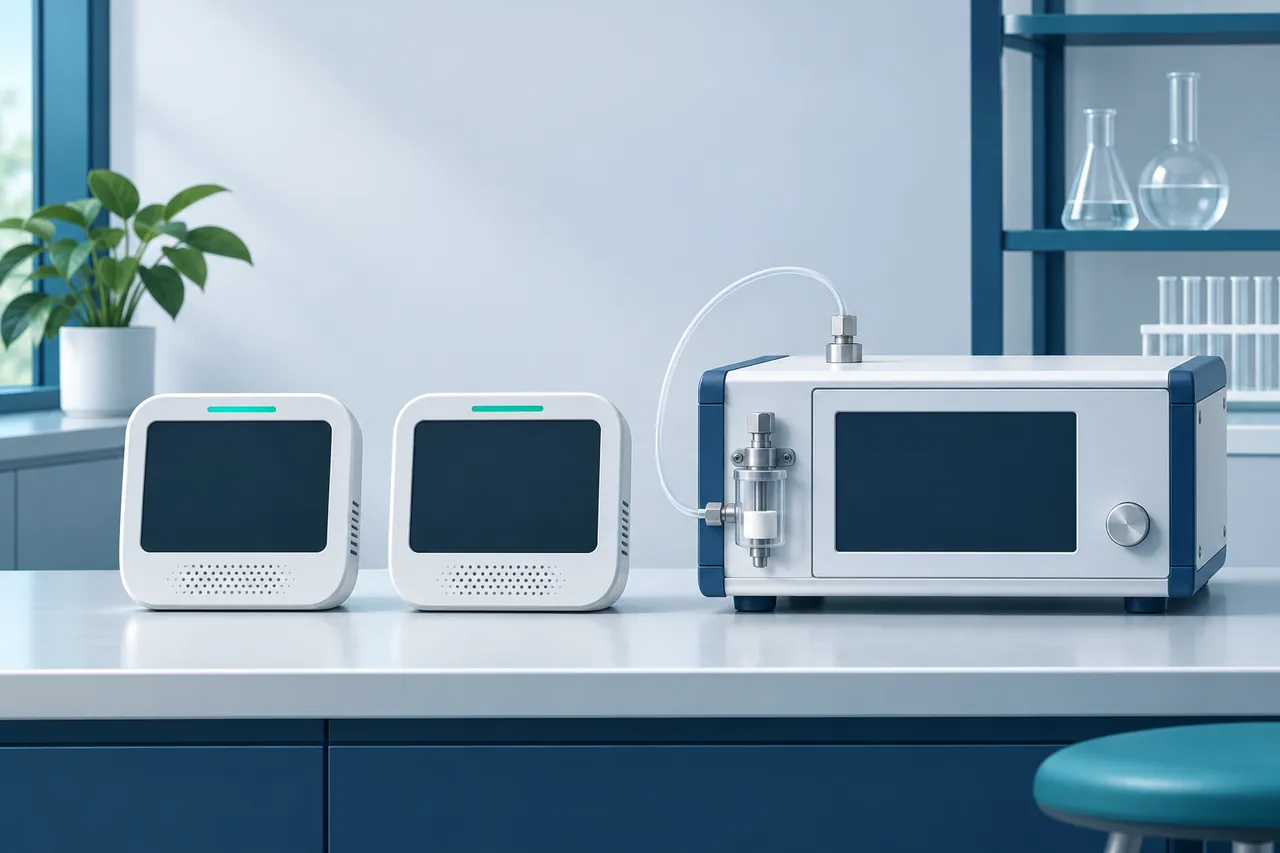
Repeated agreement within each instrument is a different observation from agreement between instruments or with a reference.
Design a comparison that can reveal deviation
Define the measurement first: gas, concentration basis, environmental conditions and output channel. Choose a reference appropriate to that measurement and the required discrimination. State how uncertainty will be handled in the decision. A reference with insufficient capability may reveal a gross issue but cannot support a demanding conclusion about small differences.
Arrange exposure so that the reference and device measure representative gas. In a diffusion comparison, avoid breathing near one instrument, unequal airflow or a local source between them. In a sample system, identify tubing, pressure, flow and conditioning differences. A common location is useful, but it is not proof that the measurement cells contain identical gas at the same instant.
Let the system reach the state required by the product and test method. First data availability, completed warm-up, gas exchange and thermal equilibration can occur at different times. Record the stabilization criterion rather than choosing a convenient snapshot. If the signal continues changing, investigate the transient before interpreting a small steady-state deviation.
Use several comparison points when the application requires a range assessment. A one-point agreement could coexist with a span error elsewhere. Conversely, a consistent difference at one point does not justify a full-range correction. The calibration model and approved adjustment procedure determine what evidence is needed.
At each point, retain synchronized raw values and the output settings. Calculate the signed difference, absolute difference where needed, and short-term spread separately. If the screen rounds coarsely, note the resulting limitation. Do not invent extra precision in the report simply because a spreadsheet permits more decimal places.
| 觀察 | Plausible explanation to investigate | Useful next evidence |
|---|---|---|
| Fine steps, persistent mean difference | Offset or condition mismatch | Suitable reference and compensation settings |
| Screen constant, digital values vary | Display rounding or filtering | Synchronized interface and screen record |
| Digital agrees, analog receiver differs | Scaling or receiving-chain contribution | Approved output/input checks |
| Difference grows during changes | Delay or unequal gas access | Stabilized points and response assessment |
| Mean stable but spread increases | Noise, flow or intermittent interference | Supply, environment and status logs |
| All units agree but reference differs | Shared assumption or reference problem | Independent traceability and method review |
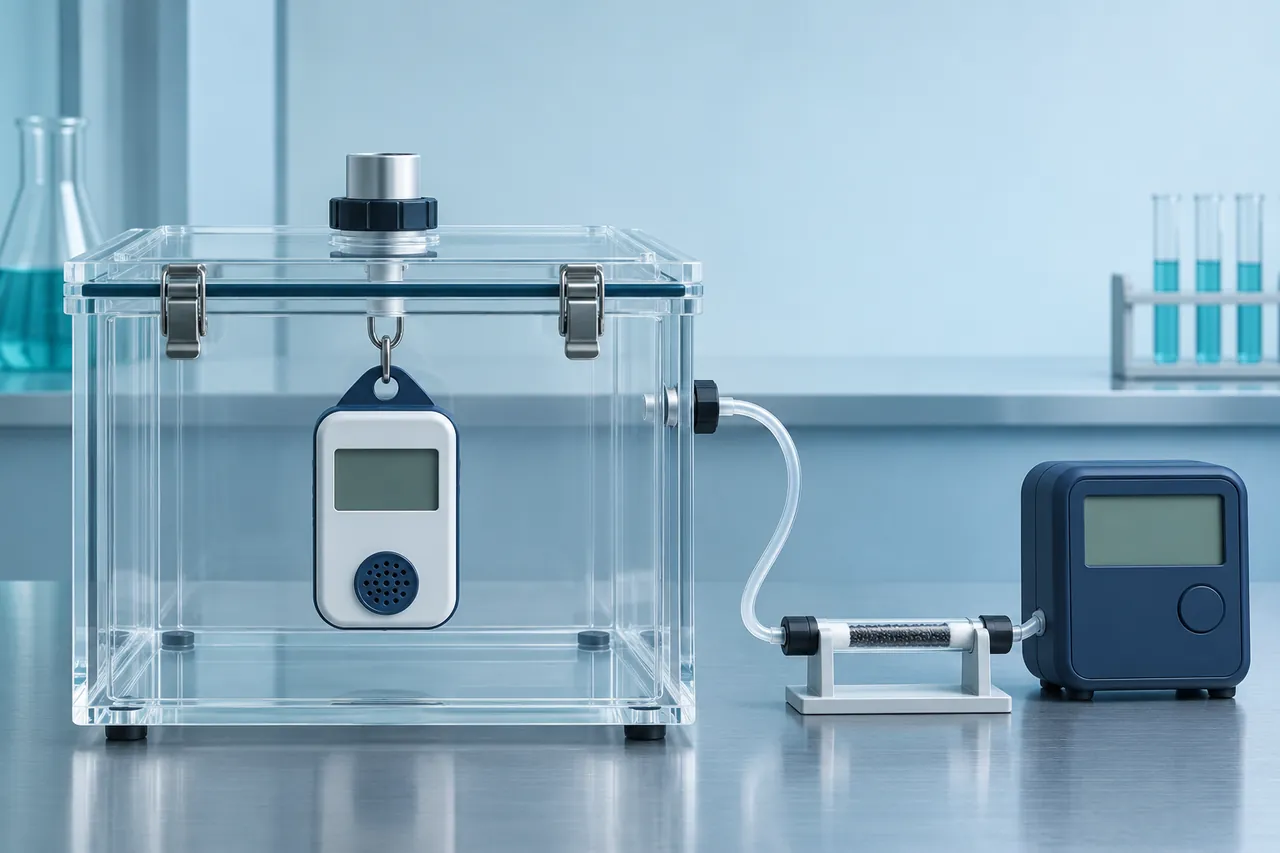
A chamber is only part of a comparison method. Gas homogeneity, pressure, timing and reference uncertainty still need to be established.
Specify useful resolution for the decision
Start with the smallest concentration change that matters to the application, then check whether the complete measurement chain can distinguish it under the relevant conditions. This is broader than choosing a display step. If an application needs to distinguish a small change, short-term noise, response, reference stability and drift may matter alongside quantization.
For a hypothetical trend display where changes of 100 ppm matter, a 1 ppm screen step may provide ample formatting granularity. That does not establish adequate absolute accuracy for the application. For a different task comparing a 5 ppm difference between two locations, the same screen step says little about whether either instrument can support the comparison.
Avoid a universal rule such as “resolution must be ten times better than accuracy” unless a specific method or requirement defines it. Such ratios can be convenient design heuristics, but they do not replace a measurement model. The right increment depends on the reporting, decision and uncertainty requirements.
Review the human interface as well. Excess decimals can encourage overinterpretation, while overly coarse formatting can conceal meaningful trends or create abrupt threshold crossings. A useful display can show an appropriately rounded value while preserving the documented underlying data for analysis. The interface should also communicate invalid, stale or out-of-range states clearly.
Write a purchase requirement that suppliers can answer
Ask for a channel-specific resolution at the output you intend to use, the applicable accuracy expression and range, repeatability definition, response conditions and environmental limitations. Identify the complete monitor rather than only its embedded module. If analog transmission matters, request its additional contributions and scaling behavior.
For data logging, ask whether transmitted values are filtered, how often new measurements are produced, and how validity is indicated. A protocol may deliver a fresh packet containing an old value. The relevant distinction is measurement update versus communication update, not just a high advertised reporting rate.
For maintenance, obtain the approved verification and adjustment procedure. A user-accessible offset control does not mean an arbitrary comparison can justify adjustment. Preserve the as-found result, settings and uncertainty before making any change. A documented correction should answer an identified measurement problem rather than make two screens look identical.
Analyze a small change without confusing the baseline
Absolute agreement and change detection can have different limitations. An instrument with a stable offset may still track a sufficiently large change over a short period, while an instrument with good initial reference agreement may have too much short-term variation for a small differential measurement. Neither statement can be inferred from display resolution alone.
Imagine a hypothetical sensor whose indication changes from 1,050 to 1,150 ppm while a suitable reference changes from 1,000 to 1,100 ppm. Both show a 100 ppm increase, even though the device retains a +50 ppm offset at the two points. The device's change agrees in this constructed example; its absolute concentration does not. A report should preserve both observations rather than choosing the more favorable one.
Now imagine measuring two locations with two different instruments at the same time. One has a +40 ppm offset and the other a −30 ppm offset. Their displayed difference contains a 70 ppm contribution from those offsets, even if each display has 1 ppm increments. Interchanging the instruments or performing suitable common-reference checks may help characterize this issue, but the comparison method must account for location changes and time variation.
The result needed by the application determines the evidence. If the purpose is a concentration difference, specify the difference measurement and its uncertainty. If the purpose is an absolute concentration, verify that quantity. A product sheet advertising a fine increment does not resolve either measurement model.
Keep rounding out of a borderline decision
Suppose a comparison procedure uses a 50 ppm deviation limit and the underlying numerical difference is 50.4 ppm. A report rounded to the nearest whole ppm might show 50 ppm. Whether it meets the requirement depends on the documented decision and rounding rules, including uncertainty treatment. It should not be decided by whichever display format happens to be selected.
Retain enough numerical detail in the working record to apply the chosen rule, while keeping the final presentation appropriately rounded. Do not infer hidden digits when only a coarse screen was observed. If a display step is 10 ppm, the available evidence may be insufficient to resolve a narrow boundary; a more suitable documented output or method may be needed.
A similar issue occurs with time averaging. A dashboard might show a minute average while an operator copies an instantaneous reference value. Their difference mixes reporting intervals and measurement behavior. Align the comparison window before attributing the result to sensor bias. When the gas is changing, explain the interval explicitly in the record.
Finally, check units at export. A software package may switch from ppm to percent concentration or store a raw count beside a scaled display. A value that appears different by a factor of ten, one hundred or ten thousand deserves a conversion-path check before any calibration work. Unit and formatting errors can create very precise-looking wrong values.
Record what a user could actually see
During a field comparison, distinguish a photographed display from a downloaded raw record. A photograph preserves the visible value and status at one instant, while a data file may expose more digits and a different averaging interval. Neither should be substituted for the other without noting the difference. Keep the time, output channel and displayed unit with each observation.
If an operator reports that the display changes in five-ppm jumps, check whether that behavior applies throughout the range. Some products change increment with concentration or operating mode. A low-concentration observation does not establish the output step elsewhere. A mode change may also alter measurement interval, filtering or power consumption, so preserve the complete relevant setting.
For a practical diagnostic record, write one sentence describing the symptom without assuming its cause: “The local display remains at 1,000 ppm while the synchronized digital record varies between 997 and 1,004 ppm.” That statement is directly reviewable. “The sensor is inaccurate because the display is stuck” combines an observation with an unverified explanation. Clear observations make the later reference check more productive.
常見問題
Is a higher-resolution gas monitor always better?
It can represent smaller changes, but that benefit depends on signal quality and the application. A fine increment is useful when the underlying measurement can support it. Compare the complete accuracy and stability conditions, response, integration and reference evidence before ranking instruments by the number of displayed digits.
Can averaging turn a one-ppm display into sub-ppm accuracy?
A numerical average can have a fractional result even when every input is an integer. That does not establish sub-ppm accuracy. Averaging may reduce some random variability, while systematic differences, correlated noise and reference uncertainty remain. Report precision consistent with the justified measurement model rather than the calculator's decimal places.
Why do two monitors both show stable readings but disagree?
They may have different offsets, compensation settings, calibration histories or gas exposure. Stability within each short record only describes local consistency. Use an appropriate common reference and matched conditions to investigate the difference. Do not choose the preferred reading by its apparent steadiness or by averaging two unknown errors.
Is resolution the same as detection limit?
No. Detection limit depends on a defined method for distinguishing a signal from background or noise, often with stated statistical criteria. Resolution describes distinguishable output increments. A device may represent increments smaller than its ability to detect a real concentration change reliably. Read the manufacturer's definition instead of substituting one term for another.
Should I calibrate when the display jumps by one count?
One-count changes can occur when a noisy or changing signal crosses a rounding boundary. Investigate their size relative to the specified behavior, conditions and application. Calibration addresses the relationship between indication and reference; it does not necessarily remove random fluctuation or a formatting boundary. A suitable check should establish a meaningful deviation before adjustment.
Why does the dashboard show different digits from the instrument?
The dashboard may apply its own units, rounding, filter or scaling. Compare synchronized data and settings at the module, instrument and receiving software. Confirm whether the dashboard value is current and valid. A formatting difference may require a software correction, while a reference disagreement requires a measurement investigation.
Can a single comparison establish the whole measurement range?
It establishes evidence at the tested condition and point, with the limitations of that comparison. Range-wide claims require an appropriate set of points and a justified model. A zero or ambient check can miss sensitivity or nonlinearity issues elsewhere. Use the product's verification method and the application's relevant concentrations.
來源和進一步閱讀
- JCGM 200:2012, International Vocabulary of Metrology: terminology behind resolution, precision and error.
- Texas Instruments SNAA207, LMP91051 NDIR CO2 Gas Detection System: signal-chain and noise considerations.
- Sensirion SCD30 design-in guidelines: enclosure, thermal and airflow effects.
- DrägerSensor and portable instrument handbook, fifth edition: measurement-deviation discussion and technology-specific conditions.
- Murata CO2 sensor performance FAQ: manufacturer performance wording.
- How to read a CO2 monitor accuracy specification: interpreting a combined ppm and percentage allowance.





發表評論