

A TVOC number is only useful after you know what the instrument means by it. One display may report a laboratory-defined sum of identified compounds, another an estimated concentration expressed as an equivalent of a calibration gas, and a third a relative VOC Index that describes change from its own recent background. Those outputs are not interchangeable. For an indoor monitor, the most defensible first use is to identify repeatable changes, connect them to an activity or source, and check whether a practical intervention changes the pattern under comparable conditions. A generic TVOC display cannot identify a chemical or certify that a room is safe.
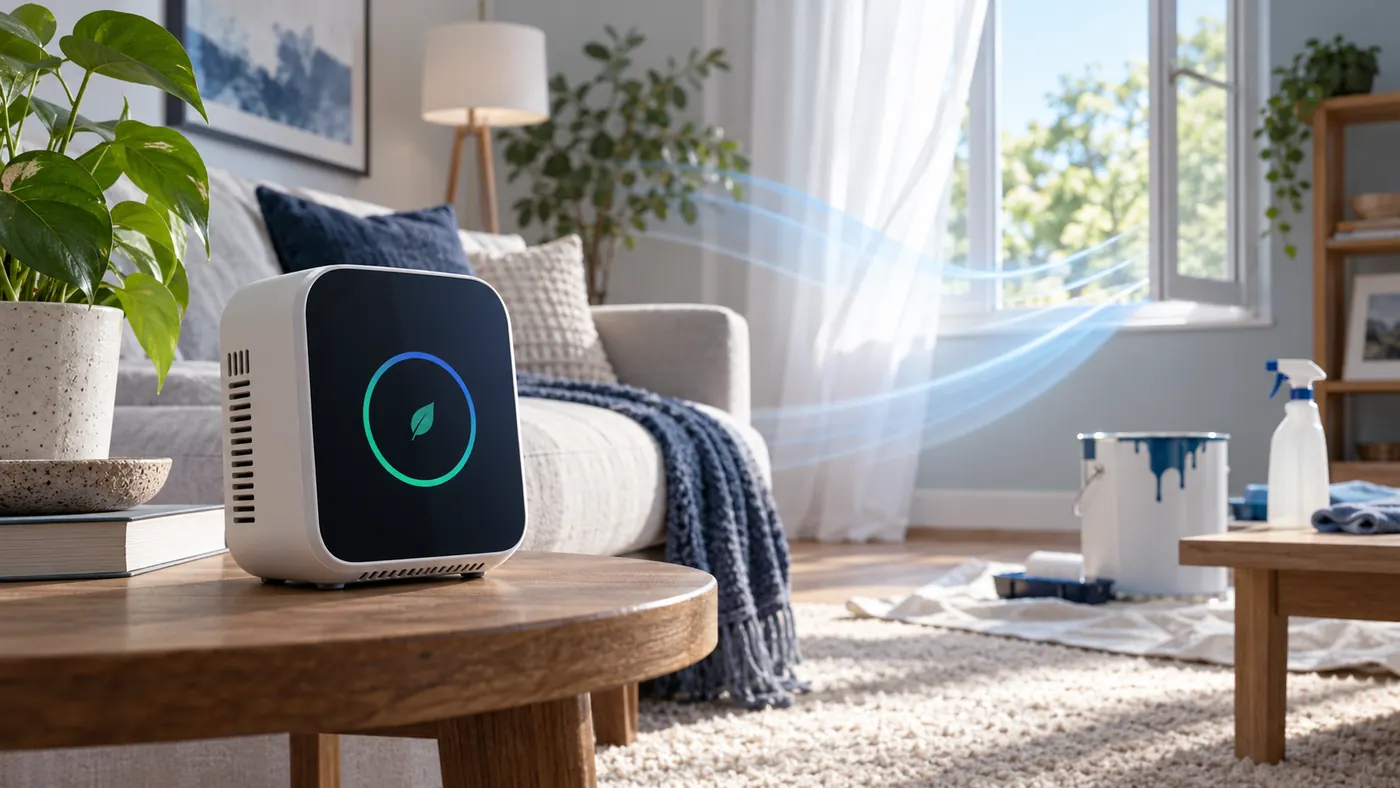

The apparent simplicity of a single number hides a chain of choices: which compounds reach the inlet, which the sensing element responds to, how firmware handles temperature and humidity, how the device establishes a baseline, and what its manufacturer chose to display. The US EPA's technical overview of VOCs explains why “total VOC” depends on the analytical approach and does not have a universal chemical or health meaning. A monitor can be useful without being a laboratory instrument, but its label must not be mistaken for a full inventory of indoor chemicals.
First identify the kind of output
Look at the unit and the manufacturer's method before interpreting a value. “TVOC,” “VOC,” “air quality,” and “index” are interface labels, not measurement methods. Even two products with the same sensor component may implement different processing and display rules. A sensor datasheet describes a component; the finished monitor also has an enclosure, inlet, filtering, algorithm, update interval and user interface.
| Display type | What the number represents | Useful comparison | What it does not prove |
|---|---|---|---|
| A specified compound concentration | A stated chemical measured by a method intended for that analyte, under stated conditions | Repeated measurements of that same analyte and method | Concentrations of other chemicals or overall indoor-air quality |
| Method-defined laboratory TVOC | A sum calculated from compounds captured and quantified within a stated analytical window and protocol | Samples collected and analyzed by the same method | Every organic compound in air or a direct health verdict |
| Reference-gas equivalent, sometimes labeled “TVOC” | An instrument response converted as though the mixture behaved like a calibration gas | Trends from the same instrument and calibration under similar conditions | The true summed mass or concentration of an unknown mixture |
| Relative VOC Index or air-quality score | A processed estimate of change or intensity relative to a device-specific baseline | Events and repeated patterns within that device's intended use | A chemical concentration or a universal threshold |
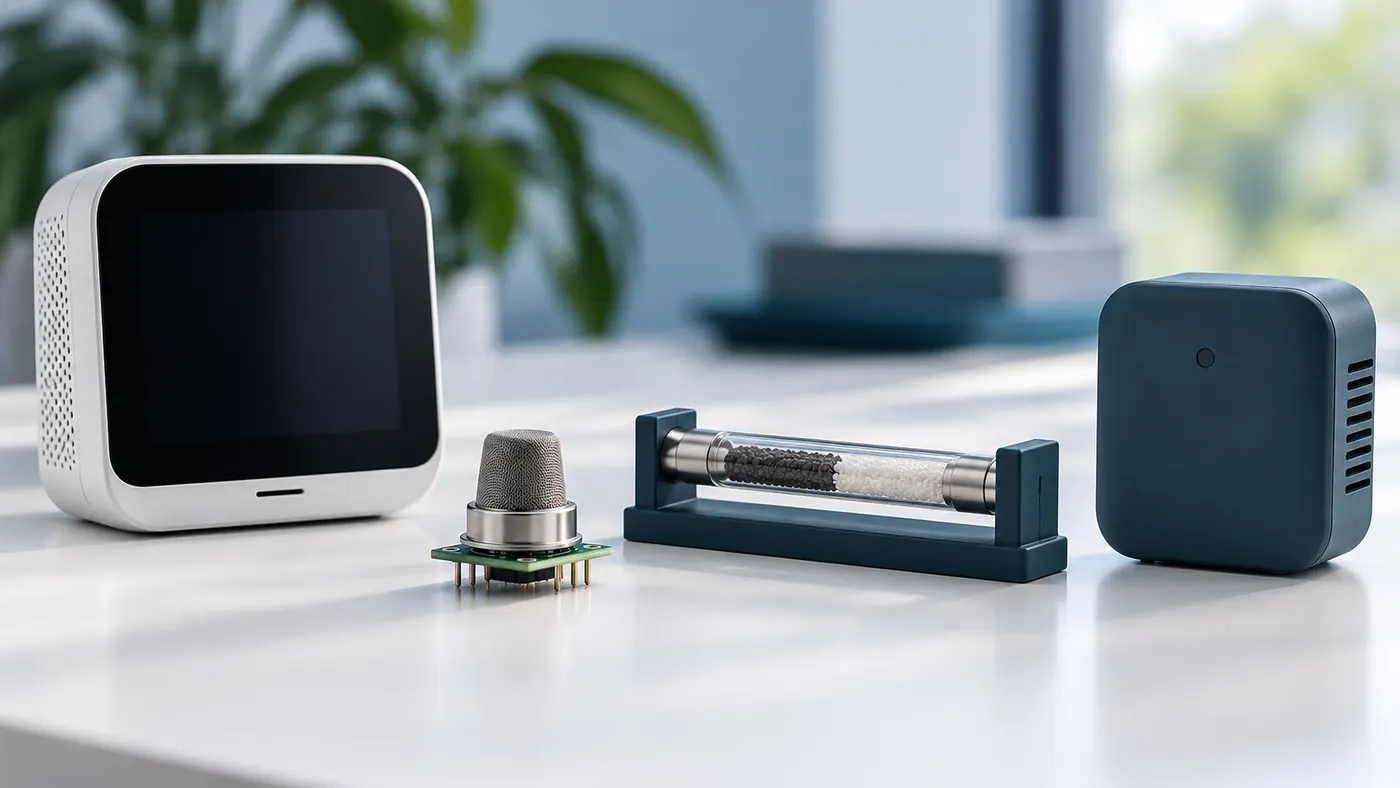
These categories can overlap in marketing language. For instance, a device may show “TVOC ppb” even though its broad-response sensor was calibrated with one reference vapor; the unit does not turn the output into a compound-resolved measurement. Conversely, a laboratory report may list a TVOC result in concentration units, but that sum is defined by its collection and analytical method. Ask what compounds and response factors were included, whether values below detection limits were treated consistently, and what sampling period the result represents. ISO 16000-6:2021 describes one established indoor-air approach using sorbent-tube sampling, thermal desorption and gas chromatography. It is a specific method, not a universal definition that every inexpensive monitor implements.
A concrete example: VOC Index is not ppb
這 Sensirion SGP40 資料表 describes a VOC Index output with a nominal range of 1–500; its algorithm uses a value of 100 to represent the sensor's average gas composition over its recent history, described by the manufacturer as the past 24 hours under its specified algorithm. This is an example of one manufacturer's algorithm, not a rule for every monitor showing an index. A reading above that baseline indicates a stronger response relative to the device's adapted history. It does 不是 mean that the air contains 100 ppb of a named compound, or that 100 is a universally safe limit. The manufacturer's VOC Index application note explains adaptation and why the history of exposure matters.
Other platforms use other scales. The 博世 BME680 資料表 specifies a gas-resistance channel; a finished product or software library may convert that signal into an IAQ score. A Bosch-derived IAQ score and Sensirion VOC Index cannot be numerically aligned just because both may be displayed between similar-looking bounds. Confirm the exact product, firmware and algorithm before interpreting a color band on the screen.
What does “total” actually include?
Indoor air holds a changing mixture of compounds from products, materials, people and outdoor infiltration. Some compounds are more volatile, some react on surfaces, and some are not captured well by a particular sensor or sampling method. “Total” therefore means “total according to a defined selection and calculation,” not a sum of all organics in the room. EPA notes that VOCs have differing chemical properties and effects; their indoor concentrations cannot be turned into one health judgment by simply adding an undifferentiated number.
Laboratory methods can provide compound-resolved information when the collection, preparation and instrument are matched to the question. A low-cost metal-oxide monitor generally responds to a mixture and reports an algorithmic estimate or index; it does not separate each ingredient of a cleaner, paint, adhesive or fragrance. A photoionization detector (PID) can provide a useful broader screening signal for many ionizable compounds, but its response depends on the gas, lamp and calibration; it likewise does not identify an unknown mixture by itself. Our VOC sensor cross-sensitivity guide explains how those technologies differ. A display that says “zero” can mean “below this system's baseline, threshold or detection capability,” rather than “no VOC molecules present.”
This matters when someone asks whether a room is “safe.” A low generic reading cannot exclude a particular hazardous compound with poor sensor response. A high generic reading does not establish that a specific hazard is present. The EPA's household VOC guidance also distinguishes product emissions and compound-specific concerns from an abstract total. If the decision is about benzene, formaldehyde or another named substance, select an analyte-specific validated method and an appropriate professional interpretation rather than substituting a generic TVOC display.
Follow the measurement chain from room to screen
A monitor does not directly “see” a room-wide concentration. Air reaches a small inlet at one location. The response of the sensing element changes; electronics convert it to a digital signal; compensation and filtering may adjust that signal; a baseline or reference calibration and software then produce a display. Each step can change the answer.
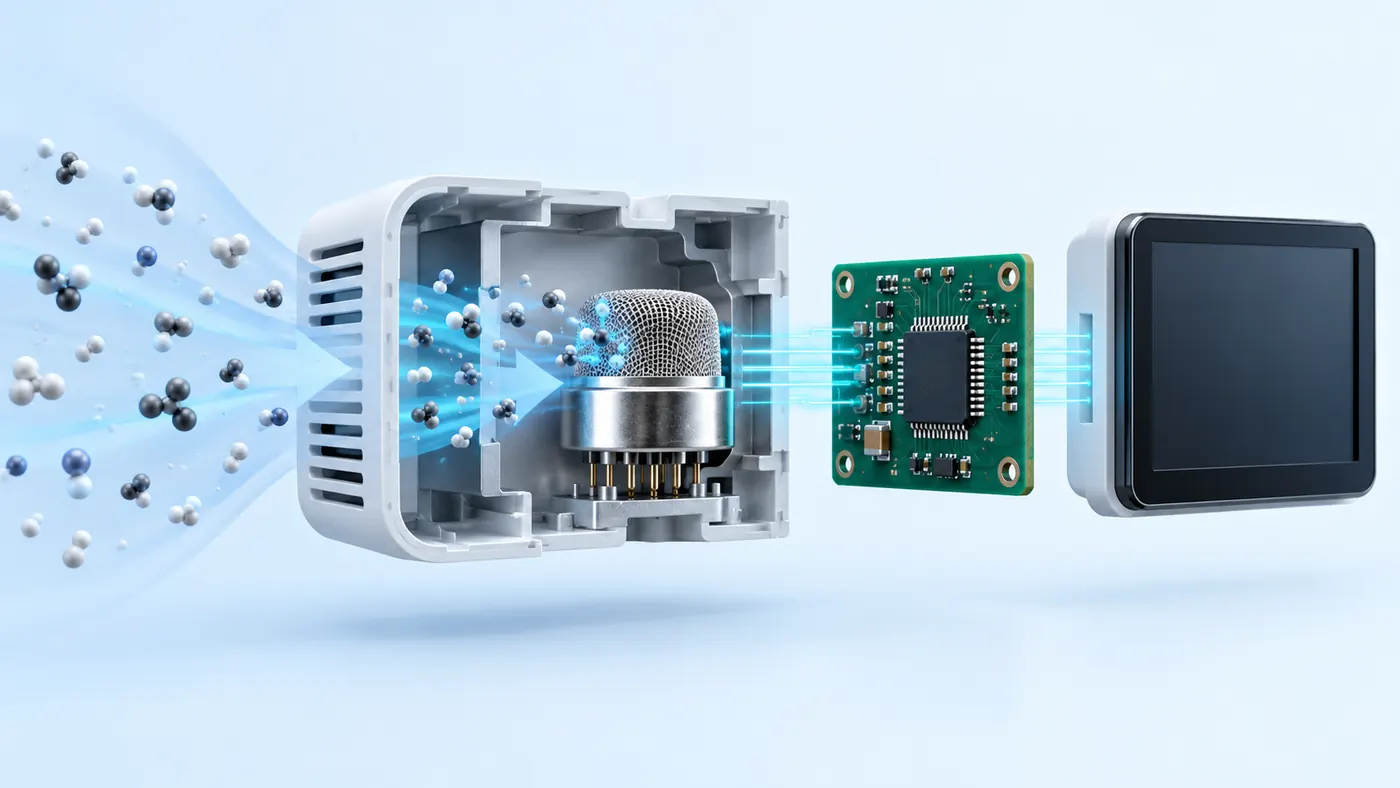
Sampling position. A monitor close to a newly opened product, printer, window or exhaust stream samples a local plume. A device on the opposite side of the room may show a smaller or later response. Both can be behaving normally. Note inlet location, ventilation state and activity before treating the difference as a faulty sensor.
Selective response. A sensing material's response differs by compound and concentration. The same numerical output can result from different mixtures; the same mixture can produce different numbers on unlike devices. This is why a reference-gas equivalent is a convention for instrument response, not a chemical analysis of the sample.
Environmental effects. Temperature and relative humidity can affect a gas-sensing element and the air sample. Some devices use measured humidity and temperature for compensation; the correction is model-specific and may have a limited operating range. The SGP40's specified compensation inputs illustrate this design choice. A rapid change in humid air can also coincide with an activity that truly releases VOCs. Avoid assuming every correlated change is purely a sensor error.
History and processing. Warm-up, averaging, adaptive baseline, firmware updates and service life can alter a displayed trend. A relative index may return toward its own baseline during a prolonged exposure because its definition includes recent history. A numerical difference between the first minutes after power-up and a later stable period may reflect algorithm behavior, not a rapid environmental improvement. Record both the event and the device state.
Display and alert rule. A manufacturer may round values, smooth spikes or put broad ranges behind colored bands. The screen may update less frequently than the raw measurement. A green label is a product decision rule; it is not evidence that all relevant pollutants were measured. For an explanation of the distinction between a gas concentration and a composite interface, see our guide to gas concentrations and air-quality scores。
Why two monitors disagree in the same room
Put two monitors side by side for an hour and their readings may still differ. First check that they are reporting the same quantity and unit. A VOC Index beside an estimated ppb value is not a failed comparison; it is a comparison between different outputs. If both say “TVOC ppb,” inspect the sensing technology, reference vapor, calibration, averaging time and algorithms. A broad-response sensor may weight the room's alcohol, fragrance and solvent mixture differently from another device.
Even identical models can disagree after different storage or exposure histories. One may have just been powered on, another adapted to the room for days. Their inlet paths, contamination state and temperature compensation may differ. The practical question is often whether both detect the same repeated event with a credible time relationship. That check can expose a gross problem, but placing devices together is not formal calibration. Calibration needs a known challenge and a procedure specified for the instrument, plus a traceable reference where the decision requires one.
Consider a room where an alcohol-based cleaner is used each evening. One device's index may jump sharply while a second device's equivalent-concentration estimate rises modestly. That pattern is compatible with different response functions and baselines; it does not establish which device is “correct” for every VOC. Document the product, time, room conditions and instruments. If a specific exposure claim matters, use a suitable sampling and analytical method. Conversely, if one device fails to react to the same controlled event repeatedly while a comparable device does, inspect its inlet, maintenance and self-diagnostics before assuming the air has changed.
A useful side-by-side check
- Identify the exact output name, unit, sensor method, firmware and data interval for both devices.
- Check warm-up and operating conditions specified by each manufacturer. Place the inlets close enough to sample similar air without blocking either one.
- Log room activities, doors/windows, temperature and humidity. Do not deliberately release a potentially harmful chemical to create a test.
- Compare timing, direction, recovery and repeatability of ordinary events rather than only absolute digits.
- If a contractual, occupational or health decision needs a concentration, use the appropriate reference method. A consumer-device side-by-side check is not that method.
Investigate a spike without over-reading it
A sharp rise is a prompt to find a cause, not a diagnosis. Start with the clock. Did someone clean, cook, paint, use a spray, open packaging, run equipment or change ventilation near the monitor? Was the device moved or restarted? Was the rise also visible in humidity or temperature? Some everyday activities can emit multiple substances, so an apparent “VOC event” and a particle event may coincide without one measurement explaining the other. EPA's indoor-monitor guidance recommends understanding what a monitor measures and its limitations before taking action based on its display.
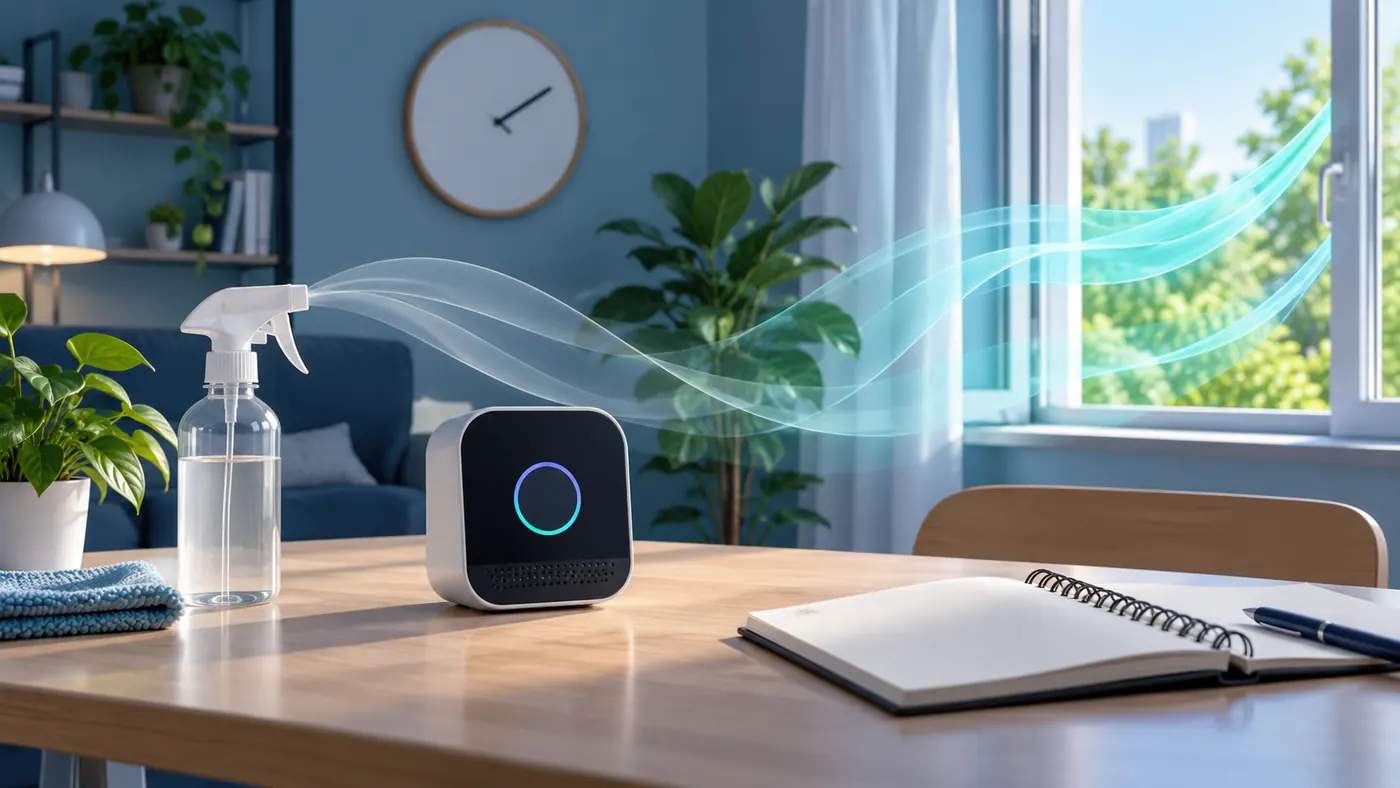
Use a short log that can be compared on another day:
| 場地 | 記錄 |
|---|---|
| Time and location | Start/end of change, device/inlet position, room and ventilation state |
| Device state | Model, displayed quantity and unit, warm-up/maintenance status |
| Activities | Cleaning, painting, cooking, printers, fragrances, occupancy and open windows |
| Conditions | Temperature, humidity and any condensation or rapid changes |
| 觀察 | Direction, duration, recurrence and whether other channels changed |
| Action and follow-up | Source control or ventilation change, then a comparable observation |
Do not infer causation from a single simultaneous event. A window opened during cleaning can bring in a different outdoor mixture while also changing temperature and airflow; several mechanisms may be plausible. Compare repeated days with similar activity and weather, or remove one suspected source through normal use and observe whether the pattern changes. If the suspected material has an obvious label or safety data sheet, consult it for the relevant chemicals and use instructions; the generic monitor cannot replace that information.
Source control is often more useful than chasing an arbitrary display target. Use products as directed, close containers, maintain appropriate ventilation and address obvious leaks or improper storage. An air cleaner designed for particles is not automatically an effective VOC control; sorbents and their capacity, placement and maintenance matter. A decline after opening a window may show dilution under that condition but cannot identify the source or quantify a particular chemical. When repeated symptoms or a known hazardous source are involved, involve a qualified indoor-environment or occupational professional using a method matched to the suspected contaminant.
What about a persistent high value?
A long elevated reading deserves a different investigation from a brief event. Confirm the device's meaning of “high” and whether an adaptive index will move its baseline. Review trend and room history, not merely the latest color. Check a product, stored chemical, recently installed material, HVAC mode or ongoing activity that persists. Compare another time or location with the same instrument, allowing for instrument stabilization and avoiding unsupported claims that the second room is a true “clean air” reference. A persistent source can coexist with a changing index because the output is relative.
The converse is equally important: a steady low reading is not proof that no action is needed. A monitor may have poor response to the chemical of concern, limited dynamic range, contamination or an inlet outside the plume. It also does not measure carbon monoxide, radon, PM₂.₅ or combustion hazards unless those channels are explicitly present and suitable. Use a dedicated detector and relevant safety procedure for an alarmed hazard. For occupied rooms, our direct CO₂ versus VOC-derived eCO₂ explanation shows why a VOC signal should not be presented as a direct ventilation measurement.
Separate a source question from an exposure question
“Where is the change coming from?” and “What concentration did a person inhale?” require different evidence. A broad monitor beside a new cabinet can help identify a recurring time pattern or a local source. It cannot reconstruct a person's dose from one point in a room. Occupants move, concentrations vary by height and airflow, and the display averages or filters the response. A high reading close to an uncapped container may be useful for locating the container but not representative of every desk. A low reading far from a source may equally be uninformative about the source zone.
An exposure investigation begins with a named concern, the relevant people and time period, likely source materials, ventilation and a measurement method suitable for the chemical. Sample duration matters: a short peak, a shift average and a long-term indoor estimate answer different questions. A handheld monitor that gives fast feedback can help locate episodes for later sampling, but its fast trace is not automatically the formal exposure result. A laboratory result still needs the sample location, collection time, analyte list and quality controls to be meaningful. If an instrument's method cannot answer the required question, report that limit explicitly rather than borrowing precision from its digital display.
The distinction also helps avoid false reassurance from “normal” dashboards. An indoor monitor measures a small set of channels. A concern about a fuel appliance, a specific solvent spill or persistent symptoms may demand action even if the generic VOC index appears stable. Conversely, a short-lived index change after ordinary cleaning does not by itself establish harmful exposure. The source history and the chemical-specific evidence determine the next step.
When comparing days, control the comparison
A meaningful before-and-after comparison needs more than two screenshots. Keep the instrument at the same inlet position, note any firmware or calibration change, and compare similar activities and ventilation states. A product used in a small closed room and the same product used with windows open are different scenarios. If one day is warm and humid while another is cool and dry, the sensor response may shift even when source strength is unchanged. Record those variables so the interpretation can be challenged later.
Do not use a single lowest reading as the “baseline” merely because it makes the later spike look large. For an adaptive index, its baseline is part of the algorithm and may change with experience. For an equivalent-concentration device, a zero or clean-air adjustment has a manufacturer-defined procedure. Instead, compare the full event: pre-event period, start, peak or plateau, recovery, and repeatability over multiple routine occurrences. State whether the result is a within-device trend or a concentration estimate. That simple discipline makes a home monitor more useful without pretending it has compound-resolved accuracy.
Read the datasheet before setting an action rule
An actionable specification should tell you more than “TVOC range.” Check the exact output definition and units. Is it a raw resistance, an index, a gas-equivalent concentration or a method-defined sum? Ask which compounds were used for characterization, which reference gas defines the scale, and what cross-sensitivities the maker has disclosed. Check the recommended operating temperature and humidity, condensation limits, warm-up, response and recovery under specified conditions, expected maintenance and available calibration. The response time of a sensor element is not automatically the response time of the finished wall-mounted monitor.
Also inspect the averaging and baseline rules. If a moving baseline changes after continuous exposure, an alert based only on a fixed index value may miss a slow source. If a display is a smoothed average, a brief release may appear later and smaller than its true peak. If data are being compared across rooms, confirm each device was configured and maintained consistently. The SGP40 datasheet and algorithm note are useful examples of the level of detail that can matter, but they must not be transplanted to a different sensor family.

| Your actual question | First useful tool | When to escalate |
|---|---|---|
| Did an ordinary activity change this room's broad VOC signal? | A consistent monitor trend plus a time-stamped activity log | If the trend persists despite source investigation or action requires a named chemical |
| Do two buildings or products have the same TVOC concentration? | A common, documented measurement method | When device algorithms or calibration gases differ; do not compare raw dashboard digits |
| Is a specific compound present at a meaningful concentration? | An analyte-specific method and competent sampling plan | Before a health, legal or occupational exposure decision |
| Has a source-control step helped? | Repeat observations with similar room use, conditions and instrument state | If results are ambiguous or the consequence of error is high |
The best question is rarely “What is a good TVOC number for every room?” It is “What exactly is this device measuring, what change am I trying to detect, and what decision will a confirmed result support?” This frames a monitor as one piece of evidence in source investigation rather than a substitute for it.
Questions readers ask
Is a TVOC reading in ppb a laboratory measurement?
Not necessarily. It may be a broad sensor's response reported as an equivalent of a calibration vapor. Read the manufacturer's method and reference gas. A laboratory analysis names its collection and analytical approach and may report individual compounds as well as a method-defined total.
Does a VOC Index of 100 mean clean air?
For the SGP40 implementation cited above, 100 represents a recent baseline under that algorithm. It is not a clean-air certificate, a concentration in ppb or a universal health threshold. Another manufacturer's index may use a different scale and history.
Why does the reading rise after cleaning even with windows open?
A cleaning product can release compounds while ventilation changes their concentration and transport. Alcohols, fragrances, humidity and the monitor's position can all influence the displayed response. Record the product, timing and ventilation state and compare repeated observations. Do not conclude that an open window failed solely from one broad-sensor number.
Can I use TVOC to test whether a room contains formaldehyde?
A generic VOC or TVOC display cannot establish or exclude formaldehyde at a meaningful concentration. Some devices have a dedicated formaldehyde channel, but its suitability still depends on the model, test conditions and interferences. If formaldehyde is the decision, use an appropriate validated method and interpretation.
Is a low TVOC reading enough to say the air is safe?
No. The output may omit important compounds or other pollutants entirely. Assess the suspected source and the decision separately; a CO alarm, dampness concern or particle event needs its own investigation. “Low” only has meaning within the stated instrument and method.
What is the simplest useful way to use a home VOC monitor?
Keep it in a representative position, learn its output type, and log recurring room activities alongside the trend. Investigate repeatable changes and address identifiable sources according to product instructions. When you need a compound identity or a consequential exposure conclusion, switch to a suitable specific method.