
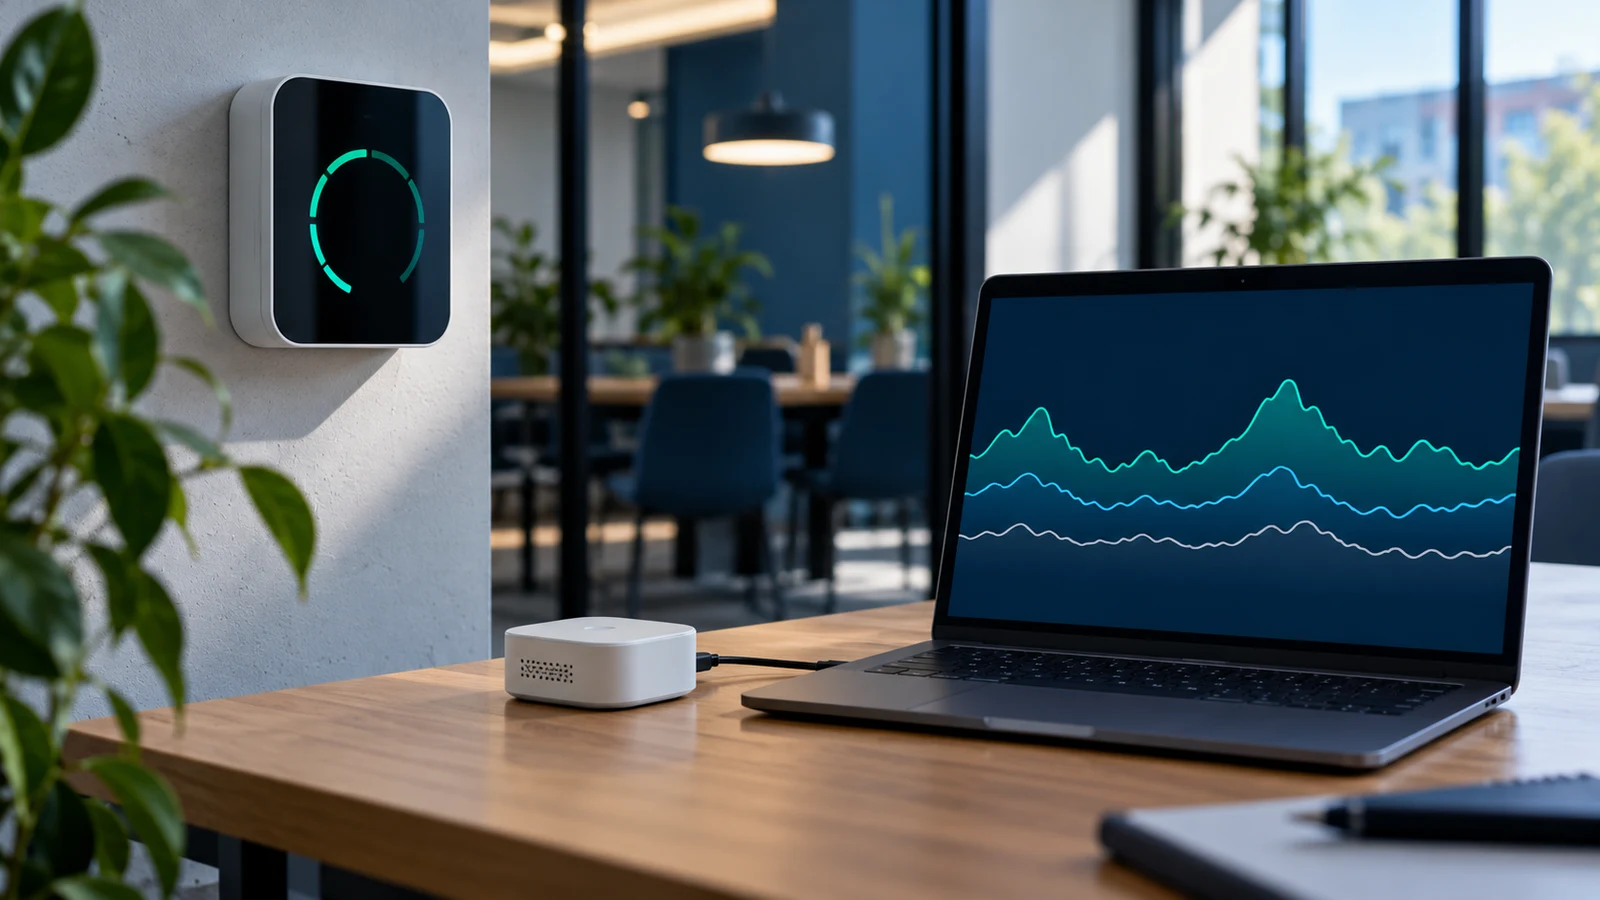
Choose a live CO₂ display when someone must see the current condition and respond locally; choose a data logger when the question depends on what happened over time. Many instruments do both, but a screen, a sensor update and a stored record are separate functions. A screen can show a current value without retaining it; a logger can preserve a useful history while offering little immediate feedback. For building control, process monitoring or alarms, verify a third path: how the finished device communicates a valid measurement and fault state to the system that acts on it.
Start with the decision. “What is the room reading right now?” can be answered by a well-placed display. “Which meeting schedule produces a repeatable rise?” needs a time-stamped series and context. “Did a brief excursion occur during a process step?” needs a sensor and record fast enough to resolve that event. Recording more points than the sensor can physically resolve adds file size, not information.
The three times that are easy to confuse
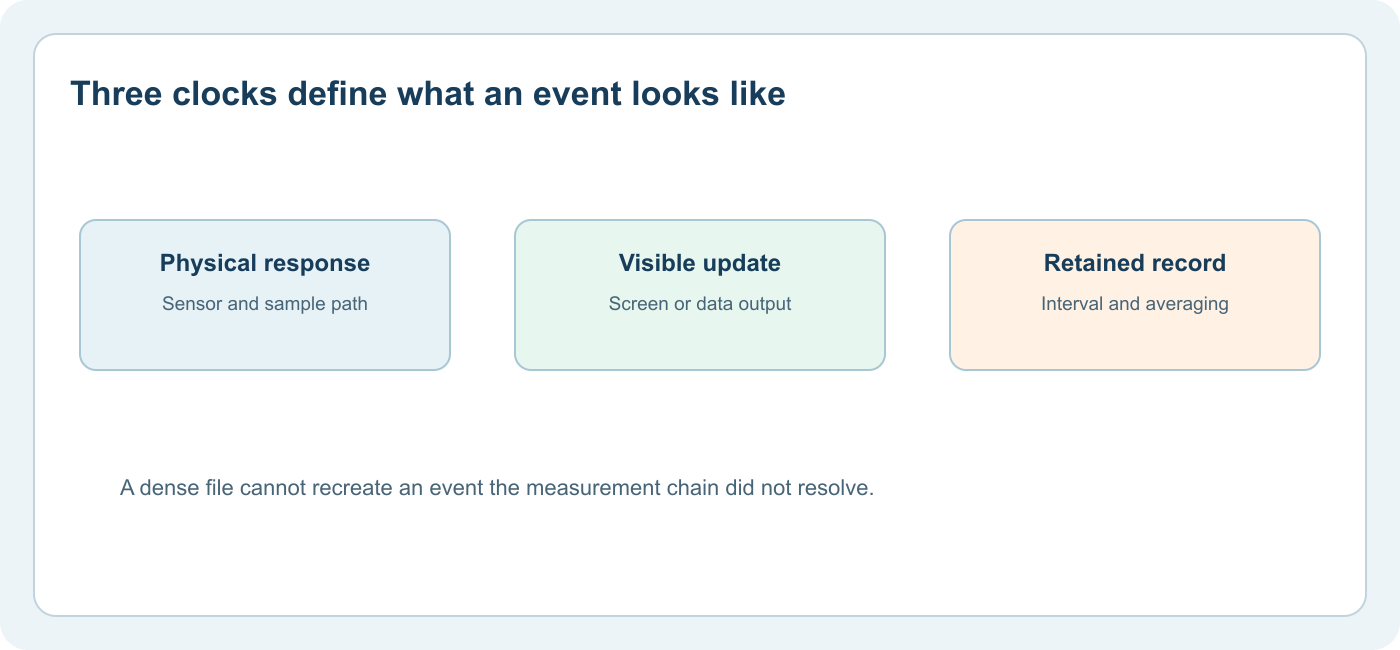
Every candidate has at least three time scales. Sensor response describes how the measurement chain reacts to a change under defined conditions. Display or communication update describes how often a new result appears or is sent. Logging interval describes how often a value is retained. They can be equal, but often are not. Processing, averaging, tubing, enclosure exchange and wireless transmission may add delays.
For a documented component example, Sensirion's SCD4x data sheet specifies response and measurement conditions for that sensor family. A finished monitor built around a sensor needs its own evaluation because airflow, filtering and software change what the user sees. As a finished-device example, Aranet's documentation describes selectable measurement intervals and a default interval for the Aranet4; these settings belong to that product, not to all CO₂ loggers. Read each instrument's manual rather than transferring one model's timing to another.
Imagine a hypothetical CO₂ change lasting two minutes. A device that stores one five-minute average may show that the period was somewhat elevated but cannot reconstruct the peak's exact shape. A device storing one-minute samples may preserve more temporal detail, provided its sensor and filtering respond quickly enough. Neither record is a substitute for a fast, appropriate alarm system if the task is immediate hazard response. This is a timing example, not a claim about a specific instrument or exposure threshold.
What a live display does well
A visible local display lets an occupant, technician or operator see a reading without opening an app or retrieving a file. It can make changes following occupancy or ventilation adjustments tangible. For this to work, the value should identify CO₂ and its unit, show when it was last refreshed, and make warming, out-of-range or fault states clear. A colored light can be useful as a prompt, but the underlying concentration and the color rule should remain accessible.
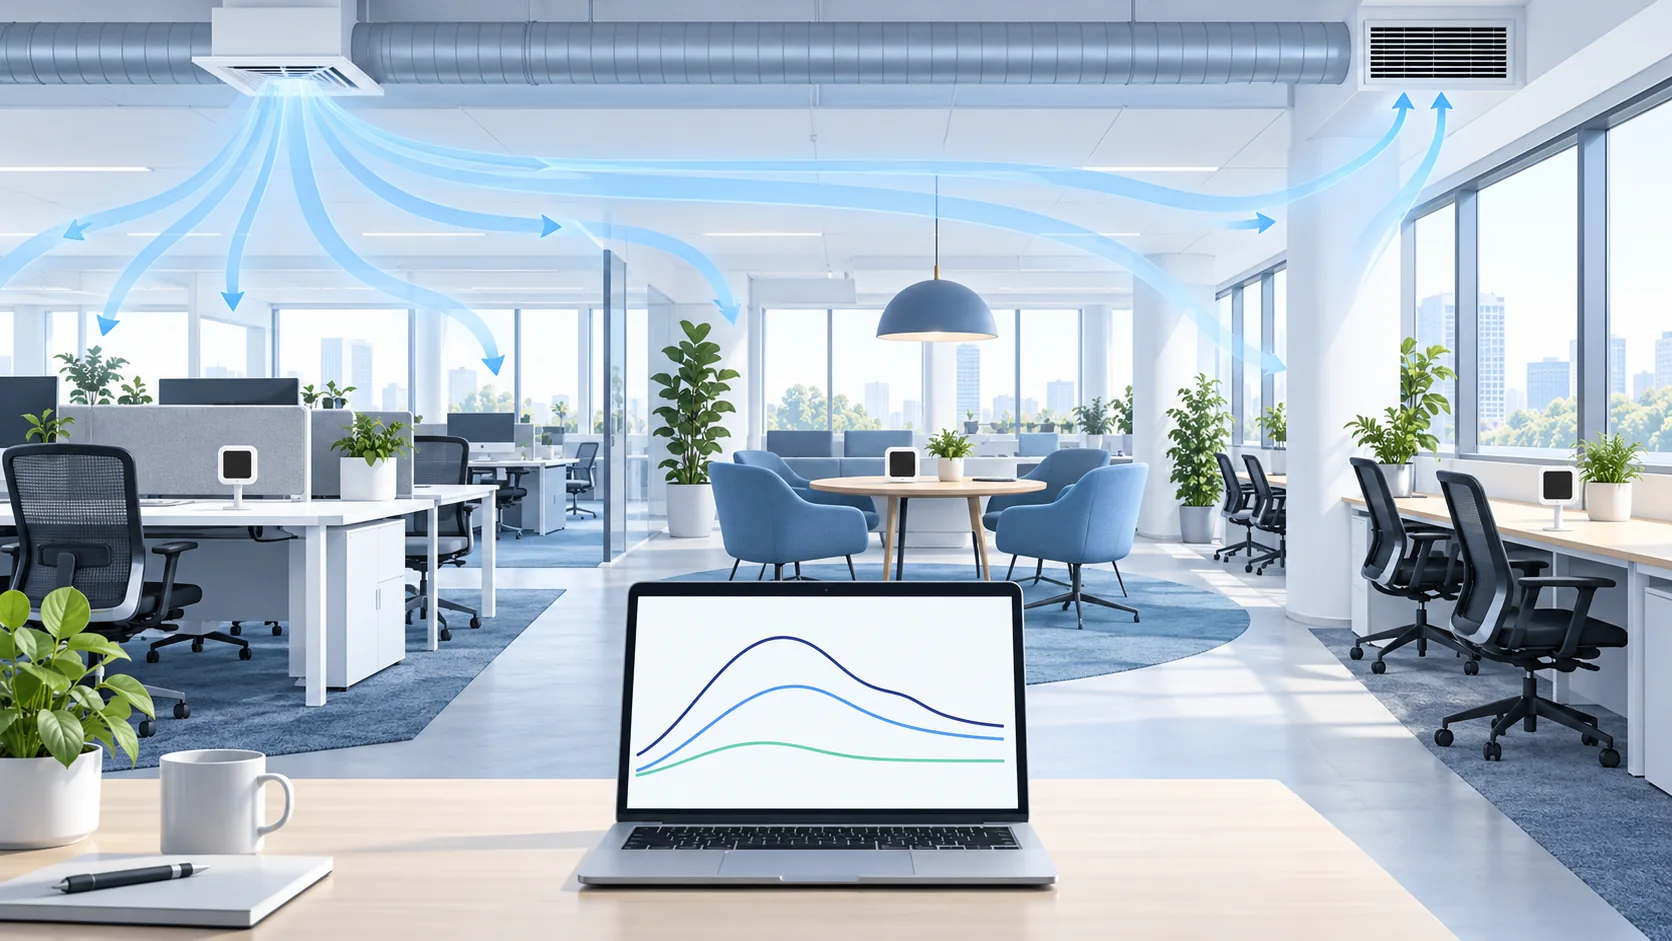
The display must also represent the right place. CDC's ventilation FAQ notes that air currents from HVAC or windows can make a fixed wall-mounted CO₂ reading unrepresentative of the occupied zone. A highly visible monitor beside a supply diffuser may be easy to see yet poor for the intended question. Placement and interpretation are part of the instrument decision, not accessories.
Local feedback does not require claiming that one value defines safe air. EPA says indoor CO₂ can inform ventilation but needs careful interpretation. ASHRAE likewise cautions against treating a fixed CO₂ number as a complete indoor-air-quality pass/fail rule. A display should support a known action and context, not imply it measures pollutants it does not detect.
What a logger makes possible
保留序列可以揭示上涨是孤立的、重复的还是与时间表相关的。它可以比较占用和空闲时间,显示通风变化的影响,并记录测量在相关时间是否实际可用。该记录需要时间戳、单位、设备标识和位置注释。如果没有这些,漂亮的图表以后可能无法解释。
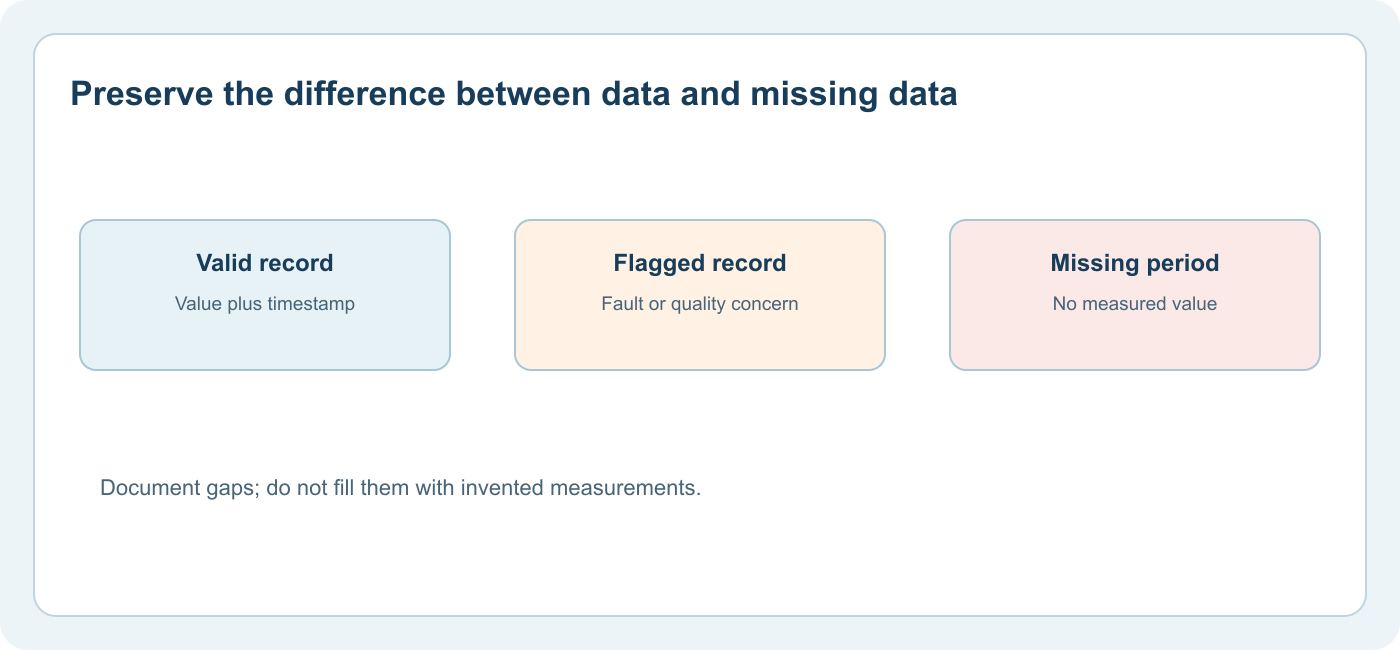
日志记录还可以进行数据质量审查。 EPA's Enhanced Air Sensor Guidebook advises users to inspect time-series plots, flag questionable values and recognize missing data. A gap caused by power loss or communication failure should remain a gap, not be silently replaced by a straight line that appears measured. For a report, note the expected number of records, the valid number, the excluded records and why they were excluded. The valid fraction matters when calculating an average.
例如,设置为一分钟间隔的记录器预计在一小时内不间断地记录 60 条记录。如果丢失了几个样本,则可用样本的平均值可能无法代表整个小时,特别是如果丢失的时间段与事件同时发生。这是算术,而不是普遍接受的标准。在解释记录之前应选择数据质量规则。 EPA's collocation tool 明确解决传感器比较中的时间对齐、较长平均值、完整性和缺失周期问题。
从事件而不是菜单中选择间隔
Write down the shortest change that matters, the longest period that must be studied and the amount of storage or transmission available. The sampling interval should be short enough to represent the meaningful change, but the sensor's own response and device averaging must be checked first. If the decision concerns occupied-room trends over a school day, a very dense raw stream may be unnecessary. If it concerns a rapid process event, a leisurely interval can erase useful detail even when the chart looks smooth.
Ask what each stored point means. Is it an instantaneous reading, a moving average, a block average or a maximum within the interval? Is the timestamp the start, midpoint or end of that interval? Does changing the device interval alter earlier stored data? Some devices do process or aggregate history when settings change, so use the exact manual. “One point per minute” without a definition of the point is not a complete data specification.
时间戳也需要类似的关注。记录时区、相关夏令时行为、时钟同步方法以及设备处理重启的方式。在多设备研究中,在比较通道之前对齐时钟。明显先于占用率变化的二氧化碳峰值可能只是时钟不匹配。无线仪表板可能会显示上传时间而不是测量时间;验证导出的是哪一个。
数据的保留、导出和所有权
根据实际记录格式计算保留率
A useful capacity estimate starts with the number of channels, records per hour, expected deployment duration and bytes per exported record. At a one-minute interval, one channel produces 60 time points per hour before timestamps, status fields and file overhead are added. More frequent sampling multiplies the record count; extra channels and metadata enlarge each record. The device may compress, overwrite or aggregate older history, so a simple calculation is only a planning check. Ask the vendor for the documented retention behavior at the chosen interval and channel configuration. If the study must survive a week without contact, test that recovery path before deployment.
保留与上传不同。设备可以在网络离线时在本地保存测量结果并稍后进行同步,否则可能会丢失未传输的样本。 “云仪表板可用”没有回答适用哪种行为。通过短暂的受控断开确认数据路由,然后检查恢复的记录是否带有原始测量时间戳或仅带有上传时间。
“存储数据”可以指设备上的历史记录、手机应用程序缓存、云帐户或可下载文件。指定记录保持可用的时间、旧值是否被覆盖、网络中断时会发生什么情况,以及导出是否保留时间戳和质量状态。询问是否需要订阅、网关或专有帐户。如果学校或工作场所正在收集数据,请决定谁可以查看或删除数据以及如何记录安装位置。
还要检查电源。电池寿命可能会因测量频率、背光、无线传输和环境条件而变化。具有连续外部电源的壁式显示器可能更容易观察,而电池记录器更容易临时放置。传感器的最佳位置应主导部署;然后应该围绕该位置设计电力和通信,而不是强迫放置在不具有代表性的位置。
当记录多个参数时,保留每个通道的名称和状态。 CO2 值、PM2.₅ 估计值、相对湿度和 VOC 指数无法合并到一个未标记的“空气质量”时间序列中。我们的 单一气体与多参数比较 解释逐个渠道的证据;这 注意力与分数指南 解释了为什么分数需要记录的映射方法。
常见任务的选择表
| 任务 | 优先事项 | 通常有用的配置 | 使用前验证 |
|---|---|---|---|
| 居住者看到当前的房间趋势 | 清晰的、当前的本地反馈 | 显示清晰的 CO2 值和状态 | 放置、更新年龄和颜色的解释 |
| Compare a week's meeting patterns | 可比时间序列 | 记录仪,带或不带显示屏 | 时钟、间隔、导出、数据间隙、占用说明 |
| 调试通风控制 | 可靠的系统输入和趋势 | 具有定义的控制输出和记录的仪器 | 设备级响应、故障状态、集成和校准 |
| 调查短期流程变更 | 事件时间安排和样本适用性 | 为本次活动选择的仪器/记录仪 | 传感器响应、采样路径、平均值和偏移范围 |
| Immediate safety warning | Appropriate safety function | Purpose-designed system for the application | Site risk assessment, applicable rules, alarm behavior and maintenance |
The table does not rank products. It shows which evidence the decision needs. A single device can meet more than one row if its documented functions do; a device merely showing the relevant icon may not.
Compare the finished device, not only its sensor chip
A component specification is a starting point. The finished display or logger adds a housing, gas inlet, supply, clock, storage, interface and possibly a cloud service. Ask for the finished product's stated response, fault indications and environmental ratings. If the application uses an external probe or sample line, specify that arrangement in the test. Our sensor-module versus complete-monitor guide details this boundary.
For long-term work, define a verification routine. How is the device checked before and after deployment? What calibration or adjustment procedure is supported, and under what gas and environmental conditions? Vaisala's GMP252 guide illustrates the importance of device-specific compensation and calibration settings. Do not assume that a logged history remains accurate indefinitely just because the initial factory calibration was documented.
这 二氧化碳要求工作表 provides a place to state range, sample location, timing, fault behavior and acceptance evidence. Complete it before deciding whether the best deliverable is a screen, a CSV file, a building-system signal or a combination.
常见问题
If a monitor has a graph in its app, is it a suitable data logger?
Possibly, but check retention, export, timestamp meaning, missing-data behavior, clock handling and whether data remain available without the app or account. A graph alone does not establish that the record can support your decision.
Does a one-second logging interval give one-second CO₂ response?
No. Logging frequency and physical response are different. Sensor response, sampling path and smoothing can be slower than the storage interval, in which case many records may contain highly correlated or filtered values.
Should I display the latest value or an average?
That depends on the decision and noise of the measurement. An average can make a trend clearer but can delay or hide short changes. Label the quantity and averaging period, and do not use a smoothed display as proof that a short event did not occur.
Can historical CO₂ alone prove that a building met every air-quality requirement?
No. It documents one measured quantity at particular locations and times, subject to instrument and data-quality limits. Other pollutants and environmental conditions require their own evidence, and CO₂ interpretation depends on occupancy, ventilation and sampling context.
来源
- 美国 EPA,增强型空气传感器指南 — monitoring design and data handling.
- US EPA, Collocation Macro Analysis Tool — time alignment, averaging and missing records.
- Sensirion、SCD4x 数据表 — component response example.
- Aranet, Aranet4 default settings — example finished-device measurement interval.
- CDC/NIOSH,通风常见问题解答 — fixed-monitor placement context.



评论 (1)
[…] change, perform a side-by-side check before treating their small numerical differences as real. The logger-versus-display guide helps select a product that can preserve the event history you […]