
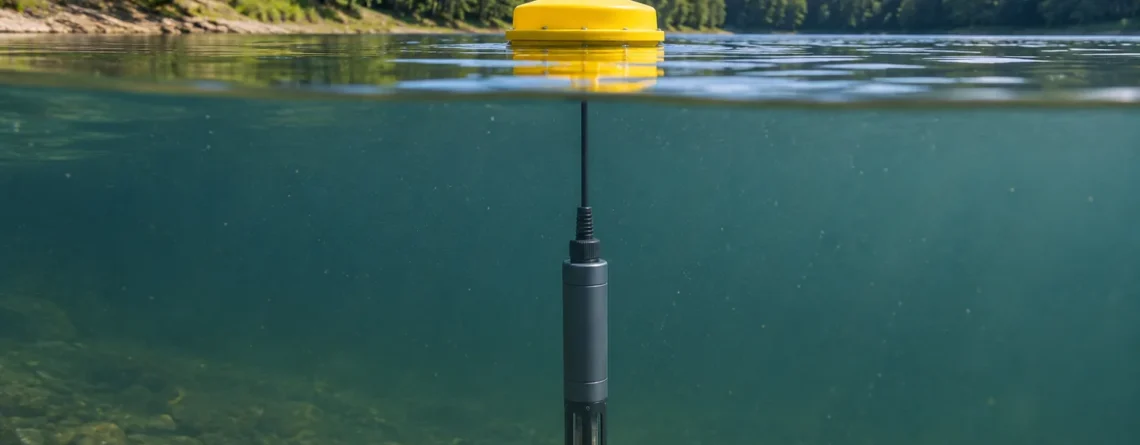
Ein Chlorophyll-Fluoreszenzsensor strahlt Licht in ein kleines Wasservolumen und misst das rote Licht, das von Pigmenten in schwebenden Algen und Cyanobakterien emittiert wird. Die Antwort ist ein optischer Proxy. Bei stabilen Bedingungen kann es anzeigen, wann pigmenthaltige Partikel am Sensor zunehmen oder abnehmen. Mit gepaarten Wasserproben kann festgestellt werden, wie gut die Antwort die Chlorophyll-Konzentration an einem bestimmten Standort einschätzt. Die Stärke dieser Beziehung hängt vom Wasser, den Organismen und dem Licht ab, dem sie ausgesetzt waren.
Eine Station kann mittags einen deutlichen Abfall der Fluoreszenz registrieren, selbst wenn eine Laborprobe nahezu die gleiche Chlorophyll-a-Konzentration aufweist wie am Morgen. Bei einer anderen Station könnte die Fluoreszenz sinken, weil die Sonde unter eine algenreiche Schicht gerutscht ist. Die Kurven können ähnlich aussehen, die Karos sind jedoch unterschiedlich. Im ersten Fall vergleichen Sie die Messwerte mit der Lichteinwirkung und dem extrahierten Pigment. Im zweiten Schritt bestätigen Sie die Tiefe und messen oberhalb und unterhalb der Sonde.
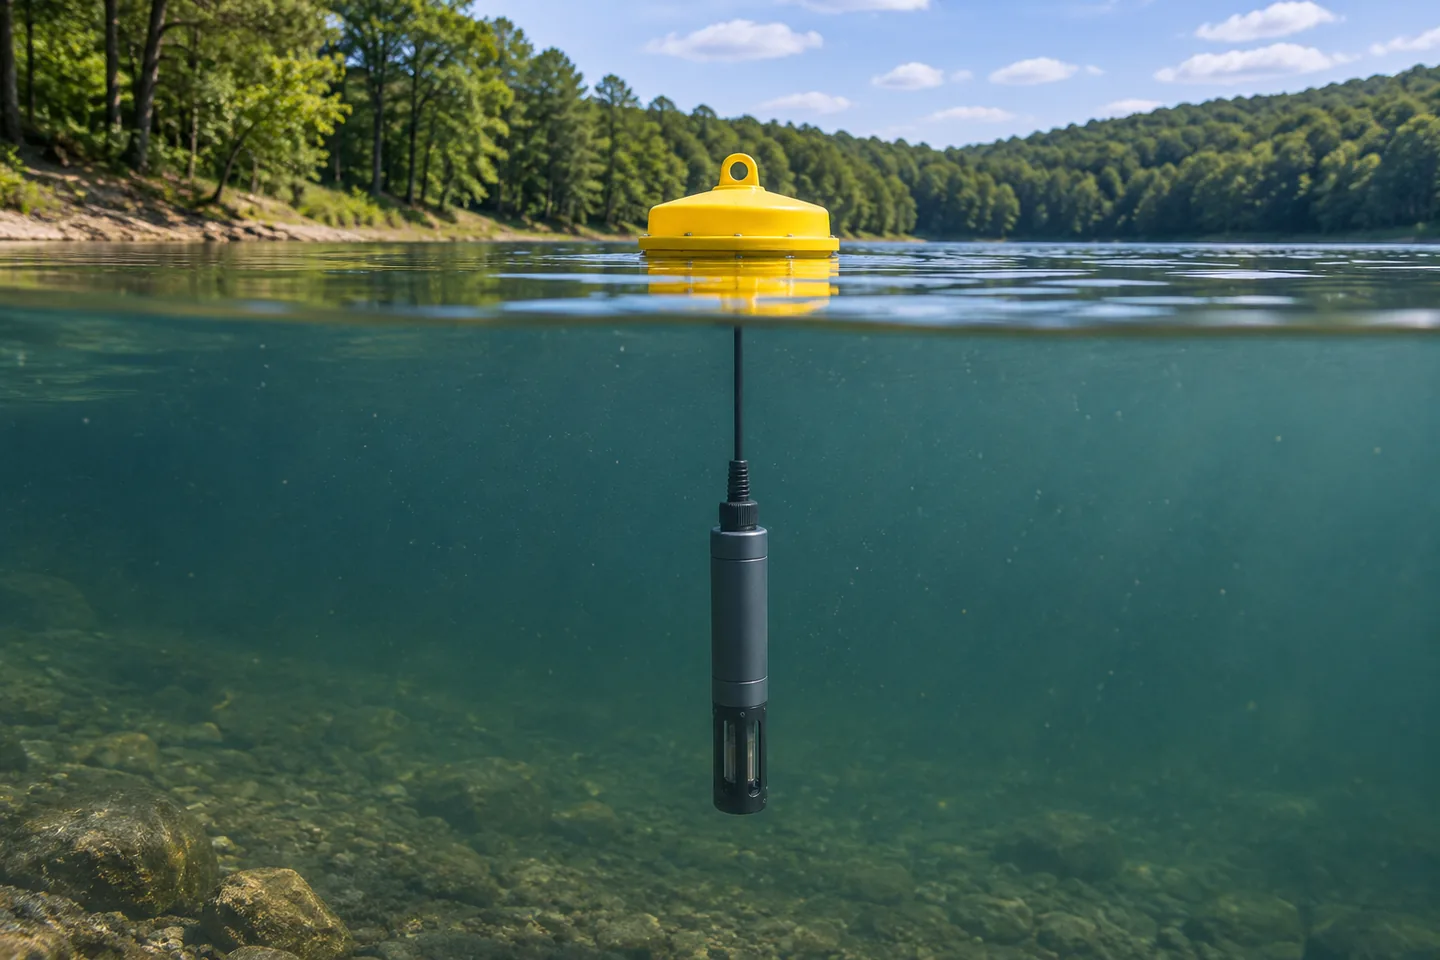
Eine eingetauchte Sonde misst das Wasser um ihren optischen Kopf. Eine Bojenaufzeichnung kann die Bedingungen in einer Tiefe beschreiben, während das Reservoir vertikal und horizontal variiert.
Was der Sensor tatsächlich misst
Ein Feldfluorometer verfügt über eine Lichtquelle, typischerweise eine LED, und einen Detektor hinter einem optischen Filter. Die LED sendet Anregungslicht durch ein Fenster ins Wasser. Chlorophyll absorbiert einen Teil dieses Lichts. Ein kleiner Teil der absorbierten Energie kommt als Fluoreszenz bei längeren Wellenlängen im roten Teil des Spektrums zurück. Der Detektor empfängt einen Bruchteil dieser Emission. Das optische Design trägt dazu bei, es vom reflektierten Anregungslicht und anderem Licht, das das Instrument erreicht, zu trennen.
Bei dieser Messung sind eine blaue Anregungsbande und eine rote Emissionsbande üblich. USGS listet eine EXO-Konfiguration bei 470-nm-Anregung und 685-nm-Emission und eine Wetstar-Konfiguration bei 460-nm-Anregung und 695-nm-Emission auf. Das sind Beispiele für bestimmte Instrumente. Unterschiede in Bandpass, Geometrie, Verstärkung und Kalibrierung können die relative Reaktion verändern, insbesondere wenn Instrumente auf eine sich ändernde Mischung von Organismen treffen. Sehen USGS-Feldtechniken für Algenpigmentfluoreszenz, Tabelle 3.
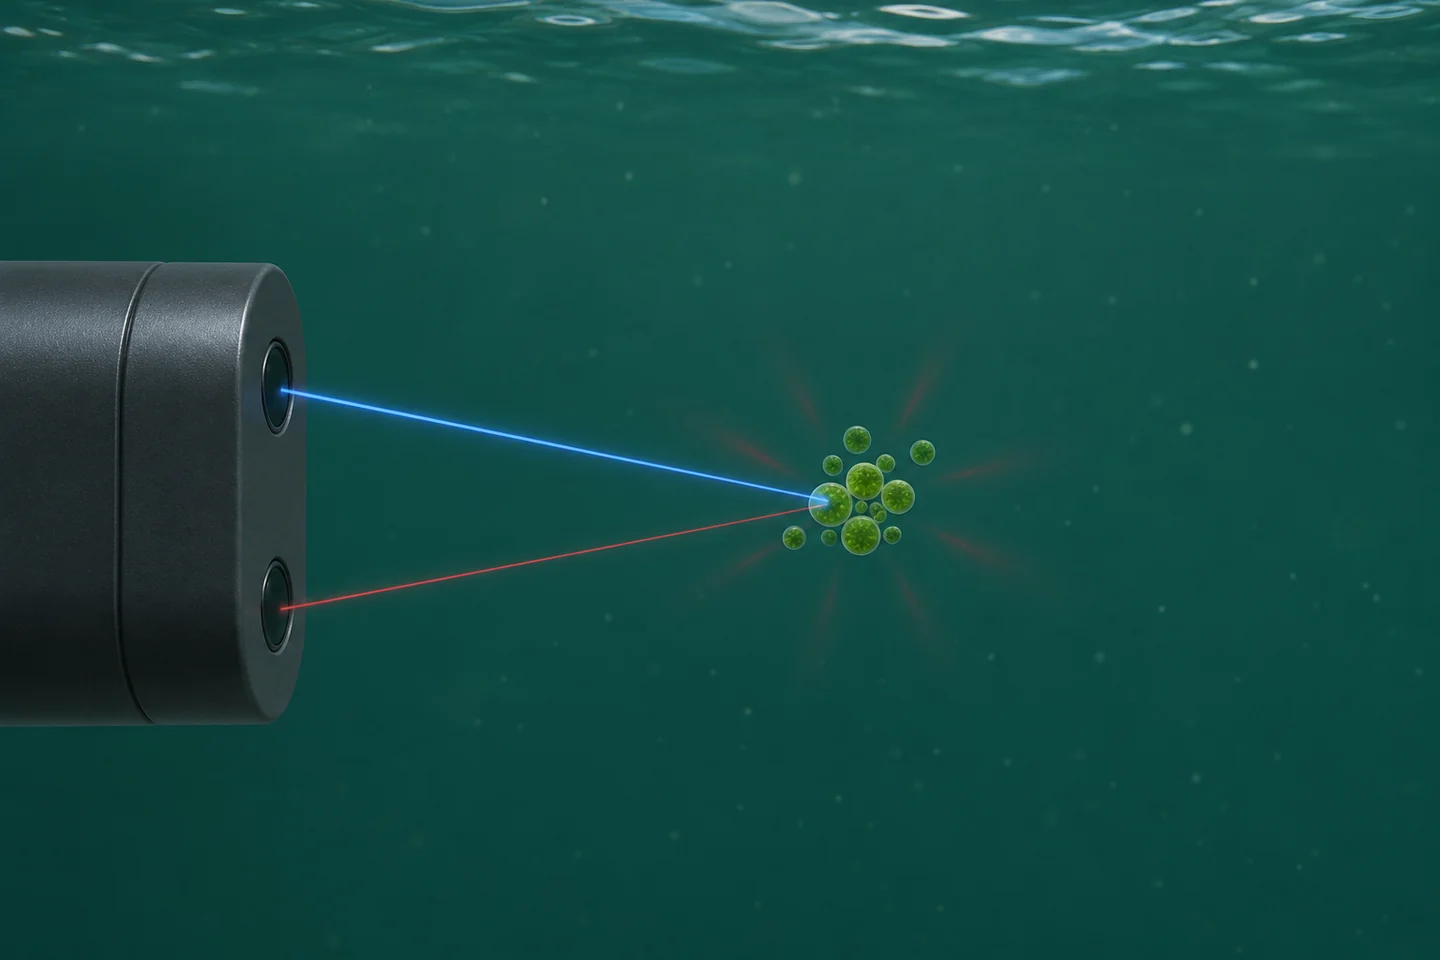
Blaues Licht regt Pigmente im Wasser an. Der rote Pfad zeigt den kleinen Anteil der vom Detektor gesammelten Emission. Die Zeichnung vereinfacht die optische Geometrie und das entnommene Wasservolumen.
Das Instrument meldet üblicherweise Zählwerte, relative Fluoreszenzeinheiten (RFU) oder einen als Chlorophyll skalierten Messwert in Mikrogramm pro Liter (µg/L). Counts und RFU sind Instrumentenreaktionsmaße. Schauen Sie im Handbuch nach, um die Skalierungs-, Mittelungs- und Verstärkungskonventionen zu erfahren. Ein Wert von 20 RFU bei einem Modell kann bei einem anderen Modell einer anderen optischen Reaktion entsprechen. Sogar Ersatzsensoren desselben Modells verdienen eine Überlappungsprüfung, bevor Sie ihre Datensätze zusammenführen.
A fluorometer can also display a concentration equivalent using a factory or user calibration. Its units look like the units on a laboratory report, but the quantities are obtained in different ways. The probe observes intact particles and cells in water. The laboratory measures pigment recovered from a known volume using a specified analytical method. A documented comparison can show whether the sensor's concentration scale is accurate enough under field conditions. The Turner Designs AquaFluor-Handbuch beschreibt diese als separate Betriebsmodi und erörtert den Vergleich einer Reaktion im Wasser mit extrahiertem Chlorophyll.
Chlorophyll, Biomasse, Arten und Toxine beantworten unterschiedliche Fragen
Eine Chlorophyllkonzentration ist die Masse dieses Pigments pro Volumen Wasser. Unter Algenbiomasse versteht man die Menge an Algenmaterial. Programme können verwandte Größen wie Zellbiovolumen, Zellhäufigkeit oder Masse melden, die mithilfe einer definierten Methode geschätzt werden. Chlorophyll a wird häufig als Indikator für die Biomasse des Phytoplanktons verwendet, da photosynthetische Organismen das Pigment enthalten. Die Menge pro Zelle oder pro Biomasseeinheit kann sich je nach Organismustyp und Wachstumsbedingungen ändern. Selbst ein Chlorophyll-Laborergebnis benötigt daher einen ökologischen Kontext, wenn man es als Biomasse interpretiert.
Einige Sonden fügen einen Kanal für Phycocyanin (PC) oder Phycoerythrin (PE) hinzu. Diese Zusatzpigmente können das Screening für bestimmte Gruppen verbessern, wenn das Instrument und die lokale Gemeinschaft den Vergleich unterstützen. Ein Phycocyanin-Kanal ist häufig für das Screening von Süßwasser-Cyanobakterien nützlich. Seine Reaktion variiert auch je nach Organismus, optischen Interferenzen und physiologischen Bedingungen. Ein Anstieg auf diesem Kanal kann die Entnahme einer Probe zur Identifizierung rechtfertigen. Ein Kanalverhältnis kann sich auch ändern, wenn Licht und Gemeinschaftszusammensetzung die beiden Signale unterschiedlich beeinflussen. Interpretieren Sie es daher im Rahmen einer lokal getesteten Verwendung.
| Überwachungsfrage | Zu verwendende Messung | Wie ein Feldfluorometer helfen kann |
|---|---|---|
| Wann hat sich das lokale Pigmentsignal verändert? | Qualitätskontrollierte RFU oder Zählungen aus einem dokumentierten Setup | Kontinuierliche Aufzeichnungen können zeigen, wann eine Änderung begonnen hat und wann eine Probe entnommen werden muss. |
| Wie viele Mikrogramm Chlorophyll a waren pro Liter vorhanden? | Extrahiertes Chlorophyll nach einer definierten Labormethode oder einer validierten standortspezifischen Schätzung | Eine getestete Beziehung kann die Laboraufzeichnung zwischen paarweisen Besuchen verlängern. |
| Wie viel Algenmaterial bzw. wie viele Zellen waren vorhanden? | Eine zur Fragestellung passende Biomasse-, Biovolumen- oder Zellzählmethode | Chlorophyll kann als Indikator für die relative Biomasse dienen, wenn Pigmentgehalt und -zusammensetzung ausreichend stabil sind. |
| Welche Organismen sind vorhanden? | Mikroskopie oder eine geeignete taxonomische oder molekulare Methode | Zusätzliche Pigmentveränderungen können dabei helfen, eine Probe für die Identifizierung zu priorisieren. |
| Welche Giftstoffe sind vorhanden und in welcher Konzentration? | Toxinspezifische Analyse mit einer für Wasser und Analyten geeigneten Methode | Eine optische Veränderung kann eine Probe veranlassen. Die Toxinkonzentration ergibt sich aus der Toxinmethode. |
For example, EPA Method 546 measures total microcystins and nodularins in drinking and ambient waters. Different analytes can require different assays. For a recreational or drinking-water program, follow the program's sampling and decision procedure for toxin questions. A station's chlorophyll trace is valuable for finding times to investigate. See EPA-Methoden zur schädlichen Algenblüte.
Warum sich das Signal ändert, wenn die Pigmentkonzentration konstant bleibt
Denken Sie an drei Teile der Messung. Erstens kann sich die Pigmentmenge im von der Sonde gemessenen Wasser ändern. Zweitens kann die gleiche Menge Pigment eine unterschiedliche Menge an rotem Licht abgeben. Drittens kann ein unterschiedlicher Anteil des Lichts die Zellen erreichen oder zum Detektor zurückkehren. Beginnen Sie mit diesen Möglichkeiten, wenn Sie eine Veränderung feststellen, und suchen Sie dann nach unabhängigen Beweisen.
Helles Licht und nichtphotochemische Löschung
Under strong light, photosynthetic organisms can dissipate more absorbed energy as heat. The fluorescence yield can fall, which means the probe receives less red light per unit pigment. This process is called nonphotochemical quenching. The organisms' light exposure before the reading matters, so readings at similar light levels in the morning and afternoon can behave differently.
A controlled study exposed cultures of a green alga and a cyanobacterium to a simulated daily light cycle and observed suppression of pigment fluorescence across three commercial probes. The study also found that suppression could persist during declining light. The effect was measured under particular organism and light conditions. At a field station, a repeating midday dip and dusk rebound is a reason to compare with local light and extracted pigment. A correction from another site or instrument may erase genuine changes. See the original light-induced quenching study.
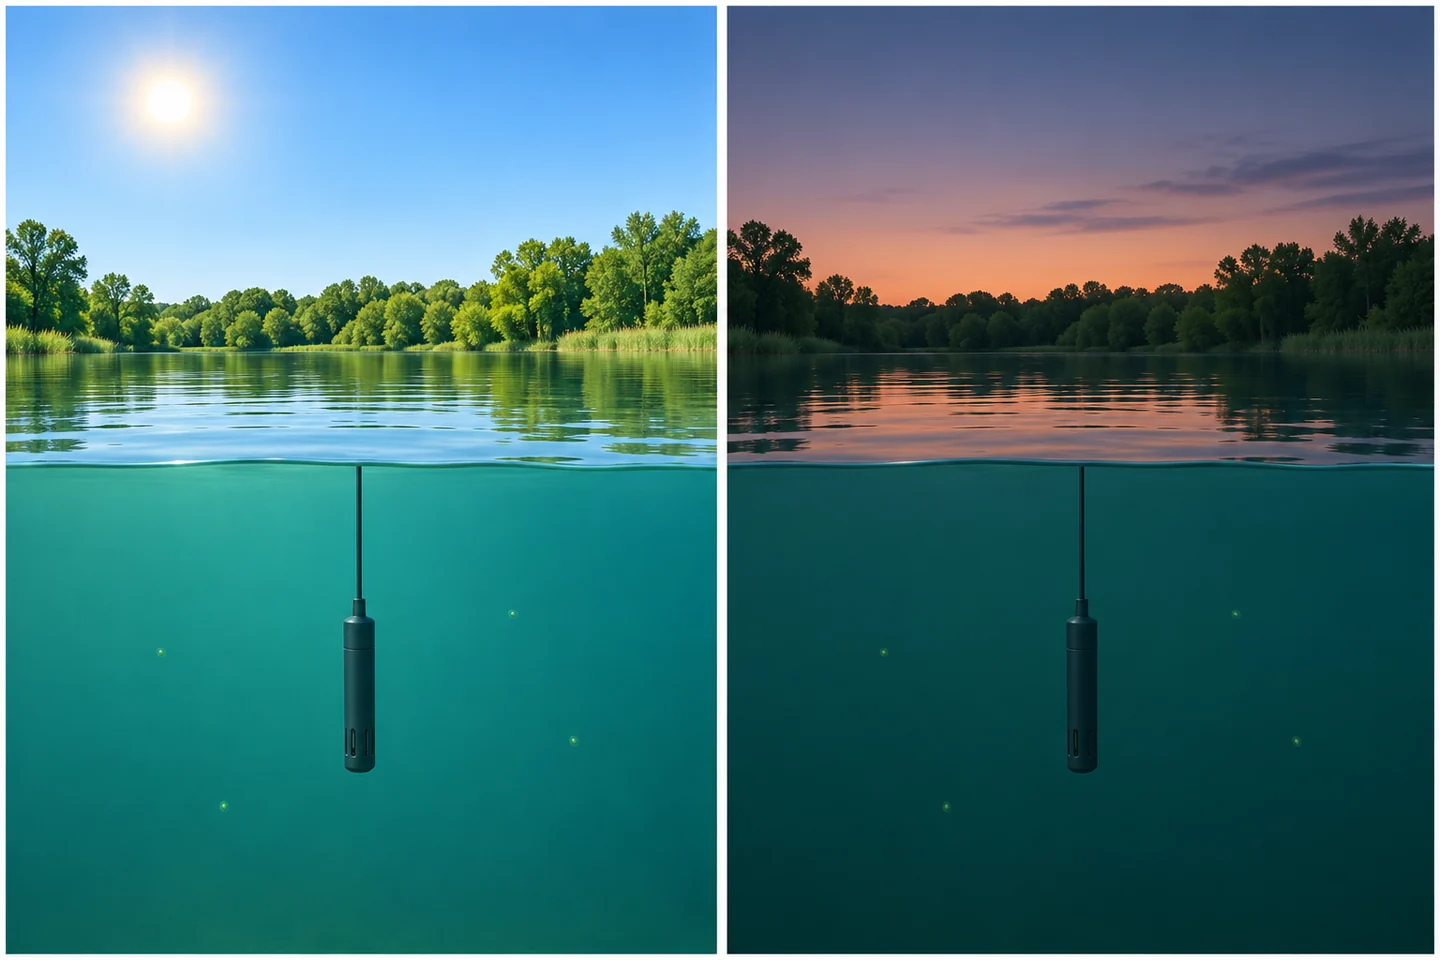
Light exposure can change fluorescence yield even when pigment abundance is steady. Changes in depth, mixing and cell distribution can also affect a real station's daily pattern.
For a fixed shallow station, log light or available indicators such as local solar conditions, time, cloud cover and depth. Compare matched laboratory samples across different light conditions if daytime estimates matter. For a profiler, compare the same depths where possible and remember that light and community composition may both change down the water column. A consistent after-dark window can improve comparability for some trend questions. It also selects a different period of the biological cycle, when buoyant organisms may have moved. Label the time window in any derived record.
Particles, color, bubbles and temperature
Suspended solids and colored dissolved material can absorb or scatter excitation light before it reaches pigments, or affect the emitted light before it reaches the detector. Depending on the instrument and the water, scatter or fluorescence from other substances can also contribute to the detected signal. During a runoff event, the sensor response may be altered even as flow carries a different algal population past the probe. A turbidity channel helps flag when that change in optical conditions occurred. To interpret its own units and measurement conditions, see how water turbidity sensors report NTU and FNU.
Bubbles can intermittently cover an optical window or change how light is scattered. Check for them downstream of aeration, near a pump inlet, or at a high point in a bypass. Temperature can affect the instrument's electronics and the fluorescence response of the sample through different mechanisms. Ask which of these the instrument compensates for. A correction built into a device may also have a defined operating range or be specific to a calibration standard. Keep the measured water temperature with the pigment record.
At the high end, a flat trace may mean the output reached its maximum, gain changed, or the detector response departed from linearity. At the low end, small shifts around the blank can be large relative to the signal of interest. Logging more decimals leaves that limitation intact. Record over-range flags and gain changes so that a later reviewer can distinguish a plausible plateau from a scale limit.
| Pattern in the record | Plausible explanations | Field check that narrows the cause |
|---|---|---|
| Midday dip and evening recovery on clear days | Quenching, vertical movement or changing water mass | Compare light, probe depth and extracted pigment across the pattern. Take a short depth profile where stratification is plausible. |
| Shift during runoff or resuspension | Attenuation, scattering, dissolved color or actual pigment transport | Check turbidity and water color, then collect a matched grab while the changed water is present. |
| Brief irregular jumps near pump cycling | Bubbles, flow-cell filling or a real transient slug | Match timestamps to pump and flow records. Inspect the cell and take a paired reading after flow stabilizes. |
| Slow drift followed by a step at service | Fouled optics, instrument drift, or a changed depth or orientation during service | Record as-found condition and positions. Compare before and after cleaning under stable conditions, then verify with a reference. |
| Repeated readings at the same upper limit | Clipping, a data logger limit, or genuine persistence | Compare raw output with the configured range and range flags. Use a suitable range or collect a lab sample for the event. |
| Gradual increase with clean optics and otherwise stable conditions | More pigment, higher fluorescence yield or a changing organism mixture | Collect same-depth pigment samples and, where composition matters, obtain cell or taxonomy observations. |
Install the probe where it sees the water you want to describe
Decide which water the record represents before selecting a mounting point. A probe just below the surface can serve as an early warning at that depth. A probe near an intake can answer what water is approaching the intake. A depth profile can find an algae-rich layer that a fixed station never sees. In each case the probe's small optical volume represents a larger area only to the extent that the water around it is representative.
For an immersed sonde, keep the optical head below the lowest expected water level and away from the bed, structures or reflective surfaces according to the manufacturer's clearance guidance. Note what the mounting depth is referenced to. A fixed probe attached to a pier can sit deeper below the surface after a rise in water level. A floating mount can maintain a nearly constant depth below the surface while moving relative to the bed or intake. In either arrangement document installation height and the actual depth when taking validation samples.
A bypass places the sensor in a flow cell for easier access. Check whether the intake samples the intended layer and whether the water arrives with bubbles, settled particles or retained material in the line. Maintain the manufacturer's flow and pressure conditions. Keep the flow path short enough for the intended time resolution and record changes in pump state. As a simple estimate, a line holding 2 L with a measured flow of 1 L/min has a nominal two-minute transit time. A sensor reading at 10:02 would then pair with water entering the intake at about 10:00. Mixing and additional cell volume can broaden or delay that response. A grab from a representative port near the sensor often simplifies the pairing if the question is what the sensor actually saw.
For selection, check the pigment channels, the option to export RFU, the expected range, the optical clearance and mounting restrictions, and how the instrument reports faults. Compare the value of a wiper, a more accessible mount, and a second reference sensor against the station's actual service schedule. A probe that remains clean only for the first few days of a monthly deployment leaves most of that record difficult to defend, regardless of its initial sensitivity.
Separate cleaning from calibration
Biofilm or sediment on a window changes the optical path. A film can shade the sample, scatter light, or contribute its own fluorescence. A wiper can help keep the optical area usable, but the wiper itself can wear, bind or carry debris. Establish an inspection interval using what the windows actually look like and how the readings behave across successive visits.
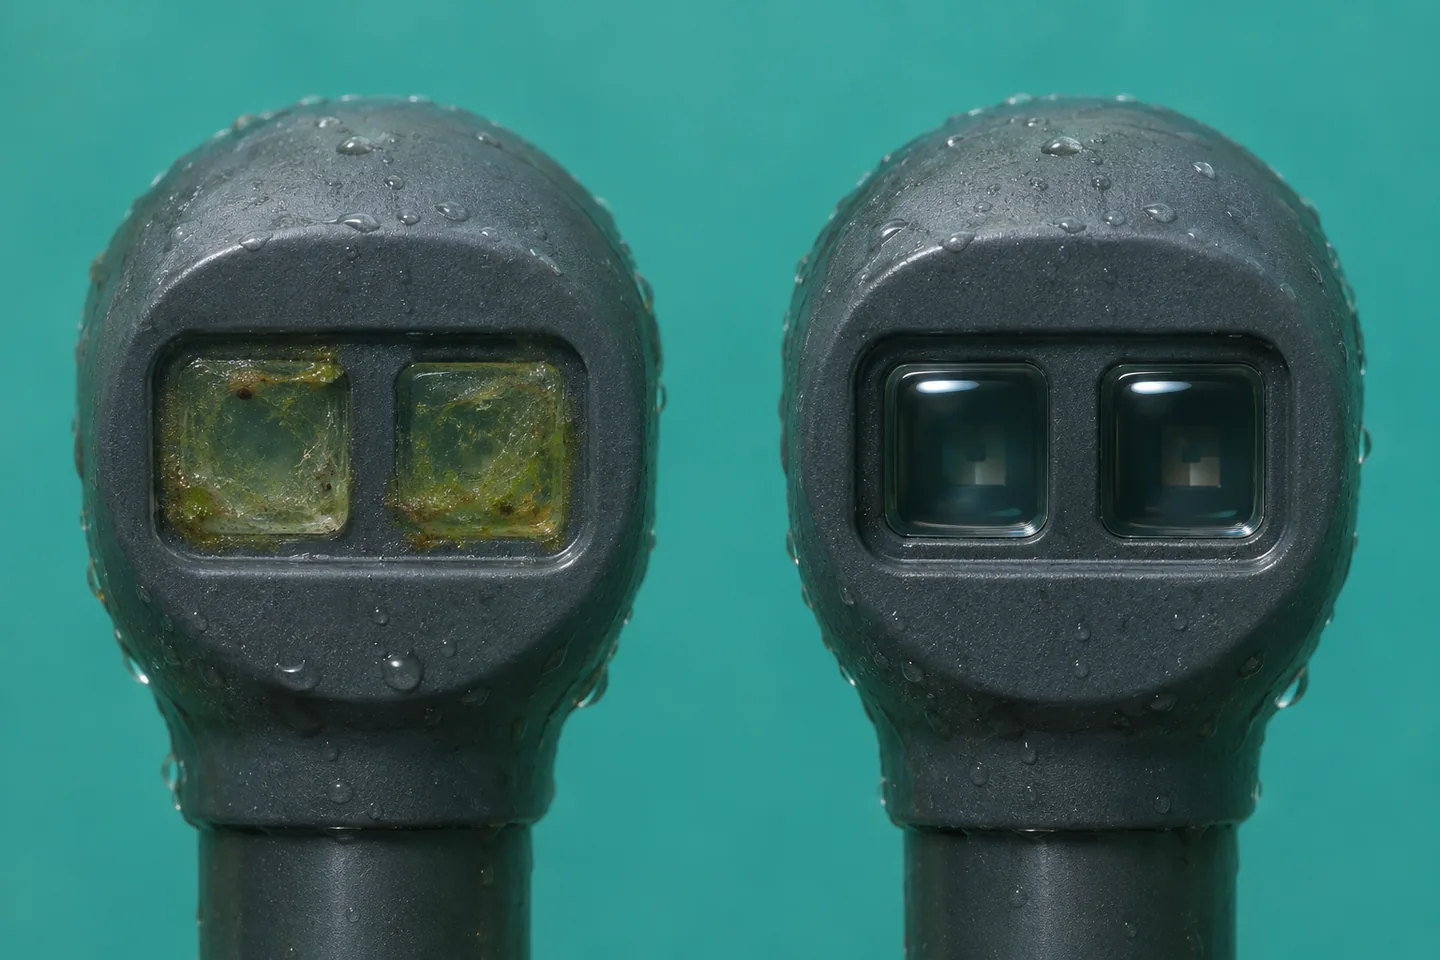
The window is part of the measurement path. A film can alter the reading before it looks thick enough to obscure the probe.
At a service visit, record the as-found time, depth, output and optical condition before moving or cleaning the probe. Clean using the procedures and materials approved for that instrument. Confirm wiper operation where fitted and return the head to its documented position. Once the reading settles, compare it with the as-found value. If the water changed during the visit or the probe came back at another depth, the difference includes those changes too. A large cleaning step is grounds to review the interval. It seldom tells you when the film started or exactly how it grew.
After cleaning, verify the instrument against the prescribed blank and suitable check reference. A blank tests baseline response under specified conditions. A stable dye or solid check reference, when supported by the manufacturer, tests sensitivity or repeatability in its prescribed setup. Note the reference lot or identifier and temperature if relevant. A standard can verify repeatable instrument response while the site relationship between RFU and chlorophyll remains uncertain. Use the check history to decide when recalibration is needed and save the pre-adjustment results alongside any changed settings. See USGS field maintenance and calibration guidance.
A useful distinction in the station log is fouling when material changed the optical path, drift when a clean sensor changed its response to a stable reference, and field bias when otherwise acceptable instrument readings systematically disagree with matched laboratory pigment data. The first two can occur together. A well-documented cleaning visit and an independent reference help separate them. Where you correct historical data, retain the original values, mark the edited interval and record the evidence behind the correction.
Validate concentration estimates with matched grab samples
A grab sample is a discrete sample of water. For a useful comparison it must represent what the fluorometer saw. Match horizontal position, depth and time. Keep the sampling device clear of the probe's windows and avoid stirring bottom sediment or introducing air at the optical head. A sample skimmed from the surface answers a different question from a fixed probe several meters down, even when both are from the same station.
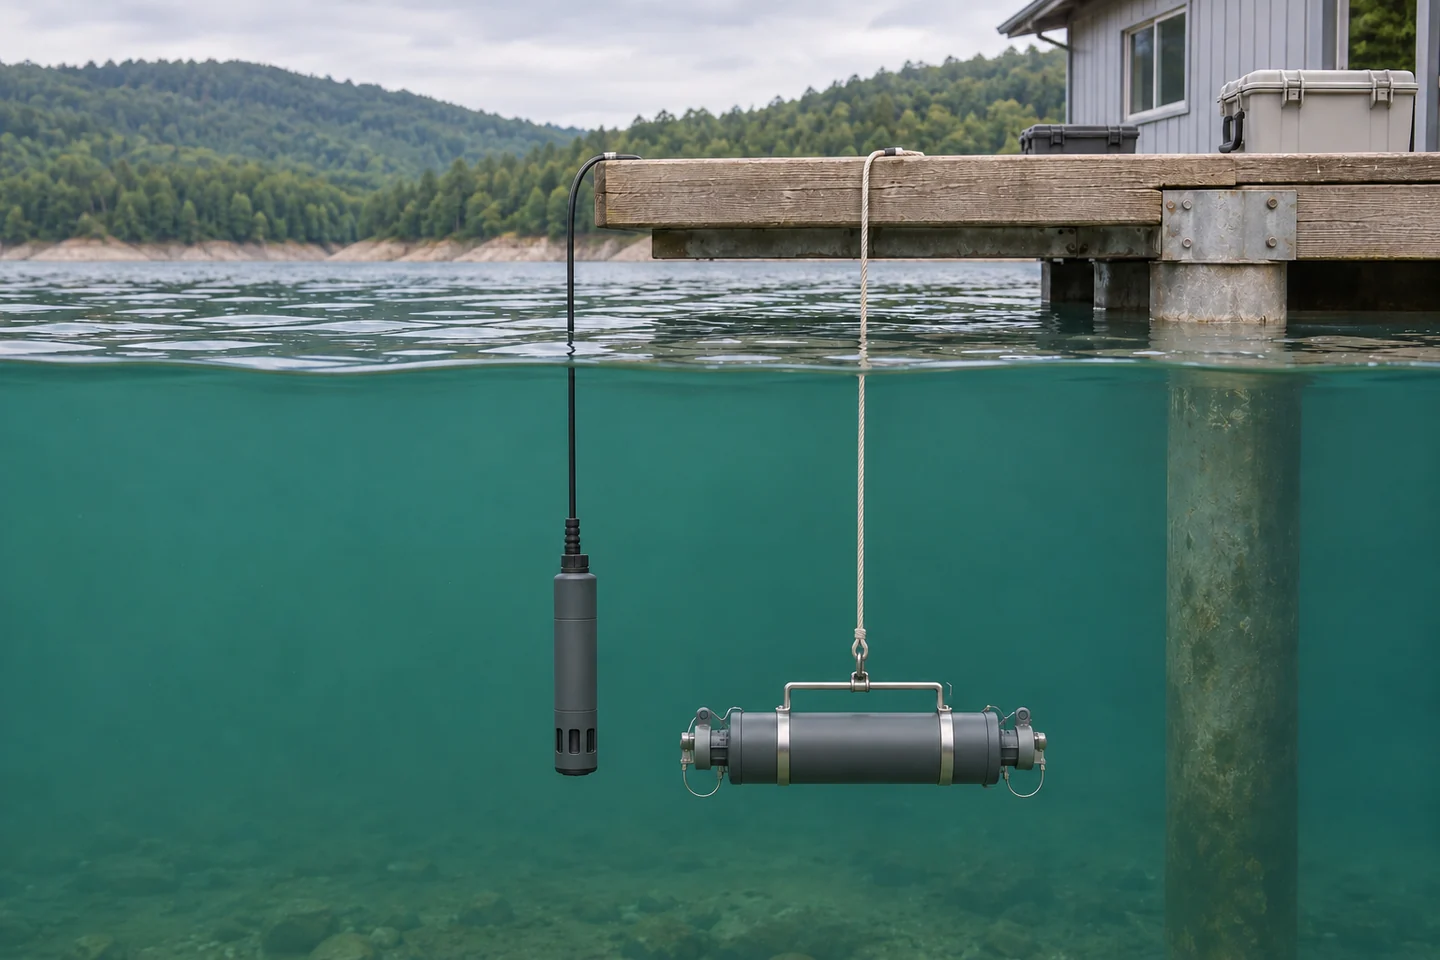
Pair the probe value with a sample from the water around the optical head. A distinct surface sample can be useful for a surface question and should be identified separately.
- Agree on the laboratory measurand. Ask the lab which chlorophyll method it reports, how it handles degradation pigments, and what filtration, containers and handling it requires. In EPA Method 445.0, pigment is collected by filtration, extracted and measured fluorometrically. Laboratory methods can differ in the treatment of compounds such as pheophytin a. Keep the method and reporting conventions stable across calibration and validation samples. See EPA Method 445.0.
- Capture a documented pair. Record sample ID, collection time and time zone, station, depth, raw signal, the instrument's reported units, and its configuration. Use an appropriate stable logging window around the grab and record that window. In a rapidly changing event, an hourly average can hide the signal that corresponds to a sample taken during a brief spike. Save temperature, turbidity, light or weather, instrument status and the last service date.
- Sample the range where the estimate will be used. Berücksichtigen Sie den Grundwert und den erhöhten Pigmentspiegel. Probieren Sie die Kombinationen aus Jahreszeit, Licht und Wasserbedingungen aus, die die Beziehung verändern könnten. Mehrere Proben an einem klaren Nachmittag können die Wiederholbarkeitsschätzungen für diesen Nachmittag verbessern. Fügen Sie unabhängige Besuche hinzu, um herauszufinden, ob sich die Beziehung auf andere Tage oder einen Sturm überträgt. Ziehen Sie doppelte Griffe in Betracht, wenn es wahrscheinlich ist, dass es auf kurze Distanz zu Lücken kommt.
- Separat montieren und prüfen. Tragen Sie extrahiertes Chlorophyll gegen Fluoreszenz auf. Eine einfache lineare Anpassung kann über einen nachgewiesenen Bereich hinweg nützlich sein, sofern ihre Fehler zur Entscheidung passen. Untersuchen Sie Fehler nach Konzentration, Trübung, Tages- und Jahreszeit. Planen Sie Besuche oder Veranstaltungen so ein, dass nicht dieselbe Veranstaltung sowohl die Anpassung als auch die Kontrolle dominiert. Eine hohe Korrelation kann mit systematisch niedrigen Schätzungen in hellem oder gefärbtem Wasser einhergehen.
- Legen Sie einen expliziten Berichtsumfang fest. Record the sensor, calibration version, site, validation range and environmental conditions. Flag values outside that scope. Compare an overlap period when you replace a sensor or change configuration. If the field relationship becomes unreliable during a different season or water condition, use the RFU as a qualified trend signal where it is still useful and continue reporting the independent lab results.
The continuous and discrete records serve different sampling needs. A sonde resolves changes between visits. A lab grab provides an independent measure at its collection time. An experimental comparison using freshwater mesocosms illustrates the amount of calibration and data review involved in deriving equivalent chlorophyll from in-water sensors. It also illustrates why results from a particular setup should travel with the setup and conditions that produced them. See the mesocosm comparison of sensor and laboratory chlorophyll.
Worked example of a fit that needs a condition flag
Suppose a hypothetical reservoir station fits estimated chlorophyll a in µg/L = 1.0 + 0.50 × RFU Nutzung früherer Besuche. Die Passform wurde über 4 bis 30 RFU aufgebaut. Die Gleichung würde 10,0 µg/L bei 18 RFU vorhersagen. Vergleichen Sie nun zwei spätere Besuche, beide innerhalb dieses Signalbereichs.
| Abgehaltener Besuch und Signal | Geschätzter Chlorophyll a | Extrahiertes Chlorophyll a |
|---|---|---|
| Ruhiger Morgen, 18 RFU | 10,0 µg/L | 9,0 µg/L |
| Klarer Nachmittag, 10 RFU | 6,0 µg/L | 11,0 µg/L |
Subtrahieren Sie die Laborergebnisse von den Schätzungen. Der Morgenrest beträgt +1,0 µg/L und der Nachmittagsrest beträgt −5,0 µg/L. Sie liegen im Durchschnitt bei −2,0 µg/L und der mittlere absolute Fehler beträgt 3,0 µg/L. Ein Programm, das nur die durchschnittliche Abweichung berücksichtigt, würde die nachmittägliche Unterschätzung von 5,0 µg/L übersehen. Die Unterdrückung von hellem Licht ist plausibel, aber zwei Besuche können weder die Ursache feststellen noch eine Korrektur quantifizieren. Überprüfen Sie die Tiefenausrichtung, den Sensorzustand und die Lichtaufzeichnung und fügen Sie dann entsprechende Vormittags- und Nachmittagsbesuche hinzu, um zu sehen, ob sich die Abweichung wiederholt. Ob diese Fehler akzeptabel sind, hängt davon ab, warum das Programm eine Konzentrationsschätzung benötigt.
Verwandeln Sie die Spur in eine Aktion
Beginnen Sie mit der Entscheidung, die der Datensatz unterstützt. Wenn Sie Probenahmen planen müssen, kann ein anhaltender Anstieg von einer gut charakterisierten lokalen Basislinie ausreichen, um jemanden zur Station zu schicken. Wenn Sie die Chlorophyllkonzentration zum Vergleich verschiedener Daten benötigen, sind der gepaarte Datensatz und seine Unsicherheit wichtiger. Wenn Sie wissen möchten, welche Organismen oder Giftstoffe vorhanden sind, sammeln Sie entsprechende Proben. Gestalten Sie den Arbeitsablauf so, dass ein hoher Messwert vom Ereignis über den Gerätestatus bis zu dem unabhängigen Test, der die Frage beantwortet, zurückverfolgt werden kann.
Bewahren Sie das Rohsignal, die geräteskalierte Konzentration (falls verfügbar) und alle Feldschätzungen in separaten Datenspalten auf. Bewahren Sie Markierungen für Verschmutzung, Wartung, eine bewegte Sonde, Messwerte außerhalb des Bereichs und Wasserbedingungen außerhalb des Modells auf. Ordnen Sie jeden Greifer dem unveränderten Signal zu und dokumentieren Sie jede korrigierte Kopie. Dadurch ist es möglich, die Beziehung erneut zu betrachten, ohne die ursprünglichen Beobachtungen zu verlieren oder versehentlich eine andere Tiefe oder Kalibrierung zu vergleichen.
Häufig gestellte Fragen
Kann ich RFU mit einem Universalfaktor in Chlorophyll a umrechnen?
RFU depends on the instrument and its scale. The relationship with extracted pigment also depends on the organisms and the water's optical properties. A laboratory-paired fit can provide a conversion for a specified use. Keep the original RFU and the conditions for which the equation was checked.
Sollte ich jeden Greifer vor dem Vergleich mit einer Sonde einer Dunkeladaption unterziehen?
Use a matched reading under ambient conditions to validate what an immersed sonde saw. Dark adaptation changes the intact-cell response, so a dark-adapted reading can serve as a separate diagnostic comparison if that is part of the study. Follow the laboratory's pigment method for handling the extraction sample.
Wenn sowohl Chlorophyll als auch Phycocyanin ansteigen, handelt es sich dann um eine Cyanobakterienblüte?
Ein gleichzeitiger Anstieg kann die Entscheidung, eine Probe zu entnehmen, unterstützen, insbesondere wenn Phycocyanin Cyanobakterien lokal verfolgt hat. Auch Veränderungen der Wassereigenschaften und der Bevölkerungszusammensetzung können sich auf beide Kanäle auswirken. Verwenden Sie geeignete Identifizierungs- oder Zellmethoden, um festzustellen, welche Organismen vorhanden sind, und führen Sie eine direkte Analyse auf Toxine durch.
Warum stimmt ein kalibrierter Sensor nicht mit dem Labor überein?
The calibration establishes the sensor's response to its standard. A grab can disagree because it represents another time or depth, because the cells fluoresced differently in the water, or because suspended material, color or fouling affected the optical path. Confirm alignment and instrument condition before fitting a new conversion.
Wie oft sollten die Fenster gereinigt und der Laborvergleich wiederholt werden?
Legen Sie das Reinigungsintervall anhand von Inspektionsprotokollen und Vorher-Nachher-Kontrollen fest. Verkürzen Sie die Zeit, wenn sich Filme schneller entwickeln oder sich im Wischer Schmutz ansammelt. Wiederholen Sie die gepaarte Probenahme, wenn Sie auf eine neue Jahreszeit, einen geänderten Sensor oder eine geänderte Konfiguration oder fehlende Wasserbedingungen im Validierungssatz stoßen. Die Zeit zwischen Reinigungen und die Zeit zwischen Validierungsproben beantworten unterschiedliche Fragen.







Hinterlasse eine Antwort