

Start an indoor-air-quality monitoring plan with the question each space needs to answer, not a shopping list of sensor channels. A library reading room, a short-stay reception area and a crowded community hall have different occupancy patterns, pollutant sources and decisions. Direct CO₂ measurements can help interpret occupied-air and ventilation patterns; particle measurements can reveal a different problem, such as infiltration or a local source. Temperature and humidity help describe conditions but are not a substitute for either pollutant measurement. Choose representative positions, log how the room was used, check instrument quality and assign someone to act on recurring findings. A single “air quality score” or one lobby display cannot certify an entire building.
This approach fits a shared space because its occupants, opening hours and uses can change abruptly. The US EPA's Building Air Quality Guide treats indoor air as a management and investigation task involving sources, ventilation, maintenance and communication. EPA's guide to low-cost indoor monitors emphasizes that a device measures selected parameters with limitations. Monitoring is useful when it is linked to a building decision; it is weak when the display is treated as a universal verdict.
Begin with a room-use map
Walk the facility with its operator and list the spaces people actually use. Note when they are occupied, by how many people in broad terms, whether users stay for minutes or hours, and what activities or sources matter. Identify the ventilation system or zone serving each room if known. A shared building may have a common entrance but separate air handlers, exterior walls, opening windows, cleaning schedules or nearby traffic. Those features change what a measurement can represent.
| Space type | Occupancy pattern | First monitoring question | What one reading misses |
|---|---|---|---|
| Library or study area | Sustained occupancy with quiet peaks | Do occupied-time CO₂ and comfort conditions change across a full session? | Outdoor particles, dampness, cleaning products and local air differences. |
| Meeting or training room | Rapid entry, high density, empty breaks | What happens after people enter, and does the pattern recur in similar meetings? | A lobby monitor cannot stand in for this room. |
| Reception or waiting area | Short visits and frequent door opening | Are particles or temperature affected by outdoor air and door traffic? | A CO₂ snapshot may mainly reflect passing occupants. |
| Multipurpose hall | Very different events | Which event types merit separate observations? | An empty-day baseline says little about a full event. |
| Corridor or stairwell | Transit, not stable occupancy | Is there a specific air-transfer or source question? | It normally cannot represent adjacent occupied rooms. |
These are prompts for planning, not a universal rule that each listed room needs a device. Prioritize spaces by a real question, duration of use, complaints, sensitive activities, suspected sources, building-system differences and the ability to respond. Some problems require inspection before sensors. Visible water damage, an odor tied to cleaning or an appliance concern should not be postponed while staff wait for a CO₂ trend. The EPA's office occupant guide describes source control, ventilation, moisture and communication as connected parts of IAQ management.
A room-use map also prevents a misleading portfolio average. Combining a rarely used conference room with a constantly occupied study area can produce a comfortable-looking daily mean while obscuring an important occupied period. If the building shares one dashboard, keep room IDs and use types visible and inspect the trace during the relevant activities. The average of unlike rooms is not a physical air sample anyone breathed.
Match the channel to the question
An IAQ monitor is a collection of measurement channels, not a magic measure of “air.” Before choosing hardware, write what each channel can and cannot support. Ask whether the finished device directly measures the target and whether its accuracy, environmental limits, logging and maintenance are suitable for the intended use. A sensor-module specification is not automatically the finished monitor's performance guarantee.

| Channel or observation | Useful question | Major limit |
|---|---|---|
| Direct CO₂ (often NDIR) | How does occupant-generated CO₂ change during defined use, and might outdoor-air provision warrant investigation? | It does not measure particles, carbon monoxide, most chemicals or infection risk. Occupancy and sensor position matter. |
| PM₂.₅ or other particle measurement | Do particle levels change with outdoor events, cleaning, activities or filtration? | Low-cost optical sensors have composition, humidity and calibration limits; particle mass does not identify the source. |
| Temperature and relative humidity | Are comfort and moisture conditions changing? | They describe conditions, not all pollutants or a diagnosis of mold. |
| Targeted gas or chemical measurement | Is a particular source suspected? | Choose a suitable method and qualified investigation; a generic TVOC number does not identify individual compounds. |
| Visual inspection and occupant reports | Are there leaks, odors, dampness or time-linked complaints? | Reports are context, not a calibrated concentration; they still may require action. |
Itu ASHRAE position document on indoor CO₂ cautions that CO₂ is not an overall IAQ index or a universal health threshold. It is more informative when people are the main CO₂ source, the direct measurement is reliable and occupancy and ventilation states are known. An “eCO₂” value inferred from a VOC sensor is not a direct CO₂ measurement; our panduan CO₂ langsung versus eCO₂ explains that distinction. A device that only reports a combined color or score may hide which channel changed and how the score was calculated. The air-quality score versus concentration guide gives a way to read those interfaces without treating them as regulations.
Particles present a different measurement job. EPA's public-building smoke-event guide describes indoor-versus-outdoor particle comparisons and the use of air sensors to assess filtration or changes during smoke events. A particle filter may reduce particles while leaving CO₂ almost unchanged because it does not bring in outdoor air. Conversely, opening an outdoor-air path can lower CO₂ while outdoor particle pollution rises. The air purifiers and CO₂ guide develops this separation. Monitoring both channels can prevent the wrong conclusion that one action solved every exposure.
Safety instruments form a separate category. A low-cost multipollutant monitor should not silently replace a correctly selected smoke alarm, carbon-monoxide alarm, fuel-gas detector or occupational exposure assessment. EPA asks users to distinguish a monitor alert from an emergency safety alarm. Specify a dedicated safety product and follow local code and manufacturer instructions where a safety function is required. A building dashboard can support investigation, but it must not be the sole barrier against an acute hazard.
Plan around occupancy phases, not just calendar days
The same room can have an empty setup period, an arrival surge, sustained use, a break and a cleanup period. Those phases cannot be compared by one undated value. For CO₂, note when people enter, how long they stay, whether windows or outdoor-air supply change, and whether a measurement is from the occupied period or a pre-use baseline. A rising trace after entry is unsurprising; its interpretation depends on people, room volume, mixing, outdoor air, instrument response and time. A flat line might be a balance under those conditions, smoothing in the display or missing data. It is not a certificate of a ventilation rate.

The illustration shows different occupancy phases without pretending to contain measured concentrations. Suppose a community hall is used for a morning class and an evening event. The morning and evening readings should retain the participant count or defensible estimate, duration, door/window state and ventilation schedule. If the event is crowded and the class is small, a higher end-of-session CO₂ value cannot automatically be attributed to a broken system. If the hall is served by a variable ventilation system, note which mode was actually operating rather than assuming its schedule ran as intended.
For a particle question, the event boundaries may be different. A reception-area PM sensor can respond to outdoor traffic, cleaning, a doorway or a nearby activity while occupancy barely changes. Compare with an outdoor reference or a second relevant room when the question calls for it; do not assume that a high indoor reading necessarily originated indoors. During wildfire smoke, bringing in more outdoor air without filtration can have a different consequence from increasing outdoor air on a clean day. Facilities decisions should account for the actual outside condition and the building's controls, as EPA's smoke-event guidance explains.
Kita meeting-room CO₂ trend guide shows how to mark entry, meeting duration and mode changes. The method carries over to any short-use room. It should be adapted to the specific pollutant: a CO₂ occupancy event and a particle infiltration event are not interchangeable.
Choose representative positions and record them
Place a monitor where its inlet can sample air relevant to the people and question. EPA's indoor sensor siting guidance advises a typical breathing-zone height, free airflow around the inlet, and avoiding positions dominated by a window, door, HVAC outlet, local source or air cleaner. Its indoor guidance also calls attention to power, network access, security and access to the monitor. A wall location may be physically convenient but could represent a draft rather than the occupied room.

The illustrated points are candidates to assess, not approved mounting positions. In particular, a position next to the window or cleaner may sample a local air stream rather than the air people normally breathe. Visit the space during normal operation, note the direction of air movement and move the instrument when its inlet is dominated by a nearby source or jet. The same diagram can therefore help a facilities team reject a convenient but unrepresentative position.
Sketch the position relative to seating, external doors, windows, supply and return openings, filtration units, kitchens or printers. Record inlet height and whether furniture could block it. If a public-area power socket is the only available supply, protect cables and do not create a trip hazard. If the network requires a captive portal or loses signal in the room, test data transmission before assuming the dashboard has a complete record. Make sure authorized staff can safely retrieve and maintain the device, while preventing accidental unplugging or tampering. Those operational details can determine whether a monitoring plan produces usable data at all.
One sensor in the reception area cannot automatically stand in for the meeting room behind a closed door. Nor does adding a sensor to every room guarantee meaningful coverage. A sensible first deployment may use a portable instrument to map plausible occupied positions and then put fixed units where repeated, comparable observations will change a decision. If rooms have different HVAC zones or high spatial variation, more than one point can be justified. If instrument count is limited, rotate devices with a deployment log rather than silently changing the room assignment. Our office placement guide goes deeper on the representative location decision.
Decide the comparison before collecting a month of data
Define the comparison while the team can still change the installation. For a library, a useful question might be whether the occupied afternoon trend differs from a similarly occupied morning after the ventilation schedule changes. A monthly average across holidays, empty mornings and crowded afternoons would blur that answer. Mark the occupied intervals, the relevant ventilation state and the time statistic before plotting. A median, sustained interval or time trace may serve different decisions; a single daily maximum can be dominated by one short event or a device being moved.
For particles, decide whether the hypothesis concerns an indoor source, outdoor infiltration or filtration. An indoor trace alone cannot reliably distinguish them. An outdoor comparator, a neighboring room or an event note may be necessary. When a cleaner is added, record its position, operating mode and whether doors and windows stayed comparable. A reduction measured right beside its outlet should not be presented as room-wide performance. When conditions change together, record the comparison as suggestive and repeat it under a better-controlled condition rather than attaching a false percentage improvement.
Decide who can act on each result. The facilities manager may inspect a schedule or damper; the cleaning team can review a product or task; a specialist may need to investigate moisture or combustion. Give the recipient a defined review interval and a way to flag urgent concerns outside the routine dashboard. A measured pattern is useful when it points to an accountable next check, not when it is merely available for download. For a large venue, start with a few rooms representing different use and air systems, learn which comparisons survive real operations, then expand coverage. This avoids treating device count as a proxy for evidence quality.
Finally, plan how to report uncertainty. Distinguish missing data from low readings, and label an intervention date without claiming causation. Compare like occupancy and weather where possible, show the time window, and state whether the instrument was co-located or professionally checked. A public summary can explain the issue, action and follow-up without displaying raw minute-by-minute readings or an unqualified green badge. The underlying log should remain available to the team responsible for investigation.
Include the people who actually use the space in that loop. A repeated complaint about odor, dampness or discomfort deserves a response even when the selected channels appear ordinary: the chosen sensor may not measure the substance or event of concern. Ask when and where the observation occurs, check the room's activities, and document what can and cannot be concluded. Explain whether a follow-up measurement or building inspection is planned, who owns it and when the finding will be reviewed. This gives occupants an intelligible path for concerns without claiming that a monitor is a comprehensive health assessment.
Check the instruments before ranking rooms
An apparent “worst room” may be a mislocated or miscalibrated device. Note model, serial number, firmware when relevant, measurement channel, range, stated accuracy, service status, warm-up behavior and logging interval. Use the manufacturer procedure for calibration or verification. Two different products can have different averaging and automatic baseline algorithms. Comparing a one-minute instantaneous display in one room with a 30-minute smoothed chart in another is not a fair comparison.
If several devices will be used to rank spaces, place them side by side in the same air first and compare their trends within their specifications. Synchronize timestamps. This co-location check can reveal obvious disagreement but is not a formal calibration certificate. Inspect for repeated flat lines, impossible jumps, missing intervals and device moves. Preserve raw exports and mark questionable data instead of deleting inconvenient points. The cross-zone comparison guide provides a method for direct CO₂ monitors. For PM sensors, humidity, particle properties and indoor/outdoor correction differences need their own assessment; a correction obtained in outdoor air should not be assumed valid indoors simply because both display PM₂.₅.
Instrument checks matter most when a reading triggers expenditure, claims about safety or a public-facing label. A display resolution of one ppm is not one-ppm accuracy. A precise-looking dashboard can still have a biased inlet position or a clock error. When evidence is insufficient for the decision, bring in an appropriate building professional or more suitable measurement method rather than multiplying low-quality sensors.
Turn readings into an action record
Give each monitored space a short record: room ID, purpose, device and position, occupancy interval, channel and units, ventilation/filtration state, unusual sources, data-quality flag, observation, owner, action and comparable follow-up. The detail need not burden occupants; most can be carried by a device register, room timetable and a short event note. A facilities team should be able to reconstruct why a chart changed six months later, after the room layout or staff have changed.

Consider a recurring rise in meeting-room CO₂ during full sessions. First confirm that the device measures CO₂ directly, its clock and inlet position are credible, and occupancy is similar across sessions. Then check outdoor-air schedule, room controls and maintenance history. Record an authorized intervention and compare subsequent full meetings, noting differences in attendance, weather and room operation. Do not claim that an improvement in one graph proves a particular mechanical defect has been repaired without inspecting the system. If the issue is a cleaning odor, the CO₂ line may be irrelevant; route the concern through source-control and product-use investigation.
EPA's Building Air Quality Guide includes developing an IAQ profile, communicating about concerns, investigating causes and judging mitigation. These steps are stronger than simply coloring a dashboard. An operational report can show open questions, incomplete data and follow-up dates. A single facility-wide score can hide them. The person receiving a concern should know how to escalate moisture, combustion, unusual odor or health complaints through the building's established process, even when all routine sensor numbers look low.
A copyable deployment worksheet
| Bidang | Entry to complete before routine monitoring |
|---|---|
| Space and intended decision | Room ID, use and what a finding would change. |
| Relevant source or occupancy pattern | Who uses it, when, and suspected pollutant pathway. |
| Selected channels | Direct measured parameters, units and why each is needed. |
| Instrument and service | Model/serial, instructions, accuracy, check date and owner. |
| Location and infrastructure | Inlet point, height, nearby openings, power/network/access/security. |
| Comparison period | Occupied interval, baseline, reference location and event notes. |
| Quality checks | Co-location, clock, missing-data and position checks. |
| Action and follow-up | Local rule or investigation method, responsible person and review date. |
Leave a field blank when it is unknown; do not fabricate a value to fill a template. Document which channels were actually measured. A future auditor should not have to guess whether “PM” means PM₂.₅ mass, particle count or an uncalibrated color badge. Likewise, a “good air” score is not a unit. This worksheet can be short for a small venue and more detailed for a building with multiple air-handling systems.
Questions facility teams often ask
Is CO₂ enough for a public library or waiting room?
It can be useful for a defined occupied-air question if measured directly and interpreted with occupancy and position. It cannot rule out particles, cleaning emissions, dampness or combustion hazards. Add a channel or investigation only when a source and decision justify it. A waiting room with frequent door openings may need a different sampling design from a quiet reading room.
Should we publish a real-time color score for visitors?
Only if the displayed measure, time interval and limits are clear and the operator can respond to it. A changing color without a parameter and method can create false reassurance or alarm. A plain account of what was measured, what happened and what action follows is often more useful than a composite score whose formula visitors cannot inspect.
How many monitors does a shared building need?
There is no useful universal number based only on floor area. Start with room use, distinct HVAC zones, pollutant sources and decisions. Test whether representative positions support the intended comparison; add devices where spatial variation or operational responsibility makes them valuable. A portable survey can precede a fixed deployment, but document each move.
Can a lower CO₂ reading prove an air cleaner worked?
Not ordinarily. Particle cleaners generally do not remove appreciable CO₂ or supply outdoor air. A lower CO₂ trace may instead reflect fewer people or more outdoor air. Check a relevant particle channel and comparable conditions if particle removal is the decision.
What if people report a problem but the monitor looks normal?
Treat the report as information about a possible source or condition outside the monitored channels. Inspect the room and timing, and involve the facility's IAQ or safety process. A monitor's silence does not exclude a pollutant it does not measure. A fire or CO alarm requires its own emergency response regardless of an IAQ dashboard.
Keep the monitoring plan answerable
A good shared-space program can explain every installed instrument: its question, measurement method, position, conditions and owner. It can separate a repeated occupied pattern from a door-opening episode, and a ventilation concern from a particle or source concern. When the evidence does not justify a conclusion, the record says what needs checking next. That is how a few well-run sensors become more useful than an unexplained wall of colored numbers.
Technical sources
- US EPA Building Air Quality Guide
- US EPA Low-Cost Air Pollution Monitors and Indoor Air Quality
- US EPA Guide to Siting and Installing Air Sensors
- US EPA Office Building Occupant's Guide
- ASHRAE Position Document on Indoor Carbon Dioxide
- US EPA Wildfire Smoke and IAQ in Schools and Commercial Buildings

Bagaimana Menafsirkan Pembacaan CO2 di Kabin Kendaraan
Baca tren CO2 di kabin kendaraan bersama penumpang, mode HVAC, dan kondisi rute sambil memisahkan petunjuk ventilasi dari pertanyaan keselamatan partikel dan gas buang.
Baca selengkapnya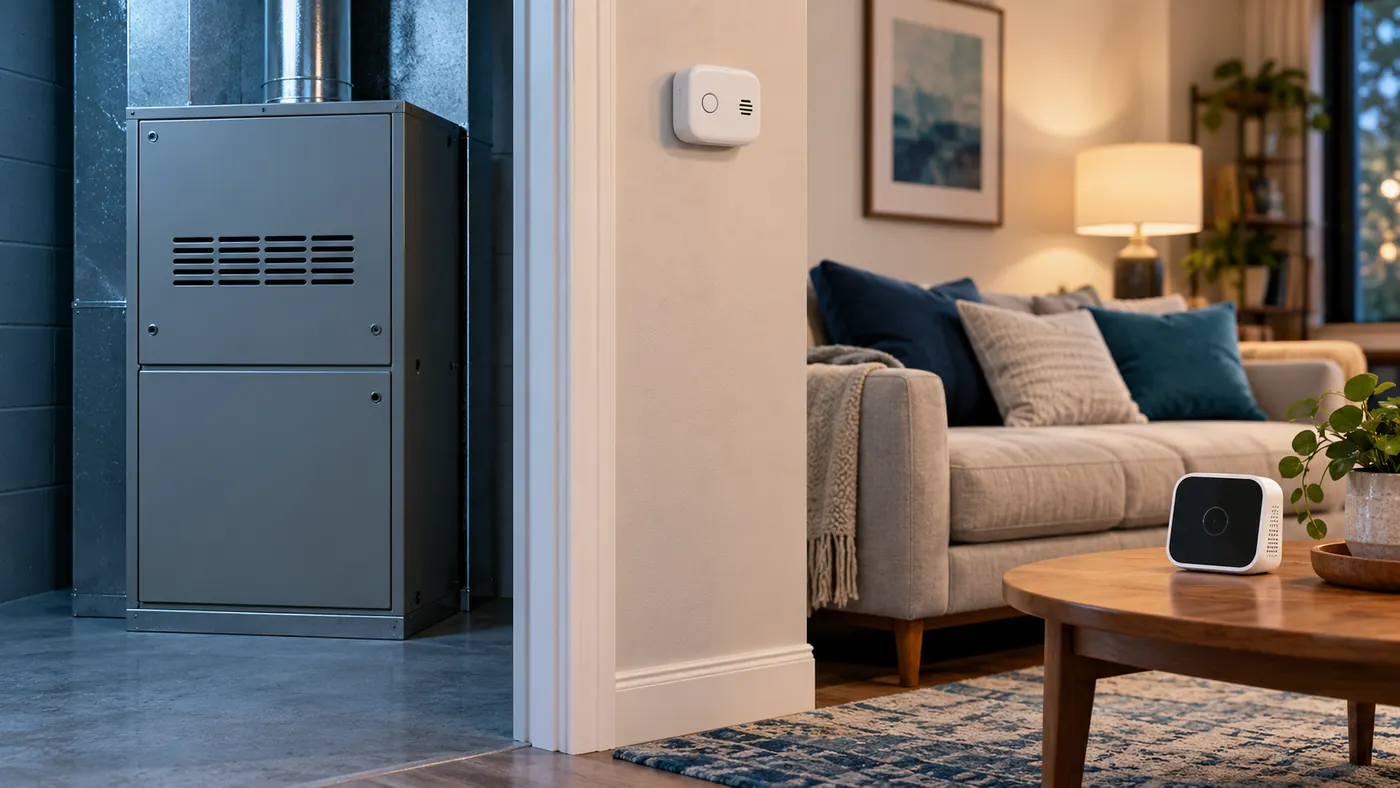
Pemantauan Pemanas Gas di Rumah: Alarm dan Sensor Mana yang Melakukan Apa?
Pahami peran terpisah dari alarm CO rumah tangga, detektor bahan bakar gas, monitor CO2, dan layanan pemanas yang memenuhi syarat, termasuk apa yang harus dilakukan setelah peringatan.
Baca selengkapnya
Bagaimana Membangun Catatan Pemantauan IAQ Sekolah yang Mengarah pada Tindakan
Gunakan ruangan yang terhubung, catatan kejadian yang ditempati, dan catatan masalah untuk mengubah pengamatan CO2 di sekolah menjadi tindak lanjut ventilasi yang andal.
Baca selengkapnya
Tempat Menempatkan Monitor CO2 di Ruang Kelas Sekolah
Pilih posisi monitor CO2 kelas sekolah yang representatif berdasarkan hunian dan jalur udara, lalu verifikasi, dokumentasikan, dan pelihara pemasangannya.
Baca selengkapnya
Bagaimana Menafsirkan Pembacaan CO2 Kelas untuk Ventilasi
Menafsirkan pembacaan CO2 di kelas sebagai petunjuk ventilasi yang terisi dengan konteks, panduan lokal, pemeriksaan monitor, dan tindak lanjut yang berulang.
Baca selengkapnya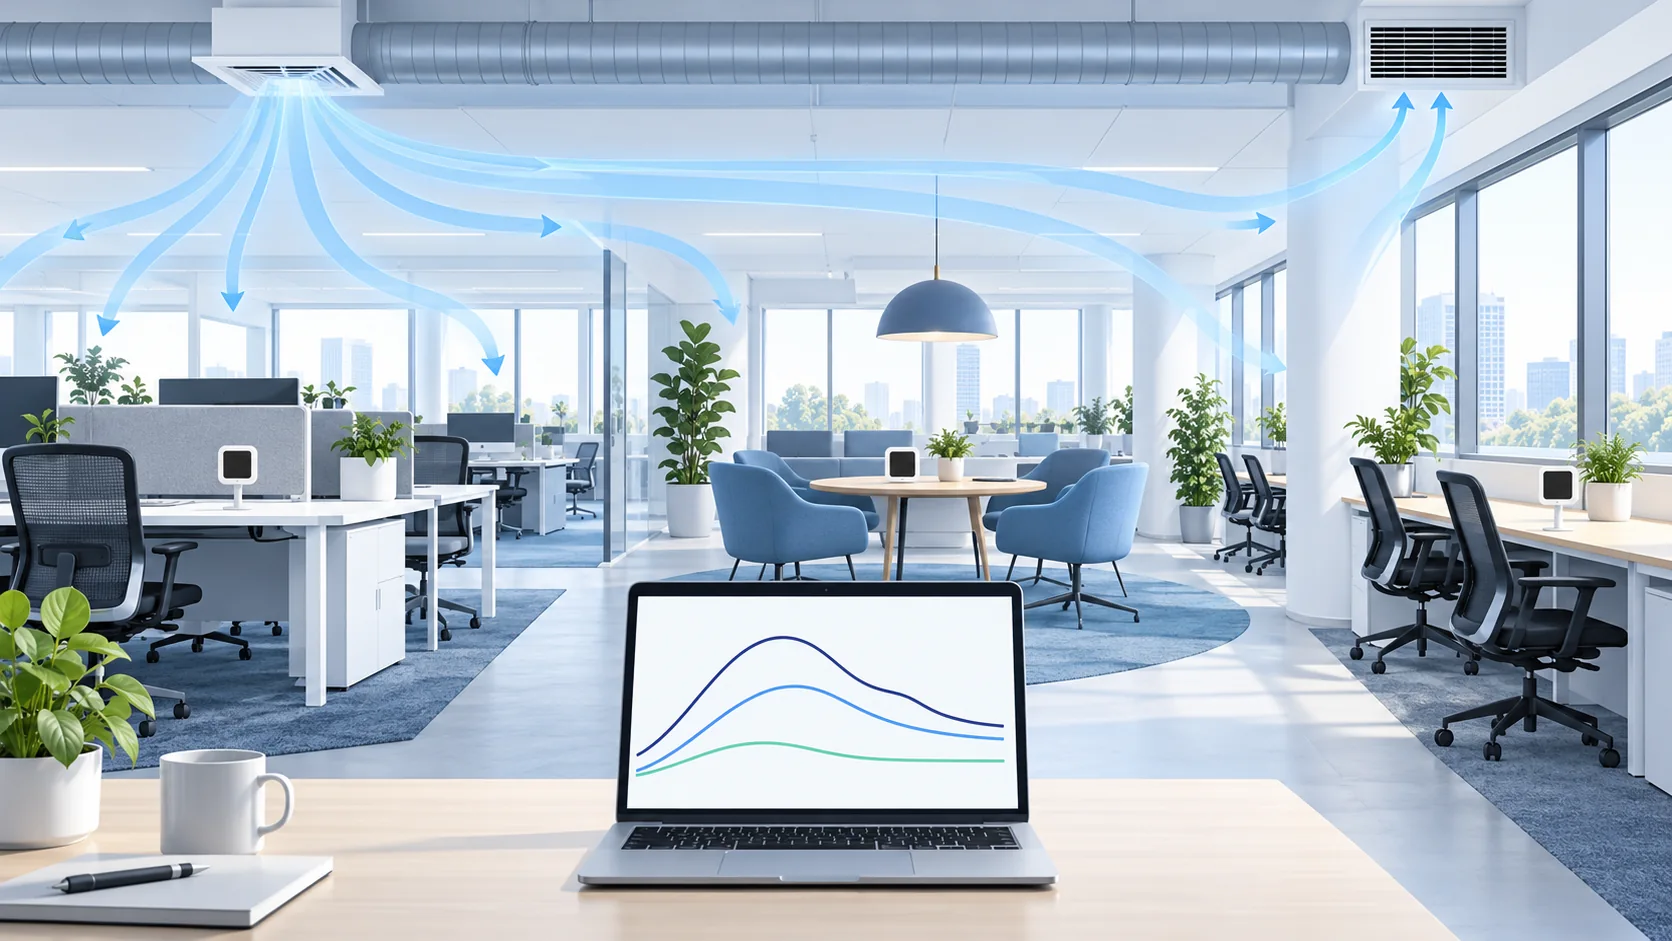
Bagaimana Membandingkan Pembacaan CO2 di Seluruh Zona Kantor Terbuka
Bandingkan log CO2 zona kantor yang disinkronkan setelah memeriksa perjanjian monitor, lokasi, hunian, dan kejadian sistem udara; pelajari kapan perbedaan zona memerlukan penyelidikan.
Baca selengkapnya