
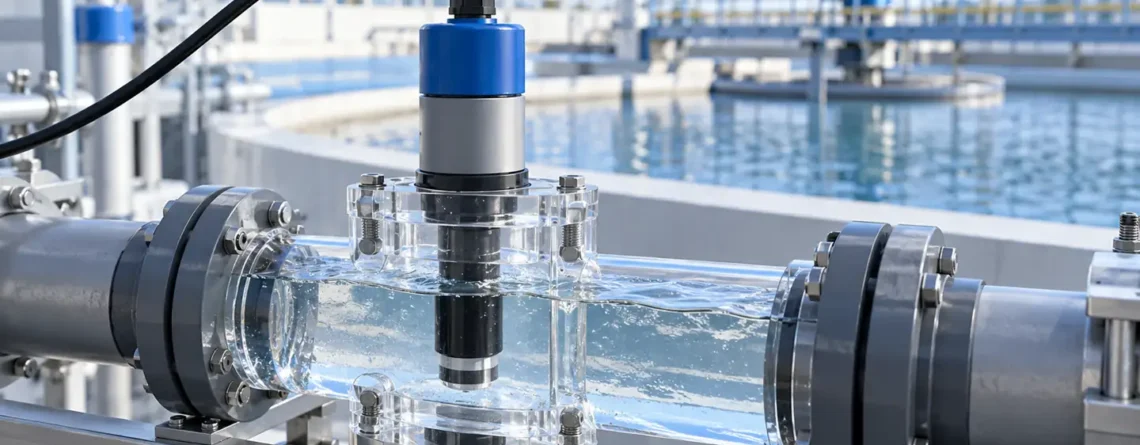
Choose a turbidity sensor by the water you sample, the optical method you must report, and the maintenance the installation can sustain. Turbidity is an optical response to particles in water. It is useful for following clarification, filtration, runoff, or process change, but a single reading does not identify the particles or prove that water is safe. If two instruments use different light sources, detector angles, sample paths, or reporting methods, their displayed numbers may differ even on the same water. In particular, NTU and FNU should not be treated as interchangeable labels or converted by a universal multiplier.
An online sensor is only as useful as the decision it supports. Before comparing catalogs, write down the expected range, the normal and upset particle conditions, whether a particular reporting method is required, the available sampling point, and what action follows an alarm. The resulting specification is usually more valuable than selecting the device with the broadest advertised range.
Inizia con la domanda a cui la lettura deve rispondere
Turbidity can support several different decisions. A drinking-water filtration operator may need a continuous, low-level trend and a defined regulatory measurement method. A river-monitoring team may want a robust record across storms, where bubbles, sediment and rapid flow changes are common. An industrial process might only need to detect a transition from clear rinse water to suspended solids. The same numerical range does not make these jobs equivalent.
| Decisione | What a sensor must capture | What the reading alone cannot tell you |
|---|---|---|
| Filter performance | Stable low-end response, suitable measurement method and prompt detection of breakthrough. | Which particles or microorganisms are present. |
| Raw-water or river trend | Broad operating conditions, representative placement and fouling management. | Suspended-solids mass without a site-specific relation. |
| Clarifier or settling control | Changes over the process range and repeatable sample handling. | Whether a particular chemical dose is correct without other process measurements. |
| Process rinse or product interface | A reliable change from the local baseline. | The chemical identity of material causing light scatter. |
Write a one-sentence operating requirement: “Detect a sustained rise in filtered-water turbidity under our required method within our normal range,” or “Trend stormwater changes at an accessible in-stream location.” Then define how you will check a suspicious result. That simple exercise exposes whether you need a laboratory nephelometer, an online flow-cell analyzer, an immersed field sonde, or a combination.
What the optical measurement actually sees
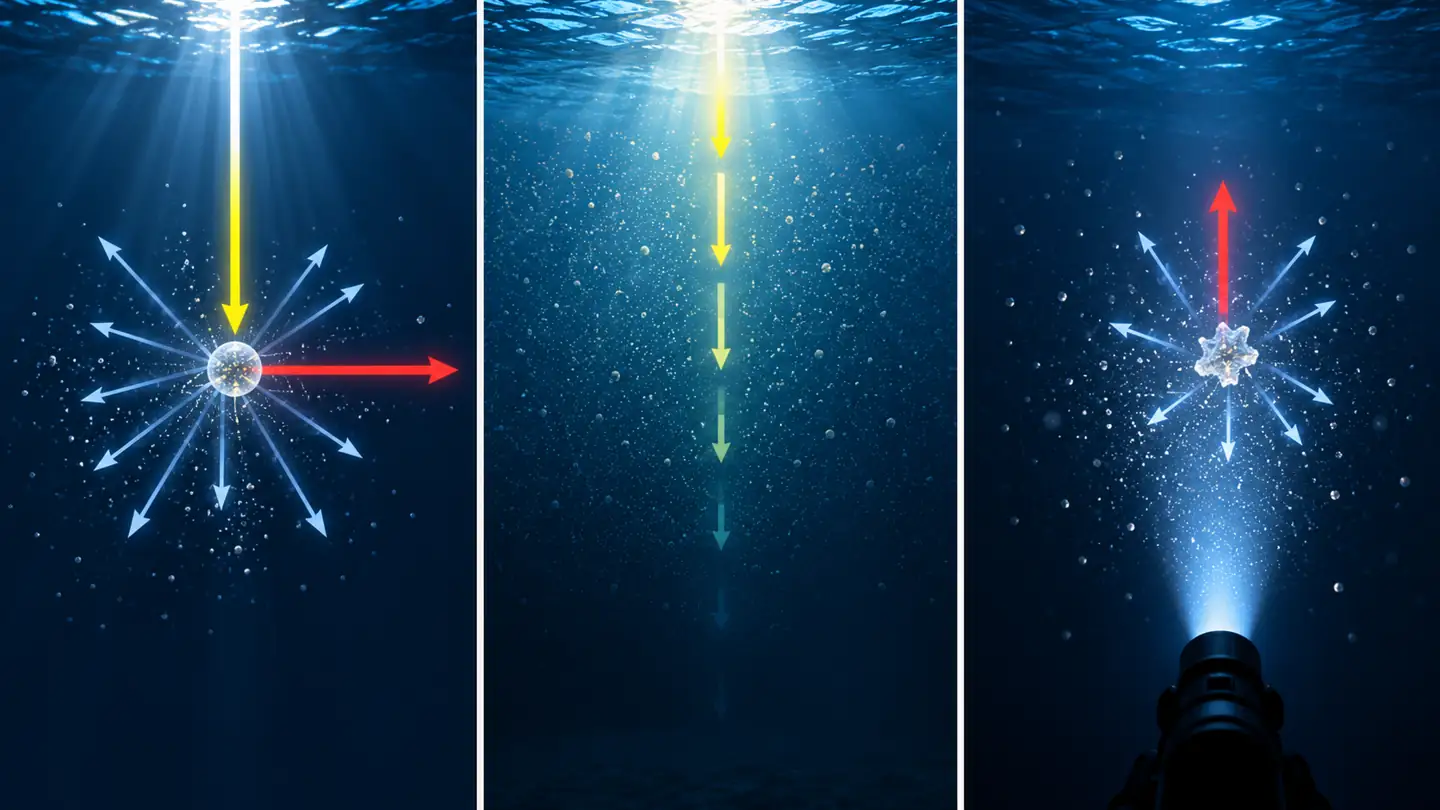
A turbidity instrument sends light into a water sample and measures a response related to scattering or attenuation. Particles scatter light because their refractive index differs from the surrounding water. The response depends on more than the amount of material: particle size, shape, color, composition and distribution all influence the optical path. A very fine clay and a larger biological floc can yield different responses at the same mass concentration. Dissolved color can absorb light; it is not the same physical property as suspended turbidity, but it can affect a particular optical method.
Many nephelometric methods place a detector near 90 degrees to the incident beam. Other instruments use additional detectors or different geometries to extend range or address interference. A transmitter may combine detector signals with an internal algorithm. As a result, “optical turbidity sensor” does not tell you enough to compare outputs. The light source, spectral band, detector geometry, processing method and calibration standard belong in the procurement record.
IL US EPA field turbidity procedure E Manuale da campo USGS make the method and instrument configuration part of a meaningful field reading. That is why a change of sensor model may require a new comparison period rather than a seamless continuation of an old trend.
Turbidity, suspended solids and clarity are related but different
Turbidity expresses an optical response. Total suspended solids, often determined by filtering and weighing a sample, expresses mass per volume under a defined laboratory procedure. Secchi depth or visual clarity expresses a different observational property. All three may move in the same direction in a stable local process, but no general conversion works across different waters. If a project needs suspended-solids mass, develop and periodically review a local relationship with paired samples. If the project needs a specific contaminant or microorganism, measure it directly using the applicable method.
Do not turn a single turbidity number into a universal “water quality score.” Low turbidity does not prove freedom from dissolved chemicals or pathogens, and high turbidity does not identify a particular hazard. Turbidity can be a valuable process indicator precisely because it detects optical changes quickly; its interpretation stays tied to the process and method.
NTU and FNU: record the method with the number
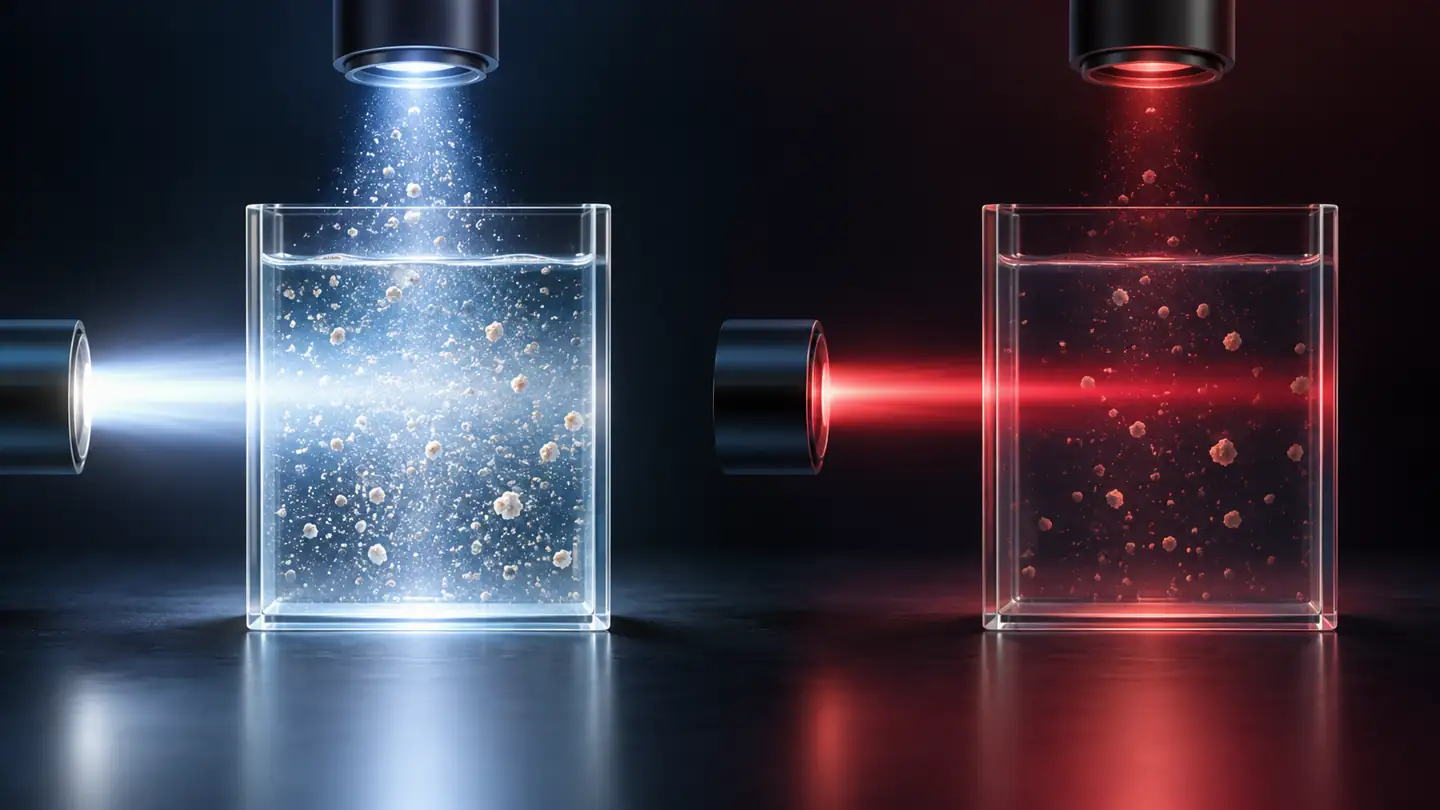
In common reporting, NTU is associated with a white-light nephelometric approach such as US EPA Method 180.1, while FNU is used with an infrared 90-degree approach. The labels carry information about measurement method, not merely a numerical scale. Instruments may use other reporting abbreviations for different optical geometries. Check the instrument manual rather than assuming all values called “turbidity” are method-equivalent.
IL US EPA Method 180.1 document specifies a particular nephelometric measurement and discusses interferences. Its cited direct-measurement range is 0–40 NTU, with higher samples handled by dilution within the method. That method scope is non the range of every modern online device. The EPA field procedure distinguishes NTU and FNU reporting. For a compliance or contractual measurement, use the method required by that program and confirm the specific device is suitable.
Two readings may agree closely in one clean reference suspension and diverge in a colored or compositionally different real sample. Infrared and visible wavelengths respond differently to some optical properties. A sensor change should therefore trigger paired measurements across the actual process conditions, including normal water and likely upset water. Report both method names and both readings. Do not fit a conversion from a handful of clean samples and assume it remains valid during a storm or treatment upset.
| Comparison question | Perché è importante |
|---|---|
| Are the light source and detector geometry the same? | Different optical configurations may respond differently to the same particle population. |
| Are both instruments calibrated to the same traceable standard and range? | Calibration can make reference standards agree without making all field waters agree. |
| Are the sample paths equivalent? | Bubbles, settling and flow-cell residence time can create apparent disagreement. |
| Do readings diverge only at high turbidity? | Range extension, dilution, detector algorithms or multiple scattering may be involved. |
| Do readings diverge when water color changes? | Spectral absorption may affect the methods differently. |
If your historical data mixes NTU and FNU, preserve the original method field. A plot may show both series with a documented instrument change, but silently merging them as one calibrated series can mislead later analysis.
Match sensor format to the sampling point
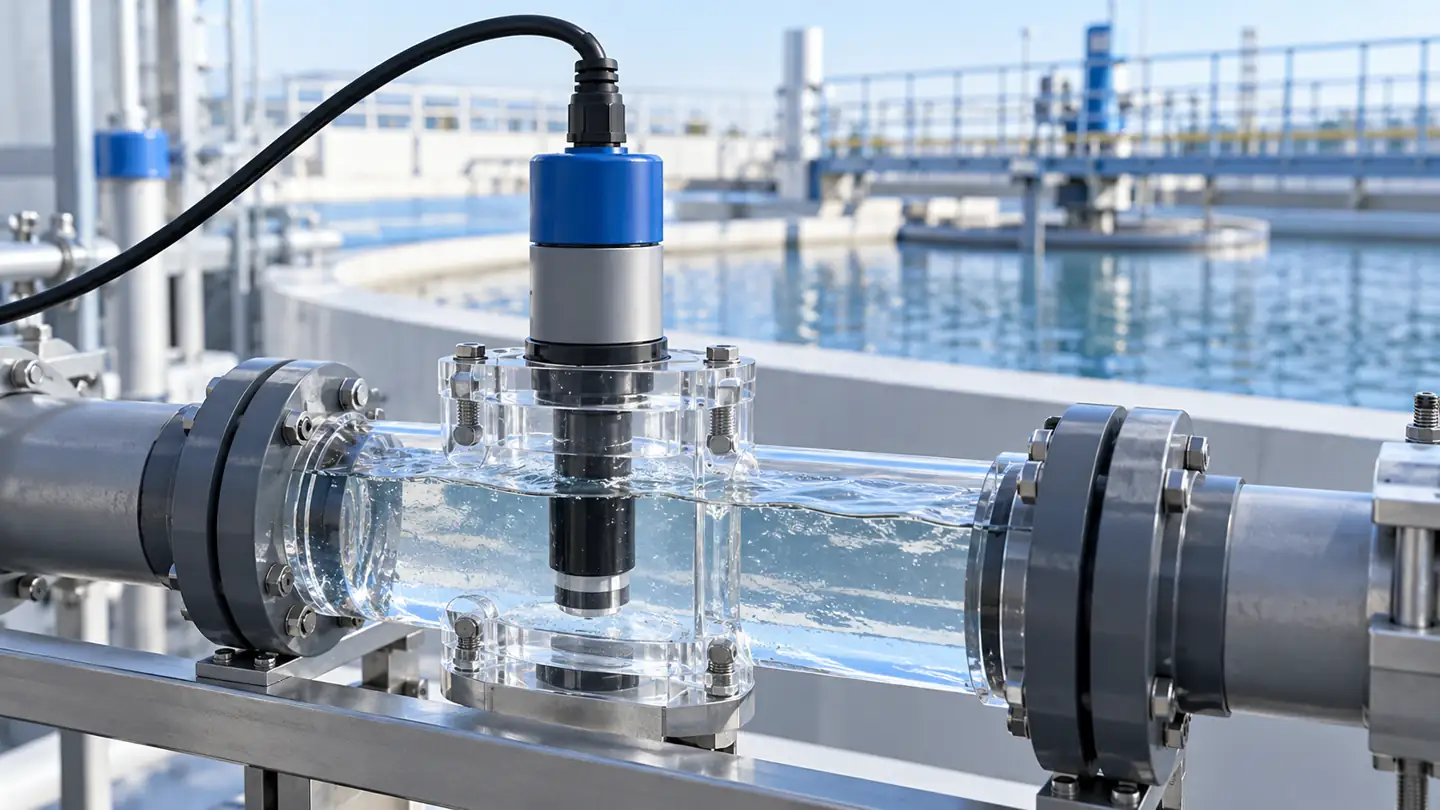
An immersed probe measures water at its optical window. A flow-cell analyzer measures water that has traveled through tubing, valves and a cell. A benchtop instrument measures a collected sample after a delay. Each has legitimate uses and a different error path.
For an in-line or immersed probe, ask whether the sensor remains submerged through the operating cycle and whether its optical window sees representative moving water. Sediment deposits in a dead zone, direct sunlight on some housings, trapped bubbles, or a cleaning jet aimed at the window can all alter the reading. Confirm the manufacturer’s required flow and mounting orientation. A wiper or air-cleaning system may extend unattended time, but it does not eliminate inspection.
For a bypass flow cell, trace the sample from the process tap to drain. Long tubing allows delay and may permit particles to settle. A pump or pressure reduction may introduce bubbles. Valves can change flow without an obvious sensor error code. The sample must be representative at the time your control system acts, not merely representative after the process has changed. Locate the grab-sample port close to the optical cell so a verification sample and online number describe nearly the same water.
For a handheld or laboratory meter, use clean sample vessels, follow its mixing and settling instructions, avoid fingerprints or scratches in the optical path, and record the time between collection and measurement. Shaking can resuspend material but also add bubbles. A single sample may be insufficient to characterize a rapidly changing process. The relevant procedure is the one specified for the instrument and monitoring program.
Bubble, fouling and color checks
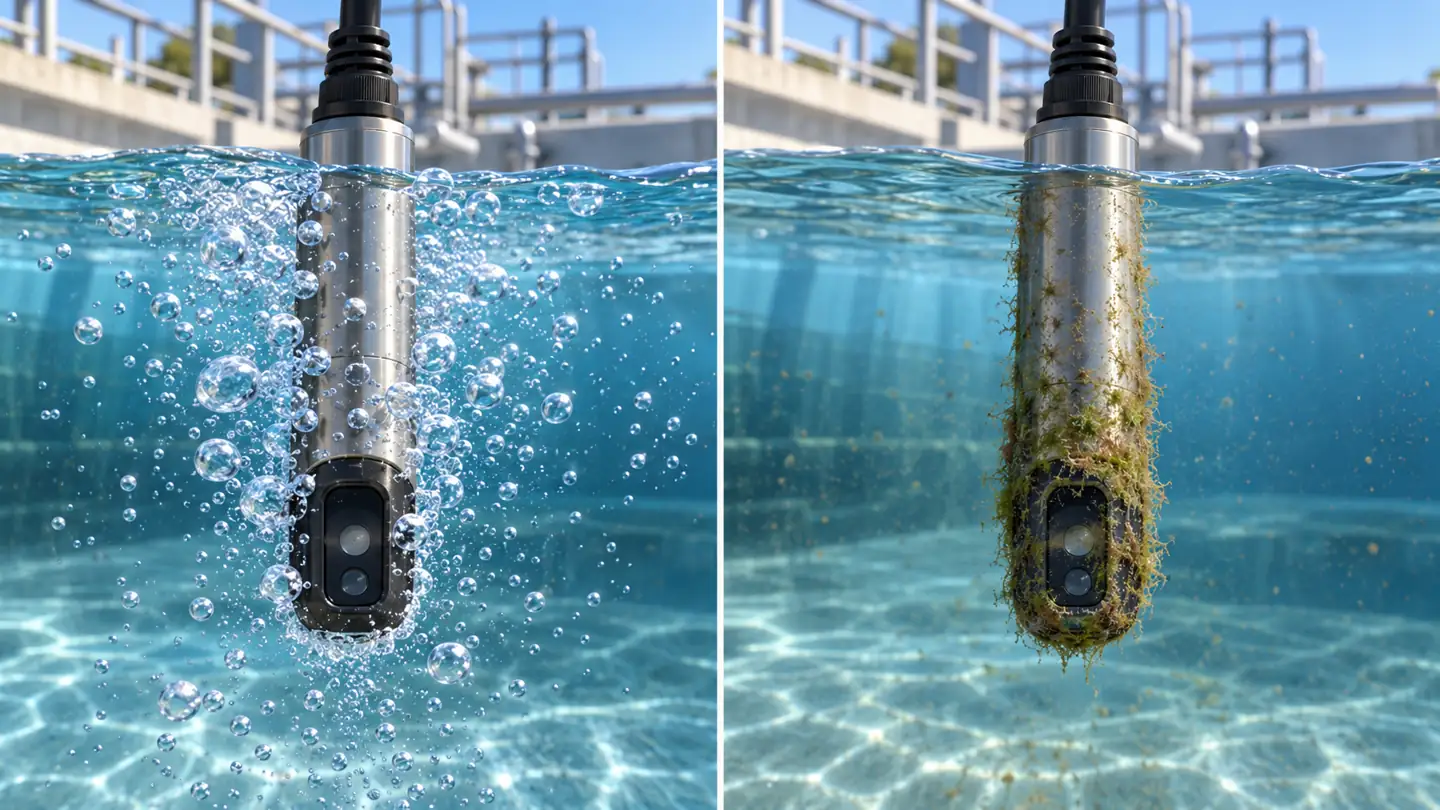
Bubbles scatter light and can make turbidity appear higher. Fouling on a window may create a sustained offset or reduce sensitivity, depending on optical design. Dark dissolved color can absorb light and, for some methods, bias the observed response. Stray light, condensation and damaged optics can also matter. These are not all solved by a fresh calibration: calibration of a clean sensor may leave a bad sampling path untouched.
A useful troubleshooting order is physical. First check that water is present and representative; then inspect flow, bubbles, window cleanliness, wiring and diagnostics. Compare a grab sample using a suitable reference method. Only after those checks should you adjust calibration. Repeatedly “calibrating away” an installation problem can hide a worsening process fault.
Build a specification around range and uncertainty
The advertised measuring range describes where the device can produce a reading; it does not alone tell you the uncertainty at your decision point. Ask for the manufacturer’s performance statement at the low end, the conditions under which it was tested, and the reference material used. If you need to detect a small change near a low baseline, resolution, repeatability, drift and reference-check performance matter more than the highest number on the display.
Include the following in a purchase or trial worksheet:
- Decision and method. State whether monitoring is trend-only, process control or reporting under a defined method. Record required units and optical configuration.
- Water and range. Capture typical, minimum, maximum and transient conditions; describe color, particle types, bubbles, temperature and cleaning chemicals.
- Sampling and power. Specify immersion versus bypass, flow, pressure, mounting, access, supply voltage, data output and any delay tolerance.
- Maintenance. Specify cleaning access, wiper or air-cleaning needs, reference-standard handling, spare parts and expected inspection frequency.
- Verification. Define a paired-sample plan, reference instrument, acceptance rule and who records deviations.
Request documentation for the exact sensor, transmitter, firmware and accessory combination. A model-family brochure is a starting point, but a range or accuracy claim might apply only to one configuration. Confirm material compatibility when the water contains strong cleaners, high salinity or unusual temperatures. If data feed an alarm, define what happens on lost signal, out-of-range status or implausibly flat readings.
Why a pilot installation helps
A short pilot on the actual water can reveal practical problems no brochure resolves. Compare the online device against a suitable reference method at the decision point, during ordinary operation and during at least one realistic change if feasible. Record both readings, time, process state, cleaning history, sample location and visible bubbles. Avoid claiming a statistical conversion from too few paired points. The purpose is to determine whether the sensor supports your action reliably and what maintenance it needs.
For low-level monitoring, the sample handling may dominate the discrepancy. For high or changing concentrations, particle distribution and optical range may dominate. A pilot should cover the region near the intended threshold, not only a convenient midrange standard. If the process seldom enters that region, use an appropriate reference or controlled evaluation without implying that laboratory behavior proves field performance.
Calibration and verification are different tasks
Calibration adjusts an instrument response against specified standards according to its procedure. Verification checks whether the installed measurement system gives an acceptable result without necessarily changing it. A reference check before cleaning, another after cleaning, and a documented adjustment if required can show whether the problem was fouling, calibration or sample handling. Follow the instrument maker’s exact sequence and the monitoring program’s acceptance rule.

Use standards appropriate to the method and concentration range. Handle them as their instructions require: contamination, aging, improper mixing or an unclean vial can make a check misleading. Keep the standard’s identity, lot, expiration, reading and instrument status in the record. When the device is in a bypass, a successful optical standard check does not prove the sample tap is free of bubbles or sediment. That is why a field comparison and physical inspection remain separate from the calibration certificate.
| Finding | First physical questions | Next measurement step |
|---|---|---|
| Sudden noisy spikes | Are bubbles, pump pulsation or loose solids present? | Compare a simultaneous grab sample and inspect flow. |
| Slow upward drift | Is the window fouled or is the water truly changing? | Record pre-cleaning and post-cleaning readings before adjusting calibration. |
| Very low flat reading | Is there blocked flow, optical contamination or a failed light source? | Check diagnostics, sample path and a suitable reference. |
| Different online and laboratory values | Do sample time, optical method and mixing match? | Run paired samples and record method/unit on both. |
| Change after replacing the sensor | Is geometry, firmware or calibration different? | Establish a documented overlap period. |
The maintenance interval should respond to actual fouling and risk. A clean, stable sidestream may need a different schedule from a stormwater probe that collects biofilm or grit. Set an initial schedule, then refine it using recorded verification drift and observed physical condition.
Make the data usable after installation
Store more than the displayed number. At minimum, retain the unit, instrument model, method or optical configuration, location, calibration and cleaning history, measurement time, temperature where relevant, and instrument status. If you replace a probe or revise the algorithm, annotate the series. A future analyst should be able to tell whether a shift came from the water or from a change in the measurement chain.
For control systems, choose alarms with both process understanding and measurement uncertainty in mind. A single spike may be a bubble. A sustained rise across independent observations is a different signal. Any alarm delay or averaging must be short enough to protect the decision it supports. The exact alarm rule depends on the plant or program, and a generic web article cannot supply a universal threshold.
Where the monitoring objective includes dissolved ions, turbidity is complementary to water conductivity monitoring. Conductivity responds to ionic content; turbidity responds to optical scattering. Neither identifies every contaminant. Using both can help diagnose whether a process change is particulate, ionic, or mixed, but source-specific confirmation is still needed.
Account for the way particles move through the process
Particles do not necessarily stay evenly distributed in a tank or pipe. Large or dense particles may settle in a low-flow section, while fine particles remain suspended. A sensor mounted at one point can therefore show a change caused by local hydraulics even when the overall process inventory has not changed. During design, sketch the flow path through the sampling point: where solids can collect, where air can be entrained, and whether a valve or pump changes the flow pattern. A representative tap is part of measurement quality, not a plumbing convenience.
Consider how fast the process changes. If a filter breakthrough develops within minutes, a long bypass line and aggressive data averaging can delay action. If the process varies slowly, fast unfiltered readings may overemphasize bubbles or individual flocs. Set the sample and logging intervals from the response time required by the decision. Document both raw readings and any displayed average so the data can be reinterpreted later.
Establish an acceptance rule before commissioning
An acceptance test should be written before seeing the first attractive trend chart. Specify the reference method, the conditions to be sampled, the number of paired observations needed and how disagreement will be evaluated. For a threshold application, test near the threshold and across likely disturbances. A check at only a high calibration point can miss a low-end problem. Include a challenge for bubble sensitivity or fouling if those are plausible on site, without presenting an improvised challenge as a formal method validation.
When readings disagree, retain both observations. Ask whether the difference is constant, proportional, intermittent or tied to a process event. A constant offset may suggest a dirty window or calibration issue; proportional differences may point to optical method or range; intermittent spikes often prompt a bubble and flow inspection. These are diagnostic hypotheses, not rules that identify a fault from a chart alone. Recheck with the same sample path before changing an instrument setting.
Separate sensor status from water condition
A data system should represent faults explicitly. “No sample flow,” “optical window needs cleaning,” “out of range” and “communications lost” are different from a low or high water turbidity result. Do not substitute zero for missing data in dashboards or averages. If an instrument reports a hold value during cleaning, mark that interval so downstream calculations do not treat it as an ordinary measurement. This matters when a trend is used to compare treatment performance over months.
Record the point at which a reference check fails and the point at which the measurement returns to service. If a sensor is cleaned and its reading changes sharply, preserve the pre-cleaning and post-cleaning values. That evidence may explain earlier drift and improve the next maintenance interval. A new probe, revised firmware or changed flow-cell geometry deserves a visible annotation even when the new instrument passes its standard check.
What to request in a vendor demonstration
Ask the vendor to show the actual installation manual, optical method, verification procedure and fault outputs for the proposed configuration. Bring a sample of ordinary process water if a demonstration is practical, and explain the lowest change that matters. A demonstration on a clean standard confirms that the instrument can respond to that standard; it says little about bubbles, fouling and particle mixtures at your site. Request the maintenance steps in writing, including how the window is cleaned without disturbing calibration.
If comparing several candidates, use the same sample and note the method on each display. A more expensive instrument need not win if its additional features do not improve your decision. Conversely, a cheaper sensor may cost more over a season if it requires frequent cleaning at an inaccessible location. Compare total operating effort and verified performance at the decision point, not merely purchase price or the largest quoted span.
Domande frequenti
Can I convert NTU to FNU?
There is no universal conversion. Their labels refer to different measurement approaches, and the relationship depends on the sample’s optical properties. If a project needs both, run paired measurements on representative waters, preserve the methods in the record and assess whether a local relationship is stable enough for the intended decision.
Does a low turbidity reading mean water is safe to drink?
No. Turbidity is an optical indicator and does not establish the absence of dissolved chemicals or microorganisms. Use the required direct analyses and applicable program procedures for safety claims.
Is turbidity the same as total suspended solids?
No. Turbidity is based on light response; TSS is a mass-based laboratory determination. A local empirical relationship can sometimes be useful, but it should be developed and reviewed using paired samples from the same water system.
Why does my online value jump while a grab sample looks clear?
Possible causes include bubbles, an unrepresentative grab location, time delay, an intermittently fouled optical path or real short events that the grab missed. Inspect the process and sample path, align sampling times and compare methods before changing calibration.
How often should a turbidity sensor be calibrated?
Follow the instrument and monitoring-program requirements. The appropriate interval depends on method, fouling, decision risk and verification history. Frequent cleaning or verification may be needed even when a full calibration is not.
Should I choose an immersed or bypass sensor?
Choose based on sample representativeness, flow stability, cleaning access, expected bubbles and how quickly the result is needed. An immersed sensor avoids transport delay but may face more fouling. A bypass cell can ease maintenance but adds a sample line that must be designed and checked.
Riferimenti tecnici
- US EPA, Field Turbidity Measurement procedure: method-specific field terminology and checks.
- US EPA, Method 180.1: white-light nephelometric procedure, scope, calibration and interferences.
- USGS, Turbidity field manual: field sampling, reporting and quality control.
- USGS, Turbidity overview: optical response and interpretation.







lascia un commento