
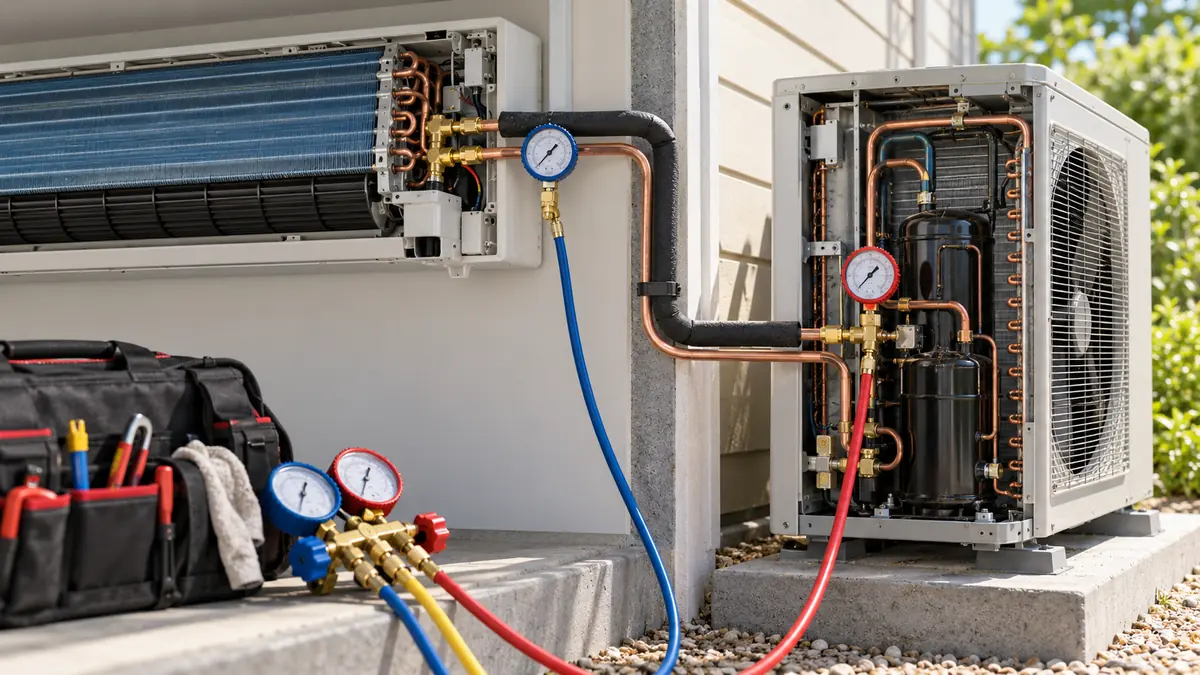
A pressure reading helps diagnose an HVAC system only after you know what medium it measures, where the tap is, what pressure reference and unit the instrument uses, and what the equipment was doing at that moment. Refrigerant suction pressure, refrigerant discharge pressure and duct differential pressure answer different questions. None is a stand-alone verdict on charge, airflow or compressor condition. For a refrigeration-cycle diagnosis, pressure becomes more useful when paired with temperature at the appropriate point, the correct refrigerant pressure–temperature data and the system's operating state.
This guide is for technicians and engineers interpreting installed pressure transducers, controller trends or qualified service measurements. It focuses on how to make a reading meaningful before using a symptom chart. It does not supply universal “normal pressure” numbers or a refrigerant charging procedure. Those depend on the equipment, refrigerant, load, ambient conditions and manufacturer instructions.
First identify the pressure measurement job
The word pressure appears in several HVAC measurement chains. In a vapor-compression circuit, suction or evaporating-side pressure helps characterize the low side; discharge or condensing-side pressure helps characterize the high side. A pressure switch may protect equipment at a defined condition, while a transmitter sends a continuous signal to a controller. Oil pressure can be a differential measurement against a compressor reference. Separately, an air-handling unit can use duct static pressure to control a fan or differential pressure across a filter or flow element. A water loop may have yet another pressure or differential-pressure measurement.
| Misurazione | Medium and boundary | Common question it supports | Why it cannot answer another question alone |
|---|---|---|---|
| Refrigerant low-side pressure | Refrigerant at a defined circuit point | What is the local saturation condition and how is the low side changing? | Does not by itself identify charge or verify airflow |
| Refrigerant high-side pressure | Refrigerant at a defined circuit point | How is condensing-side pressure responding to load and heat rejection? | Does not alone prove overcharge or a blocked condenser |
| Net oil pressure | Oil-pump discharge compared with the specified crankcase/reference pressure | Is the oil system developing the required differential? | Suction pressure is not always the same as crankcase pressure |
| Duct static or differential pressure | Air at one or two duct positions | What is the fan, filter or flow element seeing? | It is not refrigerant saturation pressure |
| Hydronic differential pressure | Water or glycol loop between two points | What pressure is available across a pump or branch? | It does not directly measure delivered heat or refrigerant charge |
The first two rows belong to the refrigeration circuit; the fourth belongs to the air path. A controller screen can place all of them together and assign similar names. Label the physical source and unit before comparing trends. Our pressure-versus-flow sensor guide gives the general distinction between pressure and inferred flow; the present article follows the diagnostic consequences in an HVAC system.
Gauge, absolute and differential are not interchangeable labels
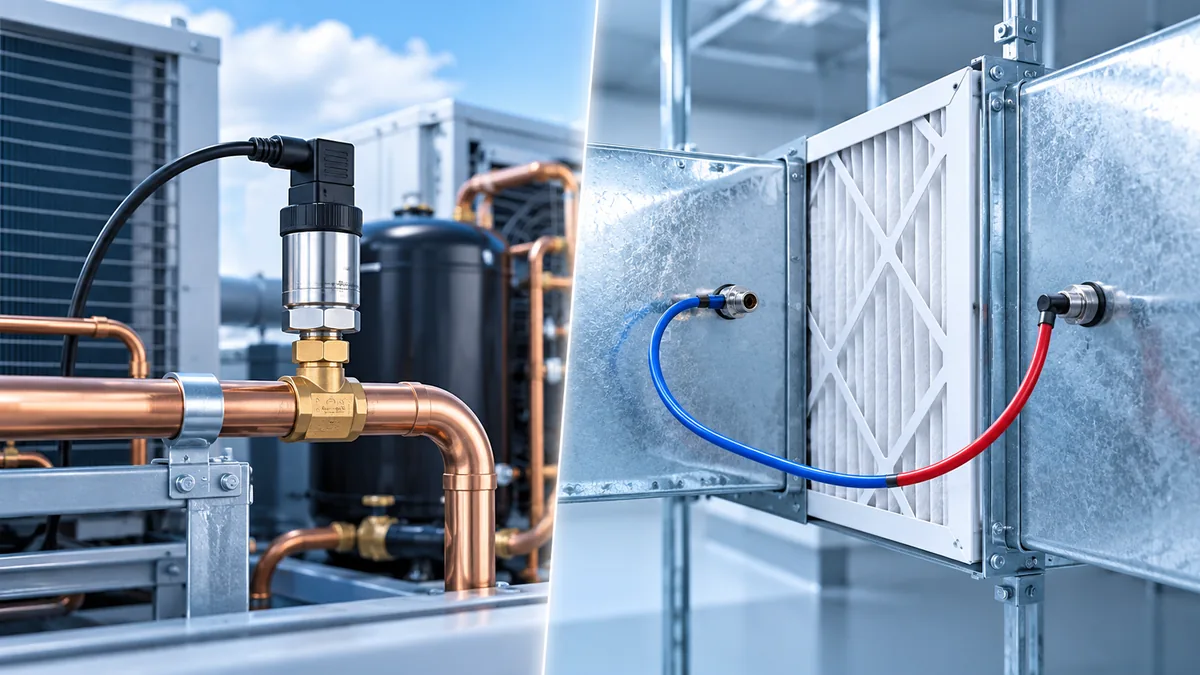
A pressure value needs a reference. Gauge pressure is expressed relative to local atmospheric pressure, absolute pressure to a vacuum reference, and differential pressure as the difference between two defined points. A pressure transmitter's electrical output is scaled to a stated range and reference. A controller that assumes the wrong range or unit can show a plausible but false engineering value. For example, a pressure value displayed in bar cannot be compared with a pressure–temperature chart calibrated in another unit without a correct conversion. More subtly, a value tagged only “pressure” may be absolute while a service instrument is displaying gauge pressure.
IL Danfoss AKS 3000 refrigeration-transmitter datasheet shows how a specific product family defines its pressure reference, signal output, wetted materials and application conditions. The WIKA R-1 refrigeration-transmitter datasheet provides a different model-specific example. These documents are useful reminders to read the exact model and variant; their pressure ranges and accuracy statements must not be transplanted into an unidentified installation.
Put the pressure and temperature at the same physical question
Refrigerant pressure can be converted to a saturation temperature for the identified refrigerant at that point. Superheat then compares an actual vapor-line temperature with the relevant saturation temperature; subcooling compares a saturation condition with an actual liquid-line temperature. The numbers have meaning only when pressure and temperature describe the same section of circuit. A pressure taken at a compressor service valve paired with a tube temperature at the evaporator outlet may include line pressure drop and heat gain between those locations. The calculated value can be arithmetically correct but describe neither location well.
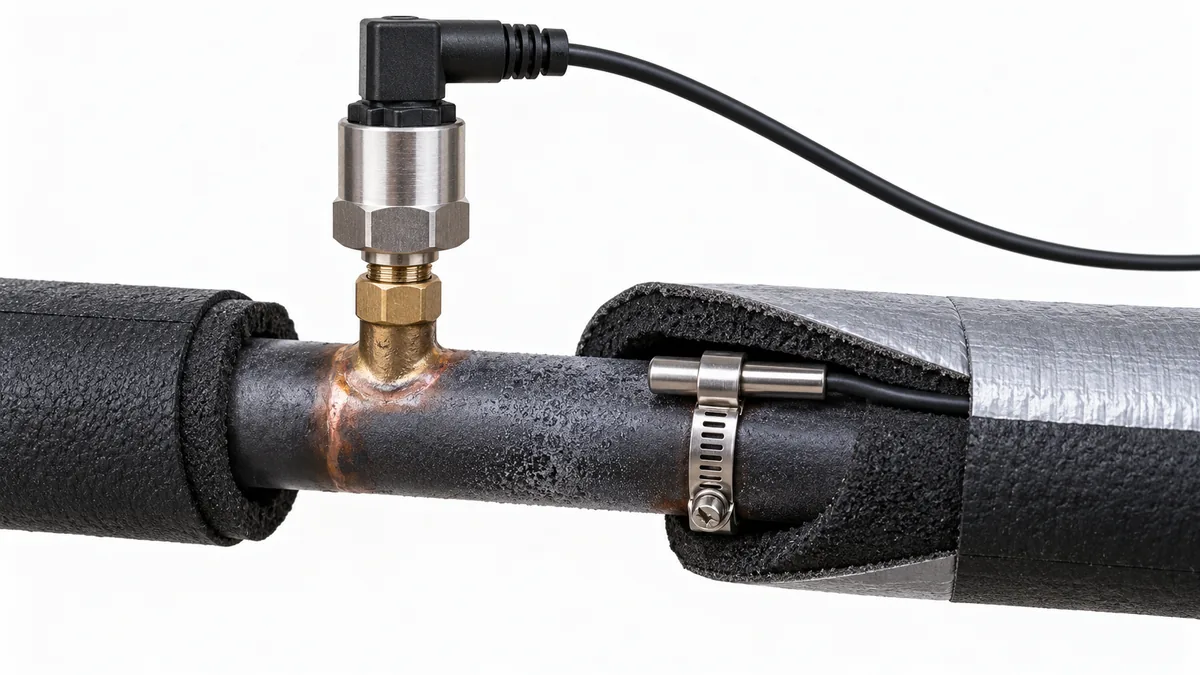
Copeland's application-engineering explanation makes the location distinction explicit. It describes evaporator superheat near the end of the coil, compressor superheat at the compressor, and subcooling near the metering-device inlet as different measurements. The best points on a particular unit still follow its piping and service documentation. A pressure tap, clamp location, insulation and the controller's sensor position should be shown on a simple circuit sketch before calculations are trusted.
For a zeotropic blend, the applicable pressure–temperature data may distinguish bubble and dew points. Select the appropriate side of the phase-change relationship for the calculation and use the actual refrigerant designation. Replacing a blend's pressure–temperature relationship with that of a component or a similarly named refrigerant can create a false “abnormal” interpretation. The Refrigerants.net refrigerant directory can help identify which fluid or blend is under discussion; the equipment documentation and approved data for that exact refrigerant remain the calculation basis. A change of refrigerant is not just a chart swap—it can change equipment approval, pressure, control and safety requirements.
Temperature measurement has its own boundary. A loosely placed clamp can sense surrounding air; bare tubing can be influenced by local airflow; a warm compressor discharge line can make contact and placement difficult. Document whether the probe was attached, insulated and allowed to stabilize under the manufacturer's procedure. A controller trend from an installed thermistor may differ from a temporary service clamp because they sit at different places and have different response times. Do not average them into a single value without accounting for that difference.
A pressure pattern suggests checks, not a single cause
Low suction pressure, high head pressure or an unusual pressure ratio can point a technician toward a subsystem, but multiple causes produce overlapping signs. A light evaporator load, restricted airflow, an expansion-device issue, a restriction, refrigerant loss or a sensor fault can all affect low-side pressure. Condenser airflow and ambient conditions influence high-side pressure. Compressor staging, variable speed, hot-gas bypass and heat-pump mode can change both sides without a fault. The expected response is a pattern under a defined operating condition, not one static number copied from another unit.
Schneider Electric's pressure-and-temperature symptoms chart is useful because it combines suction, discharge, superheat, subcooling and current rather than treating pressure as a verdict. Its rows are diagnostic prompts. They do not override the actual unit's control sequence or prove one root cause in an inverter-driven, staged or transcritical system. The Fluke compressor troubleshooting note similarly links pressure and tube temperature to compressor conditions; equipment-specific limits and safe service methods still apply.
| Observation under a stable operating mode | Possible direction to investigate | Additional evidence that changes the interpretation |
|---|---|---|
| Low-side pressure falls while demand appears unchanged | Load or air/water flow, feeding, restriction, charge, sensor | Evaporator entering/leaving temperatures, fan/pump state, superheat, trend timing |
| High-side pressure rises | Condenser heat rejection, ambient, fan/pump operation, control state, sensor | Ambient and condensing-medium temperatures, fan speed, subcooling, equipment mode |
| Both pressure signals change abruptly together | Compressor state, control transition, shared electrical or data issue | Run command, power, communication events, independent reading |
| Controller pressure is implausibly steady | Stale value, wiring/configuration problem, sensor fault—or truly steady process | Sensor health flag, raw signal, trend resolution, comparison at an approved point |
| Pressure and line temperature disagree with the expected phase relation | Wrong refrigerant/profile, point mismatch, probe error or unusual process condition | Fluid identity, instrument calibration, exact points, stabilized readings |
None of these rows authorizes adding or removing refrigerant. A charging decision requires the unit's specified method and qualified service procedure. An apparent pressure fault can be an airflow or control issue; changing charge first may conceal the original problem and create another one.
Operating mode is part of every reading
Record whether the unit is cooling, heating, defrosting, starting, unloading or at a stable condition. On a heat pump, the meaning of a physical pipe location changes across reversing-valve states. On a variable-speed unit, suction and discharge pressures may be intentionally controlled over a broad envelope. A rack controller may stage multiple compressors to keep a common suction pressure near a target while individual case loads change. A single pressure “normal range” cannot represent all these modes.
Load and external conditions matter just as much. Record return-air or entering-fluid temperature, indoor and outdoor fan or pump states, outdoor ambient, coil condition, defrost status and any recent control command. The purpose is not to collect every available sensor indiscriminately. It is to capture the variables that could plausibly explain the pressure change. A high condensing pressure during a hot afternoon and the same value during a mild morning are different questions.
The time window should include what happened immediately before the anomaly. A compressor start, valve movement or fan change can create a transient pressure response. Some installed pressure sensors update faster than temperature probes; comparing instantaneous peaks may make an apparent mismatch that disappears after stabilization. Conversely, averaging a trend over a long interval can hide a short pressure excursion relevant to protection. Save both the sampling interval and the raw or minimally processed data when a diagnosis depends on timing.
Separate the process from the transducer and controller
An installed transmitter is a chain: pressure at the port, sensing element, conditioning electronics, wiring, input scaling and displayed engineering unit. A problem at any stage can resemble a refrigeration problem. The controller may apply filtering, offset or a fallback value during a communication fault. A sensor can be healthy but mounted on a blocked or isolated port. A correct electrical signal can be interpreted with the wrong range or unit. A diagnostic note should therefore identify the point at which the value was observed.
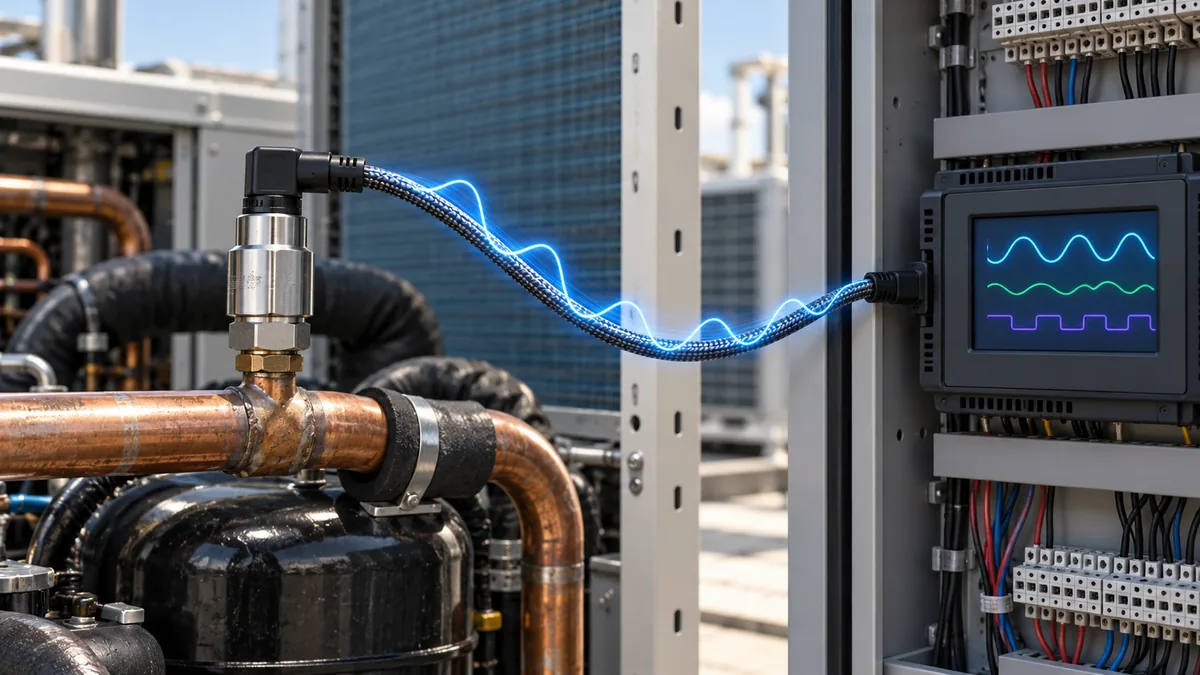
Check the actual transmitter model and configuration before interpreting the output. Its specified supply, output type, pressure range, reference, media compatibility, allowable pressure excursions and environmental rating matter. A 4–20 mA loop, ratiometric voltage output and digital message require different controller inputs and fault detection. Do not assume that a plausible value proves the wiring is good. A mismatched scaling parameter can produce a stable, believable number. Where a qualified technician compares the installed output with an independent instrument, the comparison must use the same pressure point and reference, with allowance for instrument accuracy and dynamic timing.
This is distinct from air-side differential-pressure troubleshooting. Trane's transducer support bulletin checks the tubing and signal associated with a flow ring. A pinched air tube can make that point look wrong even though refrigeration pressures are fine. The bulletin's specific voltage values belong to its described equipment; they should not be used as universal refrigerant-transducer limits.
When a pressure switch trips, the trip is an important event even if the sampled trend looks normal afterward. The switch might see a short excursion that the historian missed, or the switch and transmitter may be on different points. Record both device identities and timestamps. Never defeat a protective device to make a trend appear continuous. The applicable equipment instructions govern how a qualified person verifies the switch and returns the unit to service.
Use a short measurement record before choosing a fault hypothesis
A practical record can fit on one page. It should make another engineer able to understand what was actually measured, not merely what a screen displayed. The following template is an editorial aid; it is not a manufacturer diagnostic form.
| Campo di registrazione | Cosa scrivere |
|---|---|
| Equipment and operating state | Model, refrigerant, cooling/heating/defrost state, compressor/fan/pump state, time since transition |
| Pressure channel | Physical tap or sensor location, gauge/absolute/differential reference, unit, range, sensor tag |
| Paired temperature | Exact tube/air/fluid point, attachment method, instrument, time relative to pressure reading |
| Contesto | Outdoor/return or entering-fluid conditions, load, coil or filter condition, recent control changes |
| Instrument quality | Fault flags, calibration/service status, raw signal where available, historian sampling interval |
| Confronto | Relevant equipment target or prior comparable trend, not a generic number from another system |
| Next check | Hypothesis, independent evidence needed, person responsible and result |
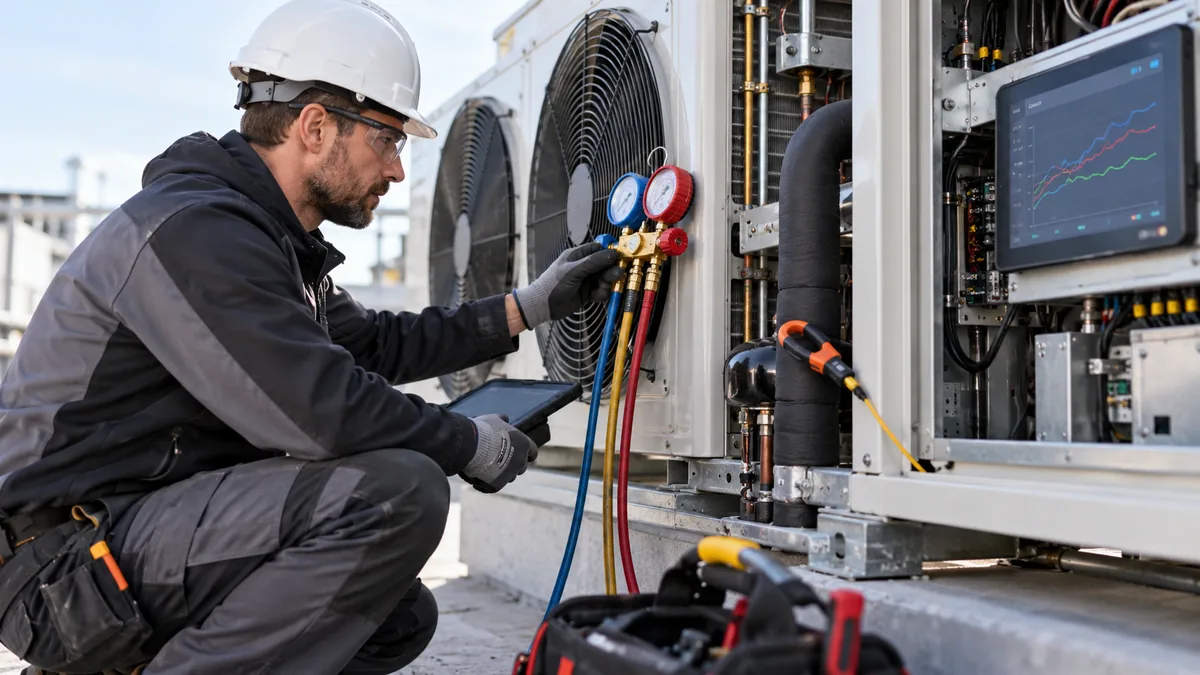
Three qualitative examples show the benefit. First, an installed suction-pressure trend falls whenever the indoor fan slows, while the compressor remains in the same command state. That pattern makes airflow and control sequence worth checking before charge. It does not prove the charge is correct. Second, a high-side reading jumps to a new constant value at the moment a controller board is replaced. That timing raises a scaling or wiring question. A genuine pressure change remains possible, so compare an approved independent point and equipment status. Third, pressure and line temperature seem inconsistent until the team finds that the clamp is several meters away from the pressure tap across an uninsulated section. The arithmetic was not the problem; the measurement boundary was.
How to compare a current reading with a baseline
The most useful baseline is a prior verified reading from the same equipment under a comparable refrigerant, mode, load and ambient condition. Manufacturer commissioning records can help if they identify those conditions. A historical trend without the refrigerant identity or sensor calibration state is much weaker. A system upgrade, refrigerant conversion, relocated transducer or changed control sequence can make a formerly useful baseline obsolete.
When several measurements disagree, do not vote by majority. Ask whether the sensors describe the same point and time. A slow temperature probe and fast pressure transmitter may capture different moments. An apparent high-side abnormality can be a control response to condenser airflow, while a nearby duct differential-pressure channel says nothing about refrigerant condensing pressure. Trace each quantity through its own physical and electrical path before reconciling them.
Choosing an installed pressure transmitter for diagnostics
An installed sensor selected only for a controller's minimum requirement may not provide the resolution, range or long-term trace quality desired for fault investigation. Conversely, a sensor with a very narrow nominal range may not tolerate expected transients. Selection starts with the actual circuit's operating and maximum conditions, refrigerant/oil compatibility, the required pressure reference and a usable signal for the controller. The environmental limits of connector, cable and housing can be as important as the sensing element. A pressure transmitter described as “for refrigeration” is not automatically suitable for every refrigerant, pressure level or connector.
Ask for a clear error statement across the temperatures that the installed sensor will see, not just a room-temperature headline accuracy. Check how the controller handles out-of-range, short/open circuit and loss of communication. Record whether field calibration is allowed, whether the transmitter can be replaced without altering scaling, and how its serial number is tied to trends. These requirements give a future technician a better chance of distinguishing a process fault from a measurement fault.
Domande frequenti
Can suction pressure alone show that a system is undercharged?
No. Suction pressure changes with load, airflow or water flow, refrigerant feed, compressor control and measurement state. An undercharge may be one hypothesis, but it needs the equipment's specified diagnostic method and other observations such as temperatures, superheat and subcooling.
Can a pressure reading give refrigerant temperature?
It can be converted to a saturation temperature for an identified refrigerant and pressure reference. That is not necessarily the actual tube or gas temperature. Superheat or subcooling needs a separate temperature measurement at an appropriate location.
Why do a controller and service instrument disagree?
They may use different taps, pressure references, units, ranges, calibration states or sample times. The controller may filter or substitute a value during a fault. Resolve those differences before treating either display as the truth.
Is a duct differential-pressure sensor useful for diagnosing low refrigerant pressure?
It can provide context about air-side flow or a filter, but it does not measure refrigerant pressure. Its tubing and calibration need their own checks. A low airflow condition can influence refrigeration behavior without making the two pressures interchangeable.
What should be saved from an abnormal event?
Preserve the pressure and temperature trends with timestamps, units, sensor health status, equipment mode and relevant fan/pump/compressor commands. Note the physical point and any independent comparison. That record supports a qualified diagnosis after the transient has passed.
Pressure is most powerful when it is located, referenced, paired and contextualized. Those four steps turn a display value into a defensible piece of HVAC evidence and prevent a familiar “low/high pressure” chart from outrunning the actual measurement.

How to Read A2L Refrigerant Detection Documentation
Read A2L detector data sheets, component approvals, control-system evidence and appliance instructions as one traceable detection and mitigation chain.
Per saperne di più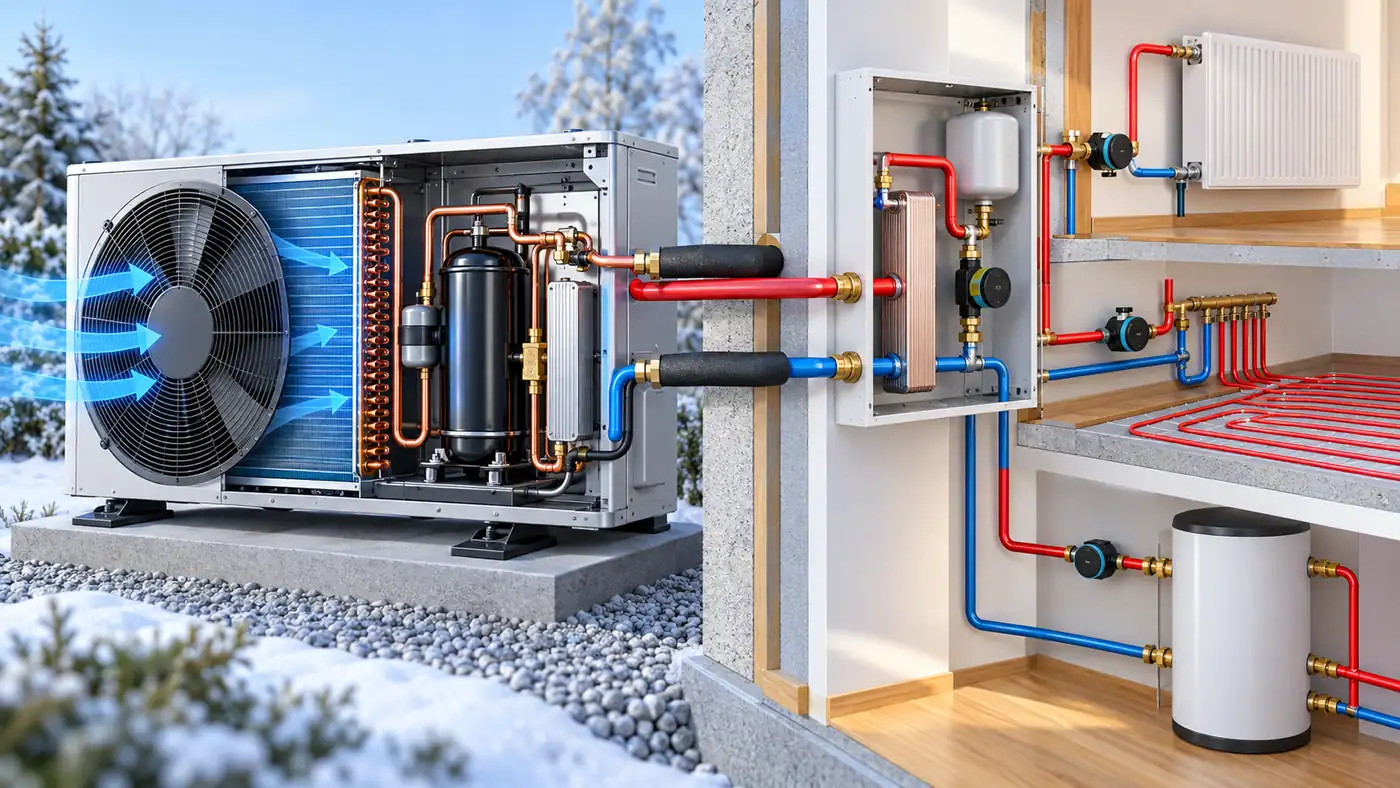
Which Sensors Does a Heat Pump Need for Useful Monitoring?
Choose heat-pump temperature, flow, electrical, pressure and refrigerant-safety measurements by system type and the decision each channel supports.
Per saperne di più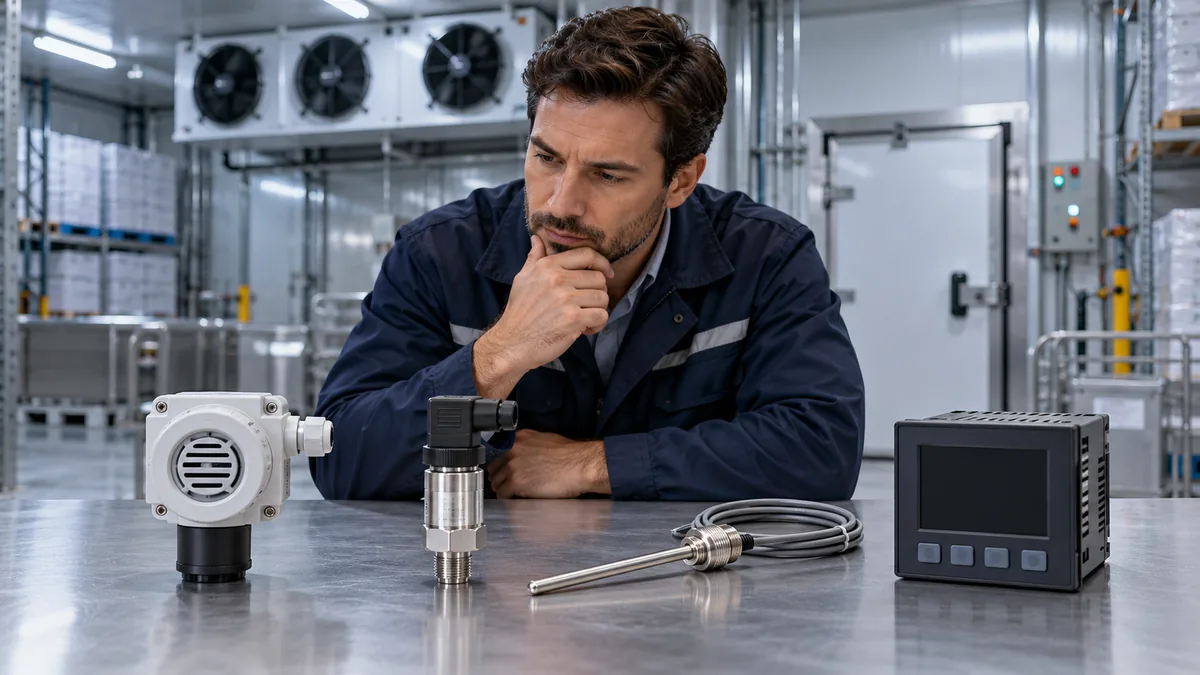
Cosa dovrebbe includere un foglio di lavoro per l'approvvigionamento del monitoraggio della refrigerazione?
Utilizza un foglio di lavoro per gli appalti basato sulle decisioni per confrontare il monitoraggio del processo di refrigerazione, delle celle frigorifere e del gas ambientale con prove verificabili.
Per saperne di più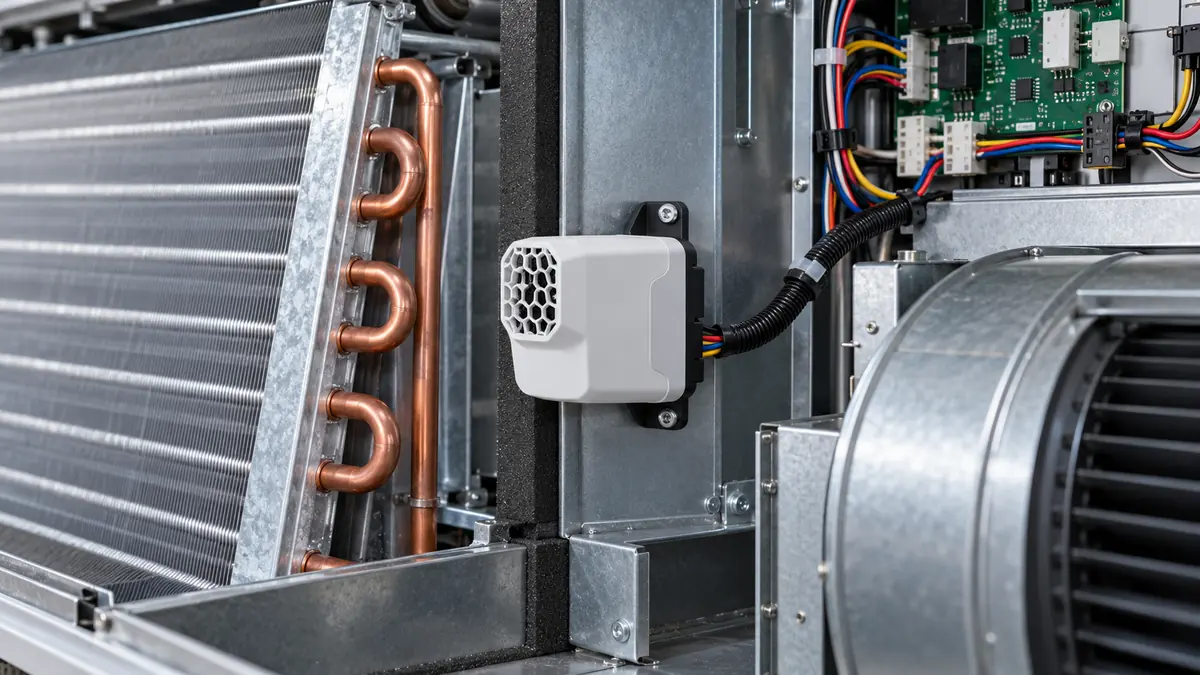
Come dovrebbe essere integrato un modulo di rilevamento del refrigerante nelle apparecchiature HVAC?
Integra i moduli di rilevamento del refrigerante con il giusto profilo di gas, posizione di ingresso, interfaccia monitorata, risposta ai guasti e convalida dell'intero sistema.
Per saperne di più
Un altro gas può attivare un rilevatore di refrigerante? Lettura delle affermazioni sulla sensibilità incrociata
Comprendere la sensibilità incrociata del rilevatore di refrigerante, confrontare le prove NDIR e MOS e leggere le dichiarazioni di interferenza del gas senza ignorare un allarme reale.
Per saperne di più
Cosa dovrebbe essere registrato nel registro di monitoraggio del gas di una centrale di refrigerazione?
Crea un utile registro dei gas della sala impianti registrando l'identità del rilevatore, la configurazione, gli allarmi, i guasti, la risposta alla ventilazione e le prove di manutenzione.
Per saperne di più