
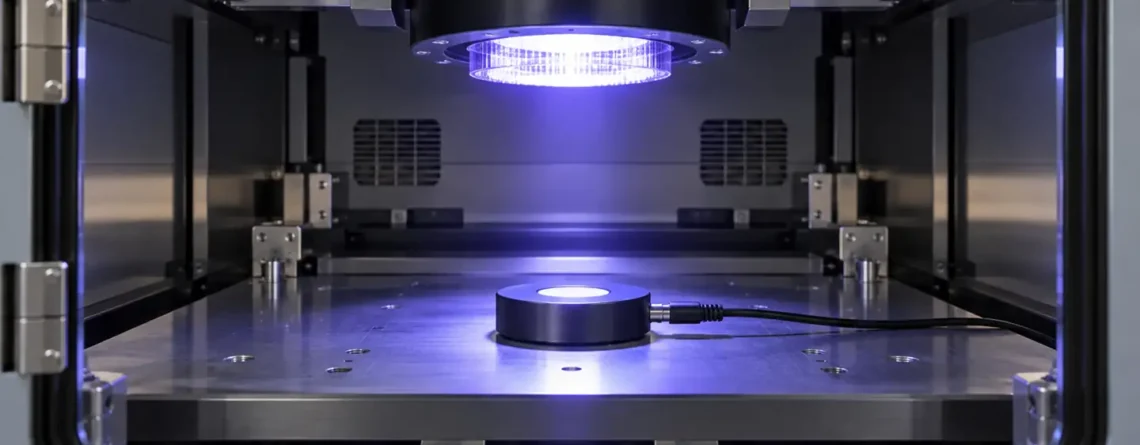
Choose a UV sensor by the source spectrum, the quantity you need to report, the expected intensity and the measurement geometry. A sensor designed to estimate solar UV index does not necessarily measure a UV curing lamp correctly, and an instrument labeled “UVC” does not by itself establish whether a disinfection process is effective. Ask for the detector's full spectral response, calibration conditions and usable range before comparing displayed readings.
The useful question is not simply whether an instrument detects ultraviolet radiation. It is whether the complete sensor, optical window, filter and calibration respond appropriately to the radiation at the measurement location. This guide follows those choices from the source to the reported value.
Define what the reading must represent
UV radiation covers a range of wavelengths. Common categories are UVA, UVB and UVC, but a category label alone is too broad to define an instrument's response. Two lamps in the same named band may have different spectral distributions, and two instruments labeled for that band can weight those distributions differently. Record the actual source type and available spectral information, including whether it is a narrow-band LED or a broadband lamp.
| 測定タスク | Quantity to define | Main selection issue |
|---|---|---|
| Solar exposure monitoring | Erythemally weighted irradiance or a specified UV index measurement. | The detector and algorithm must approximate the relevant weighting under the intended solar conditions. |
| UV curing process | Irradiance and/or radiant exposure at the process plane, within a specified band. | Match the sensor's spectral response and geometry to the lamp, optics and workpiece. |
| UV source trend | A repeatable reading at a fixed location and configuration. | Distinguish a useful relative trend from an absolute, traceable irradiance measurement. |
| Laboratory spectral characterization | Spectral irradiance across defined wavelengths. | Spectral resolution, calibration and stray-light performance must suit the source. |
Before selecting hardware, write down the source, wavelengths, expected signal, measurement position, sensor orientation, exposure duration and the decision that follows the result. Specify whether the output will compare one lamp with another, verify a process trend, or support a formal measurement procedure. Each requires a different degree of spectral and calibration control.
Irradiance, radiant exposure and UV index are different
Irradiance is radiant power incident per unit area, often reported in W/m² or mW/cm² for a stated spectral band and measurement plane. Radiant exposure is irradiance integrated over time, commonly expressed in J/m² or J/cm². For constant irradiance over a stated time, exposure equals irradiance multiplied by time; real process exposure may vary as the source, sensor or workpiece moves.
For example, an idealized constant irradiance of 10 mW/cm² maintained for 5 seconds gives 50 mJ/cm² of radiant exposure. This arithmetic assumes the irradiance stays constant at the relevant plane and the instrument responds to the relevant wavelengths. It is not a recommended process dose or evidence that any biological or curing outcome has been achieved.
の UV index is associated with erythemally weighted ultraviolet irradiance and is used to communicate the strength of sunburn-producing solar UV. It is not a direct measure of all ultraviolet energy and should not be treated as a UVC process reading. The World Health Organization's UV index explanation describes its public-health role. The Silicon Labs Si1133 design guide shows how spectral weighting enters the design of a particular UV-index sensor; its implementation is model-specific.
Why the source spectrum must match the sensor
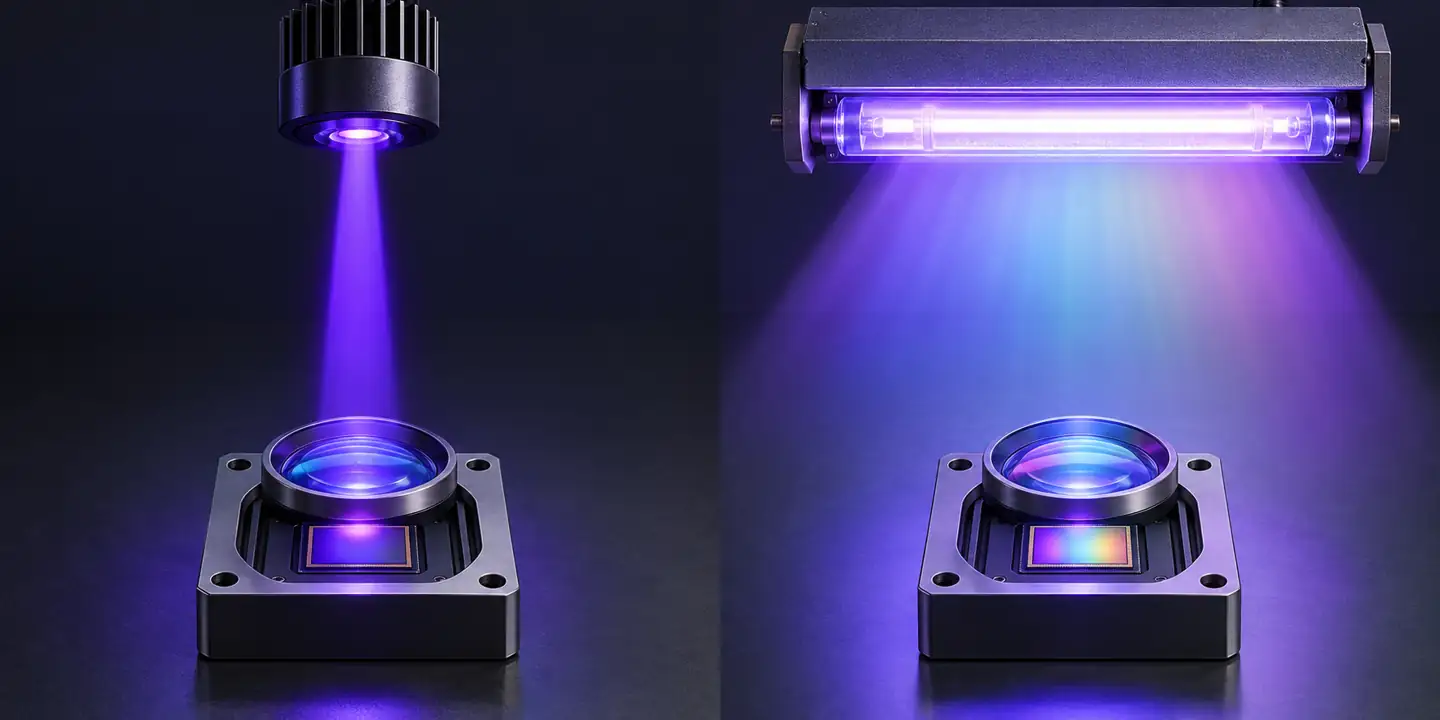
A broadband UV detector produces a signal from radiation across the wavelengths to which its detector and filter respond. Its output therefore depends on both the incoming spectrum and the instrument's spectral responsivity. If a sensor is calibrated with one lamp and used with an LED whose emission is concentrated at a different wavelength, the calibration factor may no longer give the same accuracy. A nominal band name does not reveal the shape of the response within that band.
の NIST work on standardizing UV LED measurements describes significant errors that can arise from spectral mismatch in filtered detectors. The size and direction of the error depend on the actual source and instrument. Request a spectral-response curve, calibration source description and uncertainty statement for the sensor, then compare them with the source being measured.
For a narrow-band UV LED, ask whether the sensor response is known at the LED's actual emission wavelengths and operating conditions. For a broadband source, determine whether the response is sufficiently uniform or correctly weighted across the relevant spectrum. If two instruments disagree, compare their spectral response, measurement plane, angle and integration interval before assuming one is faulty.
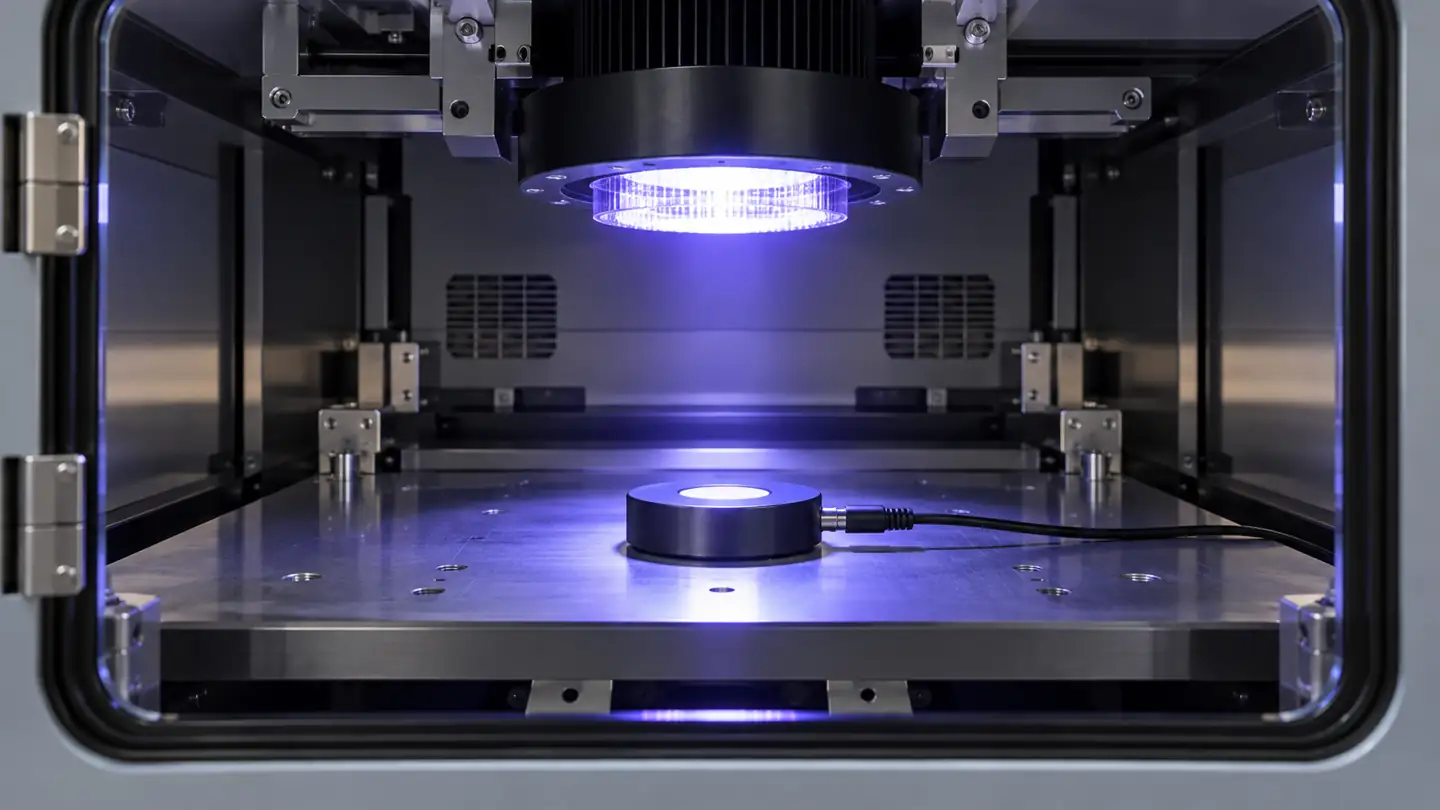
Choose the measurement method
A filtered photodiode radiometer converts incident radiation into an electrical signal and reports a value over a defined spectral response. It can be compact and convenient for repeated measurements, but the filter, detector and calibration define what the reading means. A photodiode component on a circuit board is not automatically a calibrated radiometer: the amplifier, enclosure, window, temperature behavior and algorithm all affect the result.
A spectroradiometer separates radiation by wavelength and reports a spectrum rather than only one band-integrated value. It can help identify source peaks or assess spectral mismatch. Its spectral resolution, wavelength calibration, stray-light performance, dynamic range and measurement geometry must fit the task. A spectrum is more detailed than a single broadband reading, but it is not automatically free of measurement uncertainty.
A relative monitor may be useful for following the output of one fixed source over time. It should be described as relative if its absolute response to the relevant source has not been established. Record the sensor position and operating conditions so that a change in setup does not masquerade as lamp aging. A stable relative trend and a traceable absolute measurement answer different questions.
| Instrument or output | こんなときに便利です | Check before use |
|---|---|---|
| Filtered broadband UV radiometer | A defined band or weighted response is needed repeatedly. | Actual spectral and angular response, calibration source and range. |
| Spectroradiometer | Source spectrum or wavelength-dependent assessment is required. | Spectral range, bandwidth, calibration and stray-light behavior. |
| Integrated UV-index sensor | An instrument estimates solar UV index for its intended optical design. | Algorithm, window transmission and validation for the installed device. |
| Relative process monitor | Following change in a stable setup is the main goal. | Reproducibility, location and a documented relationship to the process. |
の CIE description of UV radiometer calibration notes that instruments can have different spectral ranges and weighting functions. Choose the calibration method and conditions that correspond to the quantity the instrument is meant to report.
The measurement plane and angle matter
The irradiance at a sensor depends on its position and orientation relative to the source. A process measurement should be made at a defined plane that represents the workpiece or monitoring point, subject to equipment design and the instrument's instructions. Moving a probe closer to a source, tilting its receiving surface or placing it behind a window can change the result. A large-area source, reflected light and nonuniform illumination make a simple point-source distance calculation an unreliable substitute for measurement.
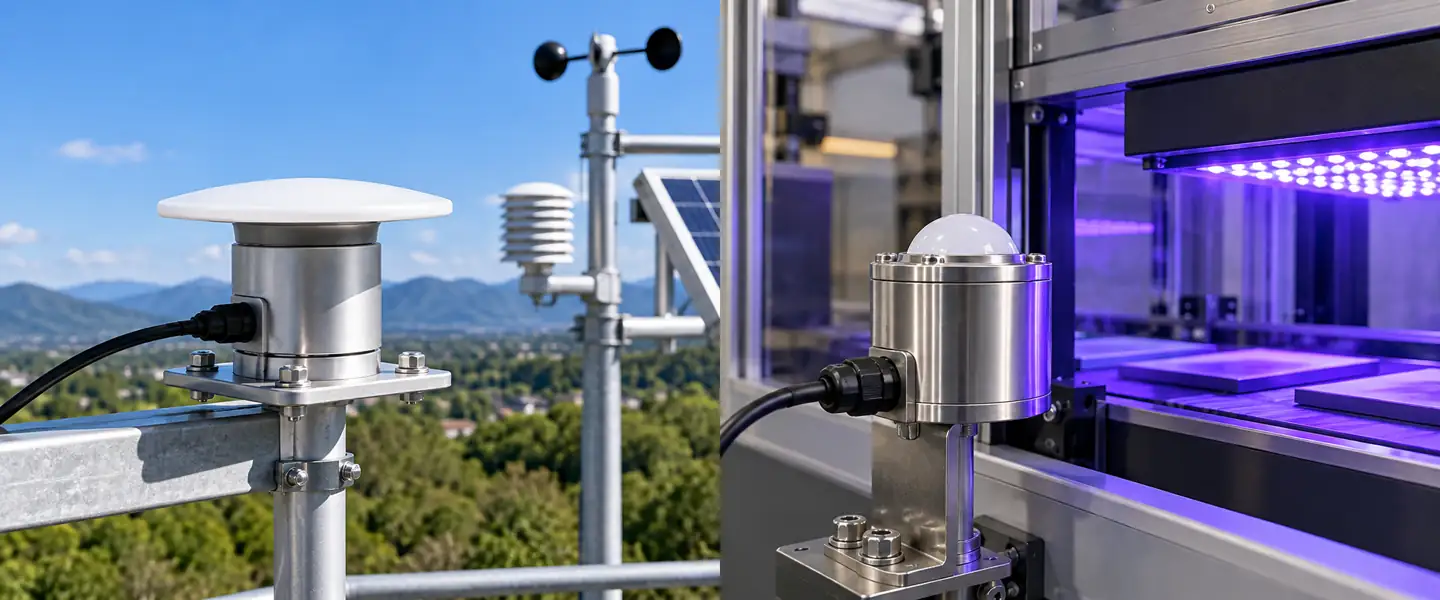
For an ideal flat irradiance receiver, response to a parallel beam varies with the cosine of the angle of incidence. Real diffuser and sensor assemblies deviate from that ideal, particularly at large angles. Check the stated angular or cosine response when measuring sunlight, extended sources or light arriving from several directions. A comparison made with two devices at different angles may reveal a geometry difference rather than a defective detector.
Record the measurement position, orientation, any enclosure or window, source warm-up state, distance where relevant and the operating setting. If the optical window is replaced, its transmission may change the system response. A material that looks transparent to the eye is not necessarily transparent across the UV wavelengths of interest. Assess the complete installed optical path, not the detector alone.
Avoid saturation, dark offsets and stray light
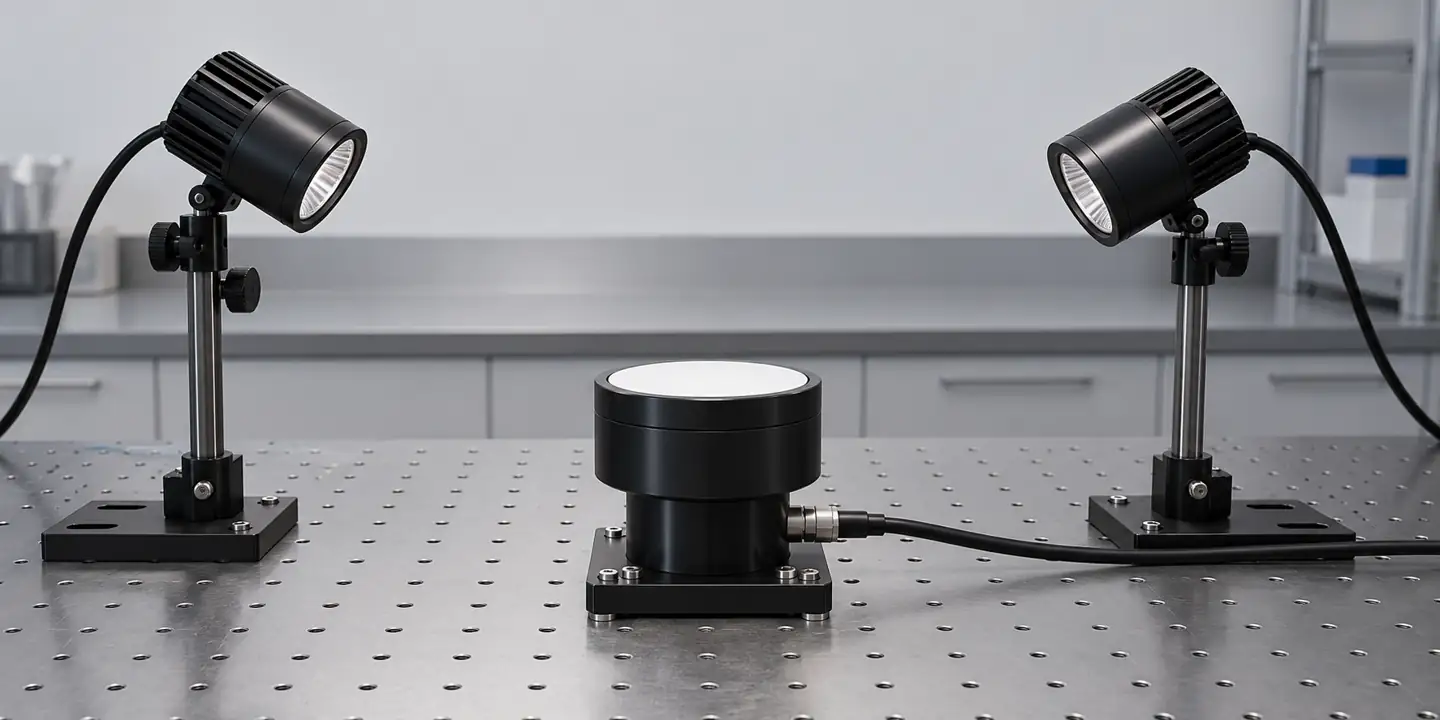
The expected maximum irradiance must fit within the instrument's calibrated measuring range. A saturated photodiode, amplifier or ADC can produce a clipped, flat or misleadingly plausible result. Conversely, at very low signal levels, dark current, electronic offset, noise and stray light may be a meaningful fraction of the reading. Check the datasheet's range, detection limits and conditions instead of equating display resolution with accuracy.
Some devices change gain or integration time automatically. Confirm whether the transition affects output continuity and whether the instrument flags overload or under-range conditions. If a UV source is pulsed or moving relative to the sensor, the measurement bandwidth and logging interval must capture the relevant time profile. An averaged reading can conceal a short peak; a peak reading alone may not provide the time integral needed for exposure.
Visible or infrared radiation can also contribute to a reading if rejection is insufficient for the source. The degree of interference depends on the filter, source spectrum and instrument design. Avoid assuming that every UV-labeled photodiode has perfect rejection of all other wavelengths. The NIST review of UV measurement errors discusses spectral and geometric factors that influence comparability.
Temperature and time response
The temperature of the detector and its electronics can change sensitivity, dark signal or gain. A measurement near a hot source may be affected even when the UV source itself is stable. Ask whether the accuracy specification includes temperature over the expected operating range and whether the instrument reports its internal temperature. Protect the instrument from temperatures outside its rating and allow any specified stabilization time.
For a conveyor or pulsed source, consider how quickly the instrument responds and how often it samples. A sensor can have an adequate wavelength range but miss a short peak if its integration time is long. Conversely, a short noisy sample may be a poor representation of a steady average. The intended statistic—peak irradiance, average irradiance or integrated exposure—determines the response and timing needed.
The sensor and any data logger must agree about the interval over which an exposure is accumulated. If a source moves across a workpiece, the position and speed change the illumination profile. Measure or validate the setup under representative operating conditions rather than assuming the intensity at one stationary point describes the whole process.
Calibration and verification
Calibration relates the instrument output to a reference under documented conditions; verification checks whether it remains suitable for use. A calibration certificate is most useful when it identifies the measured quantity, spectral band or responsivity, source, geometry, range, uncertainty and traceability. A certificate issued for a different source spectrum or measurement configuration does not automatically characterize all applications.
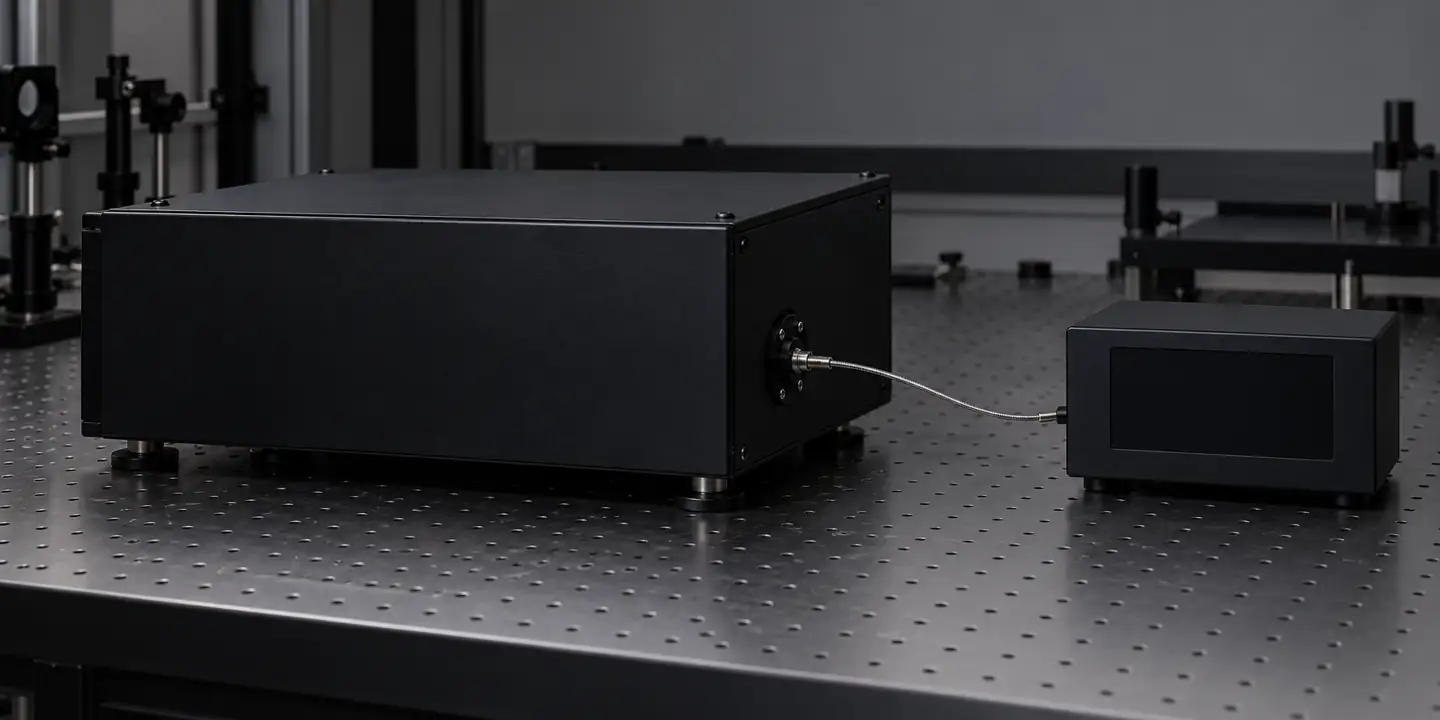
Before comparing an instrument with a reference, align the measurement plane, orientation, source condition and timing. The reference should have suitable uncertainty and spectral coverage for the intended use. Record the as-found reading before adjustment and the as-left reading afterward, together with the sensor configuration and environmental conditions. A stable response to a check source is helpful, but it does not independently demonstrate the full spectral response over every wavelength.
Set the verification interval using the manufacturer's instructions, the measurement program, conditions of use and observed drift. UV exposure can affect some optical materials over time; contamination or damage to the window can also alter response. Inspect and clean only as permitted by the manufacturer. Replacing a window, diffuser or detector can change calibration and should be documented.
Compare readings without hiding the conditions
If two radiometers read differently, first check that they report the same quantity, units and spectral weighting. Next compare the source, exposure plane, angle, optical window, range, timing and calibration source. A sensor reporting peak irradiance and one reporting an average over an interval are not directly comparable even when both use the same unit. Likewise, two broadband sensors may agree for one lamp and differ for an LED with a different spectral peak.
Do not apply a universal correction factor based on one comparison unless a qualified method supports it for the source and conditions. Keep the original readings and the correction method in the record. Reassess the relationship when the source type, filters, measurement geometry or instrument changes.
What to request on a calibration record
Ask which quantity and spectral response were calibrated, the wavelength coverage, the source used and the measurement geometry. Check whether the certificate covers the entire instrument, including the diffuser and any window, or only a detector component. Confirm the uncertainty statement and the range of values over which it applies. A certificate number by itself does not describe whether the calibration matches a particular application.
For a UV LED, compare the LED's emission spectrum with the calibrated responsivity and the instrument's spectral response. Some applications need a source-matched calibration or a spectral-mismatch assessment. The method depends on the available data and the uncertainty target; a user should not invent an adjustment from a nominal peak wavelength alone. Temperature, aging and drive conditions can affect the source spectrum, so preserve the operating conditions used for the comparison.
Maintain a simple record of the instrument identifier, firmware or gain setting, calibration date, window condition and results of routine checks. If a reading changes after a sensor is repaired or a filter is replaced, annotate the time series. A traceable reference, a repeatable measurement position and a service history together are more informative than a single certificate filed without operating context.
A selection worksheet for three applications
Solar UV monitoring. Define whether the desired output is UV index, spectral irradiance or another weighted quantity. The instrument's spectral response, diffuser, orientation and algorithm all matter. A sensor placed behind a cover must be evaluated with that cover in place. A weather display should label estimated and measured quantities clearly.
UV curing. Define the source spectrum, irradiance band, workpiece plane, exposure time and the purpose of the reading. A process may depend on both peak irradiance and accumulated exposure, as well as the material and process conditions. A radiometer can help monitor the optical process but a single reading does not by itself prove the final coating's performance. Use process-specific validation and testing.
UVC source monitoring. Identify the actual source spectrum and measurement geometry, and select an instrument intended and calibrated for that task. A sensor reading is one input to a broader system evaluation; it does not by itself establish delivered dose throughout a space or demonstrate pathogen inactivation. Follow the applicable equipment and measurement procedures for the particular installation.
Questions for a sensor supplier
Provide the source type, measured or expected spectrum, measurement distance and orientation, intensity range and the reporting quantity. Ask the supplier which portion of the instrument's response contributes to the displayed result and whether visible light or infrared from that source can affect it. Request the spectral-response curve for the complete instrument, not just a detector-material description.
State whether the device must measure continuously or only during a periodic check. For continuous operation, ask about drift, window contamination, ambient temperature, output status and what the controller receives during a fault. For a portable radiometer, ask about repeatable positioning, measurement interval and how the instrument records peak or integrated values.
If the instrument will be compared with another meter, share both instruments' calibration conditions and intended source. A supplier may be able to explain which differences are expected and which tests are needed. Request a documented uncertainty for the actual configuration where available; an isolated best-case specification at a different wavelength or geometry does not describe the entire process measurement.
Keep the optical setup consistent
A practical measurement record includes a diagram or photograph showing the sensor, source, measurement plane and orientation. Note the source operating setting, warm-up conditions, any filters, windows and fixtures, and the sample or workpiece position. If the instrument is moved or a source is replaced, record the change before comparing values from different dates.
Where a source illuminates an area unevenly, one measurement position may not represent the entire useful area. A survey at multiple predefined points can reveal spatial variation, but its point spacing and interpretation should be designed for the process. Preserve individual readings and their positions rather than reducing the survey to a single unexplained average. If the sensor has a finite aperture, account for the area and angle it actually receives.
Routine checks are most informative when made under repeatable conditions. A lower reading might come from lamp aging, a changed measurement position, window contamination, temperature, electronics drift or a combination. Compare a known check condition and inspect the optical path before adjusting the instrument. Keep the as-found result so the history remains useful after maintenance.
Understand the value of a process baseline
For an existing installation, establish a baseline when the source, optics and workpiece arrangement are in a known condition. Record multiple measurements at defined positions and identify the normal variation caused by warm-up, power setting, source movement and repeat positioning. A later measurement can then be interpreted against the same conditions. A baseline is a reference for the local process; it is not automatically transferable to a different source or production line.
When the process uses several lamps or LEDs, a combined reading may hide the failure or degradation of one part of the source. The measurement plan may need several positions or independently monitored zones. The appropriate coverage depends on the optics and the decision. If a change is detected, compare it with source diagnostics and the condition of reflectors, windows and fixtures rather than immediately changing the radiometer's calibration.
Where readings are logged automatically, retain the timestamp, sensor identifier, selected range and any invalid or overload status. Do not replace missing data with zero irradiance without clearly indicating that the sensor was unavailable. A record of measurement conditions gives operators a way to distinguish an actual source change from an instrument or data-path problem.
Troubleshooting a UV measurement
| 観察 | Questions to investigate | Evidence to retain |
|---|---|---|
| Two meters disagree on an LED source | Are spectral responses and calibration sources compatible? | Source spectrum, meter models and calibration records. |
| Reading drops over time | Did the source change, or is the sensor window contaminated? | Source operating state, inspection and reference-check history. |
| Reading stays at an apparent maximum | Is the sensor or electronics saturated? | Range, overload flag and a suitable lower-signal check. |
| Outdoor reading changes after a cover is fitted | Does the cover transmit the relevant wavelengths and affect angle response? | Cover material, geometry and before/after comparison. |
| Exposure differs from irradiance × time | Was irradiance constant, and were both quantities integrated over the same interval? | Time profile, integration settings and units. |
よくある質問
Can a generic UVA sensor measure UV index?
Not reliably by simply converting its UVA reading. UV index uses an erythemal weighting across relevant solar wavelengths. An instrument needs an appropriate spectral response or validated algorithm for the intended conditions.
Is UV dose the same as irradiance?
No. Irradiance is power per unit area; radiant exposure is its time integral. The term dose can have application-specific meanings, so define the quantity, spectral weighting and units.
Why can two sensors in the same UV band disagree?
Their spectral responses, source calibration, angular responses, measurement locations and integration settings can differ. A shared UVA or UVC label is insufficient to establish equivalence.
Does a UVC reading prove a disinfection system works?
No. An instrument measures a defined optical quantity at its location. Effectiveness depends on the delivered exposure in the actual system and the validated process conditions.
Does a higher display resolution mean higher accuracy?
No. Resolution is the smallest displayed increment. Spectral mismatch, calibration uncertainty, geometry, drift, noise and saturation can dominate the total error.
When is a spectroradiometer useful?
It is useful when the source spectrum or wavelength-dependent response must be examined. Its own spectral range, resolution, calibration and stray-light limits must fit the measurement.







返信を残す