

Read a manufacturer sensor comparison report as a claim with a defined scope: particular specimens, a reference, a test environment, a data-processing method and a stated decision. A useful report lets you reconstruct those elements and determine whether they resemble your application. A low average error or impressive correlation does not establish universal superiority, and a manufacturer's commercial interest does not automatically invalidate carefully documented evidence.

A fair comparison identifies both sensor systems and the reference; the equipment arrangement is conceptual.
Start by writing the report's actual conclusion in one sentence, including its limitations. “These three units agreed with this reference during this fixed-site deployment using hourly averages” is a claim you can evaluate. “This technology is the most accurate” is incomplete until the comparison conditions are supplied. The purpose of the review is to identify what the evidence supports and what remains an assumption before choosing equipment or repeating a result.
What decision is the comparison meant to support?
A comparison can address absolute concentration accuracy, tracking of changes, response to a short event, long-term drift, availability, interference or power consumption. These are different questions. A device that produces a useful daily trend may miss a short peak. A rapidly responding instrument may be noisy at low concentrations. A tightly corrected field dataset may not represent the performance of the same device with its factory settings.
Write down the intended task before examining which product appears to win. Identify the gas or particle quantity, relevant range, required time resolution, environmental conditions and consequences of an unavailable or wrong result. This does not require inventing an acceptance threshold. It requires establishing which thresholds and requirements actually govern the application, so the report can be compared with them.
| Application question | Evidence that helps answer it | 一般的な不完全代替品 |
|---|---|---|
| Does it measure concentration adequately near my decision range? | Paired error and uncertainty in that range | Whole-dataset correlation |
| Does it detect a changing event promptly? | Defined dynamic test and installed response | Hourly averaged agreement |
| Will production units behave consistently? | Multiple independently identified units | One selected prototype |
| Does a correction transfer to a new site? | Independent validation at the new conditions | Fit to the original training data |
| Will usable data be available? | Expected records, valid records and failure reasons | Error statistics after invalid data disappear |
の EPA performance-target and testing-protocol resources are a useful example of stating an application before selecting metrics. Their specified context is non-regulatory supplemental and informational monitoring in ambient outdoor fixed-site applications. They are not a universal approval procedure for industrial gas detectors, personal protective instruments or every indoor sensor.
Which product and which specimens were actually tested?
Record manufacturer, exact model, sensing module, hardware revision, firmware and processing configuration. Distinguish a development board from a finished monitor and an individual sensing element from an installed sampling system. An accessory can alter response or environmental exposure. A controller can introduce scaling, filtering or communication behavior that does not belong to the sensing element alone.
A report should state the number of physical units, their selection method and whether results are shown individually or pooled. Ten thousand readings from one unit remain observations of one unit. They do not demonstrate the variability of ten thousand units. Conversely, three units exposed to the same environment provide replication across specimens, but they do not independently replicate the weather, site or concentration history.
Ask whether all planned units remained in the report. A sensor that failed communication, saturated or needed replacement is part of an availability assessment even if no concentration value exists during the failure. Replacement can be legitimate, but the identity and timing should remain visible. A report that silently substitutes a better unit changes what “the tested sensor” means.
Product names alone can conceal important changes. A firmware update may alter baseline correction or temperature compensation without changing the enclosure. If an old report is used for a current purchase, compare the tested configuration with the supplied configuration. The appropriate conclusion may be that the report is relevant historical evidence while a specific update still needs verification.
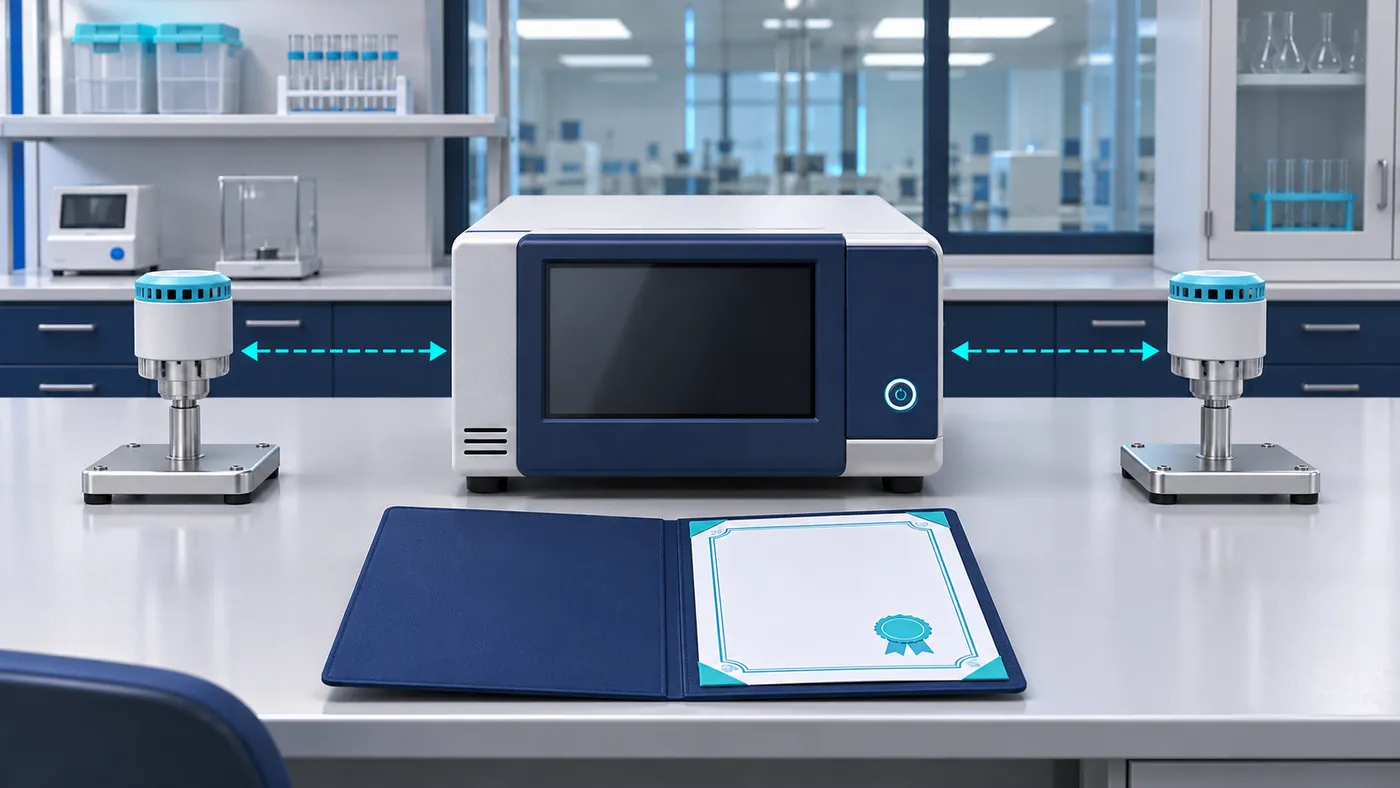
A reference has its own calibration, uncertainty and sampling conditions; equal placement alone is insufficient.
What makes the reference credible?
Identify the reference instrument or material, its measurement principle, calibration status, relevant range and uncertainty. The word reference describes its role in the test; it does not make its value exact. A reference suitable for a broad ambient trend comparison may be inadequate for distinguishing two devices whose reported difference is much smaller than the reference uncertainty.
NIST's metrological traceability guidance explains why traceability belongs to a measurement result supported by a documented calibration chain, rather than to a brand label alone. A statement that an analyzer is “NIST traceable” needs supporting documentation and a relevant uncertainty. It is not a claim that NIST has approved the sensor comparison or guarantees its conclusions.
Reference placement also matters. Shared room air is not necessarily an identical sample. A person near one inlet, a vent, unequal tube lengths or different sample conditioning can create real differences between instrument inputs. Before attributing disagreement to a sensor, determine whether the instruments measured the same quantity at a comparable location and time. For reactive gases, the sampling arrangement deserves particular scrutiny.
Calibration of the reference before a campaign establishes one part of the evidence. Checks during and after the campaign can help identify drift or a malfunction. The report should explain how reference downtime and suspect reference data were handled. A sensor should not be penalized for disagreement during an established reference fault, but excluding those periods requires a stated reason and an auditable rule.
Were the test conditions fair and relevant?
Fairness does not always mean identical external settings. Different instruments may require different approved flows, adapters or operating modes. A fair comparison follows each product's applicable instructions and then states the resulting measurement conditions. Forcing all devices to use an unsuitable common setting can create an artificial winner. Allowing one device an undisclosed correction or optimized setup creates a different imbalance.
Look for actual distributions of temperature, humidity, pressure and target concentration, rather than only a sentence saying “normal conditions.” A report can cover a broad calendar interval but a narrow concentration range. A chamber can cover high and low setpoints yet omit the combination of high humidity and low concentration that matters to the intended application. Separate the range tested from the range printed in a product brochure.
Interferents need the same treatment. A sensor that performs well in a clean single-gas test may respond differently in a mixture. The report should identify which interference conditions were actually tested and which were absent or uncontrolled. Absence of an observed interference in one environment is not evidence of immunity to all possible interfering species.
Warmup and equilibration affect fairness. One product may be evaluated after its full specified stabilization while another is scored from its first returned number. Alternatively, a report may exclude a substantial startup period and then claim performance for an intermittently powered application. Both choices can change the conclusion. The conditions should align with the claim rather than merely make the plot look tidy.
How were the clocks, units and averages aligned?
Before interpreting a statistic, inspect the paired-data construction. Record timestamp convention, time zone, logging interval, averaging interval and treatment of incomplete periods. A timestamp can refer to the beginning, end or middle of an averaging window. Two series with the same printed minute can therefore represent different air histories.
Averaging reduces some short-term variation but also removes information about peaks and response. One-minute and one-hour comparisons answer different questions even when they use the same source data. If the product's intended use depends on fast changes, request an analysis at that time scale. A favorable hourly scatter plot should not stand in for a short-event response test.
Time shifting deserves explicit disclosure. Correcting a known logging offset is different from choosing a lag that maximizes agreement after looking at all the data. An optimized lag may help diagnose response behavior, but it also makes the resulting score conditional on that adjustment. Ask whether the same lag was fixed before validation and whether it is available in the actual deployed system.
Units and concentration bases must match. A dry-basis gas result and a wet-basis result are not directly interchangeable. A mass concentration and a mole fraction may require temperature, pressure and molecular information to convert. Two devices labeled ppm may still apply different assumptions or target different chemical definitions. A report should show those decisions, not leave them to a graph legend.
What was excluded, and why?
Data exclusion can improve validity when it removes established reference faults, incomplete windows or periods outside a defined protocol. It becomes misleading when the selection is driven by which points make a product look better. The key questions are whether the rule was defined, applied consistently and accompanied by counts and reasons.
Ask for a flow of expected records to available records to paired records to retained records. Keep separate categories for sensor unavailability, reference unavailability, warmup, out-of-range conditions and analysis exclusions. A single “valid data percentage” may combine very different failure modes. A device can have excellent retained-data accuracy while being unavailable whenever the environment is most demanding.
| Selection decision | Acceptable explanation to look for | Unresolved concern |
|---|---|---|
| Remove a reference fault period | Independent fault evidence and timestamps | Was the period selected from disagreement alone? |
| Exclude startup | Documented intended operating mode | Does the claimed application include frequent restarts? |
| Remove outliers | Predefined physical or statistical rule | Were only one product's large errors removed? |
| Use a concentration subset | Explicit application range | Does the headline imply the whole range? |
| Replace a unit | Documented failure and replacement identity | Are the failed unit and downtime still reported? |
A retained dataset should be reproducible from the stated rules. Raw data may not always be publicly available, but a report can still provide the method, counts and sensitivity analyses. If changing a reasonable exclusion rule reverses the product ranking, that sensitivity belongs in the conclusion. It is evidence about the robustness of the ranking, not an inconvenience to conceal.

Unscaled conceptual data illustrate error review, not results from any tested sensor.
Which statistics answer which question?
For paired observations, define error as sensor minus reference. Mean error, often called bias in a descriptive comparison, indicates the average signed difference in the retained data. Positive and negative errors can cancel. Mean absolute error, or MAE, averages the magnitudes. Root mean square error, or RMSE, squares the errors before averaging and taking the square root, so larger errors have more influence.
Correlation describes association and is sensitive to the range and variation present. A sensor can track every change while remaining consistently high. A regression slope near one does not remove an intercept error; an intercept near zero does not remove a slope error. If R² is reported, ask which definition and model were used. Squared Pearson correlation and a prediction-based coefficient of determination are not interchangeable in every analysis.
The original research article “Air pollution measurement errors: is your data fit for purpose?” examines why agreement assessments need to match the intended use and why an overall metric can hide different error structures. For a purchasing review, the practical extension is to inspect residuals by concentration, time and important environmental conditions rather than relying on one global number.
NIST Technical Note 1297 provides the uncertainty vocabulary behind measurement evaluation. Do not treat a sample standard deviation, an accuracy limit and an expanded uncertainty as equivalent quantities. A report should state what an uncertainty interval represents and what coverage factor or method was used. An unexplained plus/minus value cannot support a precise comparison.
What does a checked hypothetical comparison reveal?
The following numbers are invented solely to demonstrate the calculations. They are not measurements from a commercial sensor. Assume five paired concentrations with identical units and basis, and no uncertainty analysis. Sensor A always reads 20 ppm above the reference. Sensor B has smaller absolute errors that change sign.
| Reference, ppm | Sensor A, ppm | A minus reference, ppm | Sensor B, ppm | B minus reference, ppm |
|---|---|---|---|---|
| 400 | 420 | +20 | 405 | +5 |
| 600 | 620 | +20 | 590 | −10 |
| 800 | 820 | +20 | 815 | +15 |
| 1000 | 1020 | +20 | 990 | −10 |
| 1200 | 1220 | +20 | 1200 | 0 |
For A, mean error = 100/5 = +20 ppm. MAE = 100/5 = 20 ppm. RMSE = √(2000/5) = 20 ppm. A also has a perfect positive linear association with the reference: adding a constant does not change Pearson correlation. That perfect tracking does not remove the 20 ppm offset.
For B, the signed errors sum to zero, so mean error is 0 ppm. The absolute errors sum to 40, so MAE is 8 ppm. The squared errors sum to 450, so RMSE = √90 = approximately 9.49 ppm. Zero mean error does not mean every observation is correct; the table contains errors as large as 15 ppm.
Within this fictional retained dataset, B has lower MAE and RMSE, while A's behavior is a simple constant offset. That does not prove B will be preferable at another site, near a particular alarm threshold or after aging. Nor does it establish which device can be adjusted appropriately. The example demonstrates why the chosen metric and the claim must be stated together.
Now imagine the last two B observations were unavailable. The retained B errors would be +5, −10 and +15 ppm. Its mean error would become 10/3, approximately +3.33 ppm; its MAE would be 10 ppm; its RMSE would be √(350/3), approximately 10.80 ppm. The device has not changed in this thought experiment. The retained sample and availability have changed, and both facts should appear in the review.

Repeated observations from one specimen do not replace replication across physical units.
Was the correction trained on the same data used for the score?
A manufacturer may present raw output, factory-calibrated output, a local correction or a cloud model. Each can be legitimate, but they are different products of the measurement chain. The report should identify exactly which output was scored and which processing is included in the purchased system.
A correction fitted and evaluated on the same observations can describe those observations very well without predicting new conditions. Separate training, tuning and validation data. For time-dependent environmental measurements, randomly mixing adjacent records across sets can leave very similar conditions on both sides. An independent time period, site or set of units can address a broader transfer question, depending on the claim.
Ask what happens after installation. Does the algorithm require a local reference campaign, periodic retraining, a reliable connection or environmental inputs from another sensor? Are those costs and dependencies included in the comparison? A report about a locally corrected dataset should not be read as evidence that an uncorrected stand-alone module will deliver the same result.
Software changes also need a version. A cloud output can be revised after the hardware test, potentially changing the effective instrument. Preserve the model version, processing date and correction coefficients relevant to the report. If the supplier cannot reproduce the historical output, treat long-term comparability as an unresolved operational question.
How should commercial interests affect your confidence?
Identify who funded the work, selected the devices, operated the test, processed the data and approved the report. A third-party laboratory can perform a manufacturer-funded test competently; the funding alone does not determine the result. Independence is stronger when selection rules, methods, data and limitations can be inspected and the laboratory's actual scope is clear.
Beware of replacing evidence with labels. “Independent,” “certified,” “laboratory tested” and “reference grade” need a named organization, scope and document. The EPA FAQ for its performance-testing reports explicitly states that testing results do not constitute EPA certification or endorsement. A report that follows a published protocol should describe that fact accurately instead of implying a broader agency approval.
A fair report should also describe the competing product's settings and limitations with the same care as its own. If one device's worst mode is compared with another's optimized mode, the result may still describe those configurations, but the headline should not imply an unconditional product ranking. Ask for the narrower conclusion supported by the actual comparison.
What should your review record contain?
Use a short review sheet that links each conclusion to the supporting page, table or dataset. Mark missing evidence separately from demonstrated failure. “Reference uncertainty not reported” is an information gap; “reference uncertainty exceeds the decision margin” is a different finding that requires a value and a decision criterion.
| Review field | Minimum useful entry |
|---|---|
| Intended application | Quantity, range, time scale, environment and decision |
| Tested system | Model, units, firmware, accessories and processing |
| 参照 | Identity, calibration evidence, uncertainty and sample arrangement |
| 条件 | Actual ranges and combinations encountered |
| Data handling | Synchronization, averaging, exclusions and availability |
| Results | Per-unit errors, relevant range, dynamics and uncertainty meaning |
| Interests | Funding, operation, analysis and approval roles |
| Transfer limits | Conditions and configurations not represented |
| 決断 | Accept evidence for a stated purpose, request clarification or test further |
A useful final review sentence might read: “The report supports hourly trend comparison in the tested outdoor range, but it does not establish short-event response or performance of the current firmware.” That sentence identifies both value and boundary. It is more actionable than either accepting every marketing claim or dismissing the entire report because it came from a supplier.

Retained records and exclusions both belong in a review of the evidence.
How do you compare two reports without inventing a league table?
Create a common-evidence matrix before ranking products. Put the intended measurement questions in rows and each report in a column. For every cell, record whether the report contains relevant evidence, partially relevant evidence or no evidence, with a page reference. This avoids treating a missing dynamic test as a failed dynamic test or a missing humidity range as proof of poor humidity performance.
Where both reports provide comparable data, state the common scope explicitly. For example, both may support hourly agreement in a shared middle concentration range but differ in extreme conditions, processing and specimen count. The common range can support a limited comparison. The remaining evidence should be discussed separately because it addresses different questions. Do not normalize away important differences simply to produce one score.
A procurement team can then request the smallest additional evidence that resolves the decision. If the unresolved issue is response after a power cycle, another long steady-state scatter plot will not help. If the issue is production variability, collecting more records from the same selected unit will not provide the missing replication. Frame the request around the uncertainty in the decision rather than a general demand for more testing.
Keep commercial and technical judgments visible as separate inputs. Cost, maintenance effort, support and integration may justify choosing a device that does not have the smallest retained-data RMSE. That is a legitimate selection decision when the measurement requirements are still met. It becomes misleading only when a broader purchasing preference is rewritten as an unsupported claim of superior accuracy.
The final comparison should remain readable after the report is revised. Record document versions and the configuration proposed for purchase. If a supplier supplies a later firmware report, update the evidence matrix and identify which conclusions changed. This gives the team a controlled basis for selection without pretending that unlike experiments form a universal product ranking.
Which evidence should be requested when a report is incomplete?
Request the missing item that could change the decision. If reference credibility is unclear, ask for instrument identity, relevant calibration evidence and uncertainty. If a ranking depends on one environmental corner, ask for the errors and valid-data counts in that corner. If replication is unclear, ask for unit-specific results and the specimen-selection method. A focused request is easier to answer and review than a demand for every possible document.
Record the response alongside the original report rather than relying on a sales conversation. A useful clarification identifies which figure, version and configuration it addresses. If it changes the meaning of a headline conclusion, retain that narrower interpretation in the selection record. If the information remains unavailable, the appropriate result is a bounded evidence gap, not an invented estimate of performance.
For a consequential selection, unresolved gaps can become requirements for an application-specific evaluation. Define the question and acceptance basis before collecting the new data. That keeps the next comparison connected to the actual decision and avoids another attractive but inconclusive plot.
よくある質問
Is a higher R² always better?
It can indicate closer association under the stated calculation, but it does not by itself establish lower concentration error. Check offset, slope, absolute error, range and availability. A constant positive offset can coexist with perfect correlation.
Does a longer campaign automatically provide stronger evidence?
Only for the conditions actually represented and the data retained. A year with a narrow concentration range does not verify a broad range. A longer campaign can be valuable for drift and availability, but its sample, maintenance and processing history must remain visible.
Can I compare RMSE values from different reports?
Only with attention to quantity, units, concentration distribution, averaging, reference quality and processing. A lower RMSE in an easier environment is not proof of a better sensor in a harder one. Normalized metrics also need their normalization rule stated.
Should every test use identical gas-delivery settings?
Each device should be used according to its approved requirements. The report should explain any differences and their implications. Identical settings that violate one product's instructions are not an automatically fair comparison.
What is the strongest warning sign in a comparison report?
A conclusion that cannot be traced back to identified specimens, paired data, conditions and a reproducible method. Missing details are a reason to narrow the conclusion and request evidence. They do not establish that the undisclosed result must be false.




返信を残す