
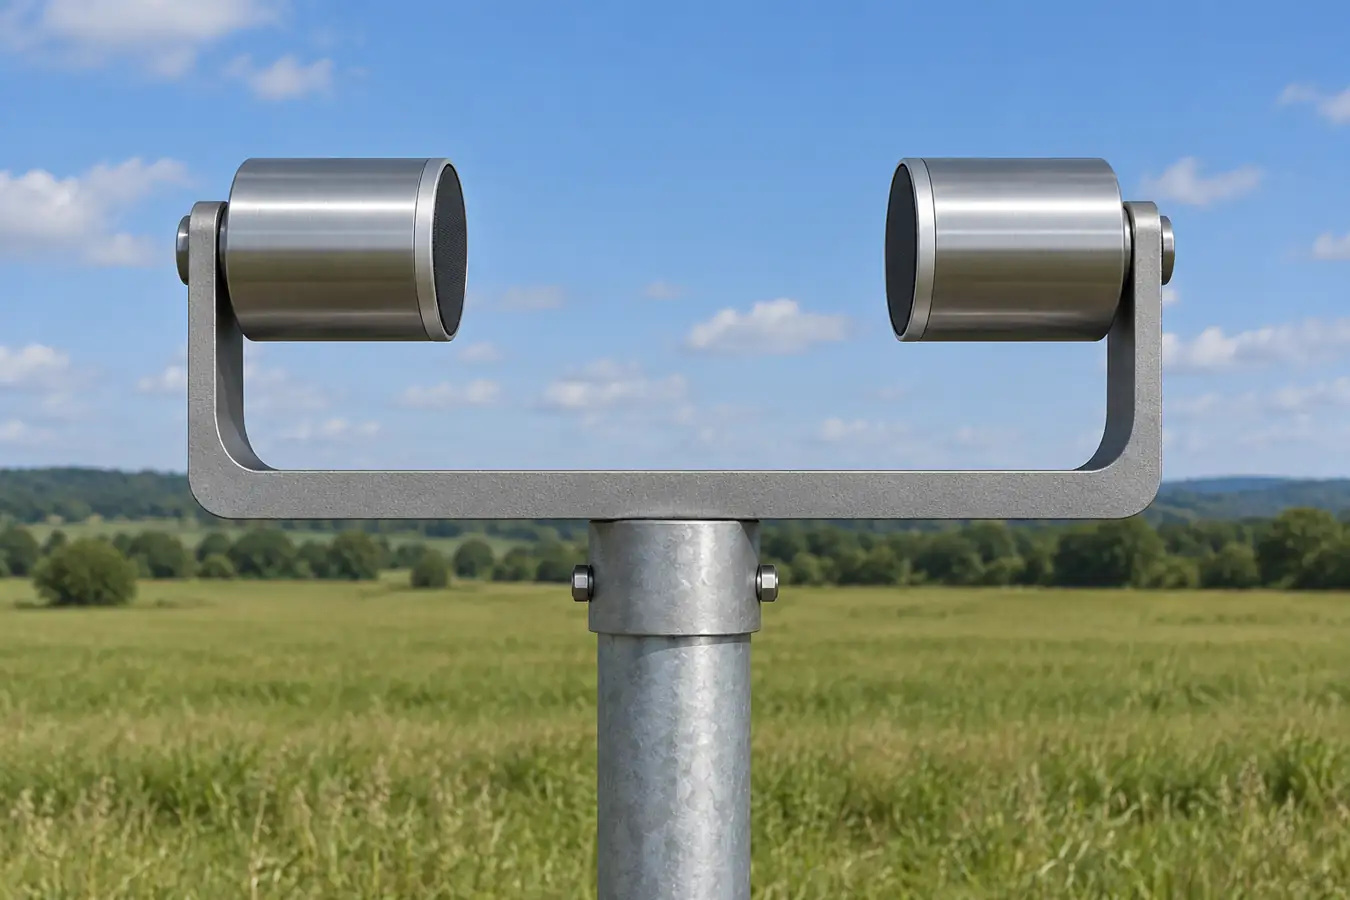
Choose an ultrasonic wind sensor by the wind quantity you need, the exposure at the measurement site, and the conditions under which the data must remain usable. Check whether you need horizontal wind only or a vertical component, then compare range, uncertainty, output rate, direction convention, precipitation performance, power and installation requirements. A sensor with no moving parts avoids bearings and a rotating vane, but it can still be affected by obstructions, rain, ice, electrical problems and incorrect alignment.
An ultrasonic anemometer measures airflow along acoustic paths between fixed transducers. Its output may provide wind speed, direction or velocity components. The best instrument is the one that produces sufficiently representative, timely and traceable data for the decision—not simply the one with the largest stated wind range.
This selection guide expands on the site's general anemometer overview by focusing on sonic measurement, site exposure and the handling of wind data. It applies to outdoor wind instruments; a sensor intended for a duct, enclosed room or moving vehicle needs application-specific assessment.
Start with the measurement decision
A weather station may need a representative average and gust. A crane or exposed structure may require a timely indication at its working location. A wind-energy study may need a documented measurement campaign and traceable uncertainty. A turbulence study may need three velocity components sampled rapidly and synchronized with other instruments. These jobs differ in acceptable siting, averaging and data quality.
| Вопрос | What to specify | What a single reading cannot establish |
|---|---|---|
| Local weather conditions | Exposure, height, average period, gust definition and direction reference. | Wind at every nearby location or height. |
| Equipment operation | Relevant location, update latency, alarm logic and invalid-data handling. | Safe operation without the equipment's overall operating procedure. |
| Wind-energy assessment | Measurement protocol, calibration, data availability and uncertainty. | Long-term energy yield from a short unrepresentative record. |
| Turbulence research | Three-dimensional components, sampling rate, coordinate system and synchronization. | Turbulence statistics from a slow averaged output. |
Write down who will use the data and what they will do when the instrument reports a fault or missing value. A system that treats missing data as zero wind can be more misleading than one that clearly reports an invalid measurement. Design the data path and the physical mounting as part of the sensor selection.
How two-way ultrasonic timing measures airflow
Sound travels between two transducers separated by a known path. Air movement along that path changes travel time: a pulse traveling with the airflow reaches the other transducer sooner than one traveling against it. In a simplified model, if the path length is Л, the still-air sound speed is с, and the air velocity component along the path is v, the travel times are t₁ = L/(c + v) и t₂ = L/(c − v) for the chosen sign convention. Combining the reciprocal times gives v = (L/2)(1/t₁ − 1/t₂).
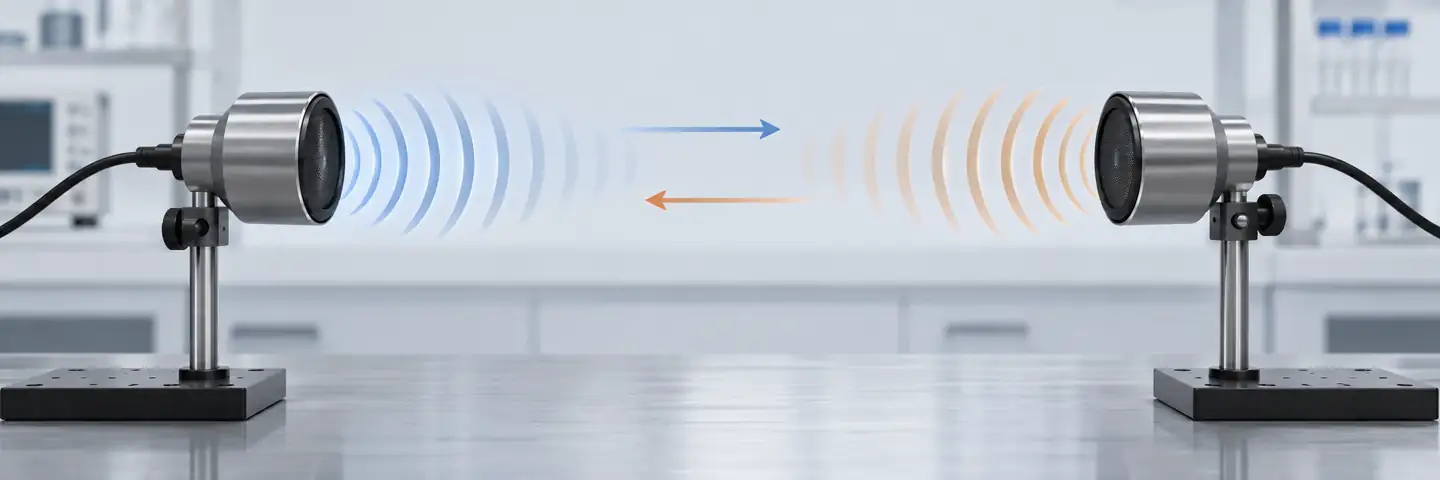
This simplified relationship explains why measuring in both directions can separate the wind component from changes in sound speed. It does not mean temperature, humidity, transducer geometry, signal processing or contamination have no effect on a real instrument. The University of Manchester explanation describes the method and notes that sensor supports can disturb the flow and precipitation can affect some devices. The manufacturer may apply model-specific corrections and diagnostic checks.
The instrument combines measurements from multiple paths to calculate velocity components. A horizontal two-dimensional system generally provides two horizontal components from which speed and direction can be derived. A three-dimensional system adds information needed to estimate the vertical component. The actual transducer geometry and algorithm differ by design; do not count visible arms in an illustration and assume every commercial device works identically.
What the measurement volume represents
The acoustic path samples air over a finite distance between transducers; the output is not a measurement of every parcel of air around the station. Turbulence can vary in space and time, and the support structure can disturb the local flow. The manufacturer may use calibration and corrections to reduce those effects for its specific geometry. A location that is suitable for a slowly averaged local weather display may not be suitable for a research measurement that depends on small turbulent fluctuations.
When comparing instruments, note their measurement volumes and the local airflow. Even closely positioned sensors do not sample exactly the same air. A consistent difference concentrated in a particular wind sector can point to exposure or support effects; a difference only during heavy precipitation suggests a different investigation. Preserve the individual observations and quality flags rather than forcing agreement with an undocumented correction factor.
Speed, direction and sign convention
Wind speed is a magnitude; direction needs a stated convention. Meteorological wind direction commonly describes where the wind comes from, while a mathematical velocity vector may describe where air is moving toward. An instrument or data platform may offer either representation. Record the reference direction, units, coordinate system and sign convention with the data.
Direction becomes unstable or less meaningful when horizontal speed is very close to zero: small component errors can produce a large change in the calculated angle. Check the instrument's low-speed direction specification and the data system's calm-handling rule. A changing direction at almost zero speed is not automatically evidence of a rapidly rotating wind.
Two-dimensional or three-dimensional measurement?
Choose a 2D device when the decision requires horizontal speed and direction and the instrument meets the required uncertainty and update rate. A 3D instrument is appropriate when vertical velocity, tilt of the flow or turbulence components are part of the measurement objective. Three-dimensional output is not automatically better for every weather station: it can add cost, processing requirements and siting constraints without improving a simple horizontal-wind decision.
For research, identify the required sample rate, time synchronization, coordinate transformations, calibration and data completeness before selecting the device. The University of Manchester instrument description discusses three-dimensional sonic instruments for turbulence. Its example ranges and update rates belong to the described instruments and should not be assumed for another model.
Ultrasonic versus cup and vane
A cup anemometer infers speed from rotor motion; a separate vane usually measures direction. A sonic anemometer derives wind components from acoustic measurements without a rotating bearing. Both can be useful when chosen and installed for the task. Comparing their published accuracy requires the same quantity, wind range, calibration method and averaging conditions.
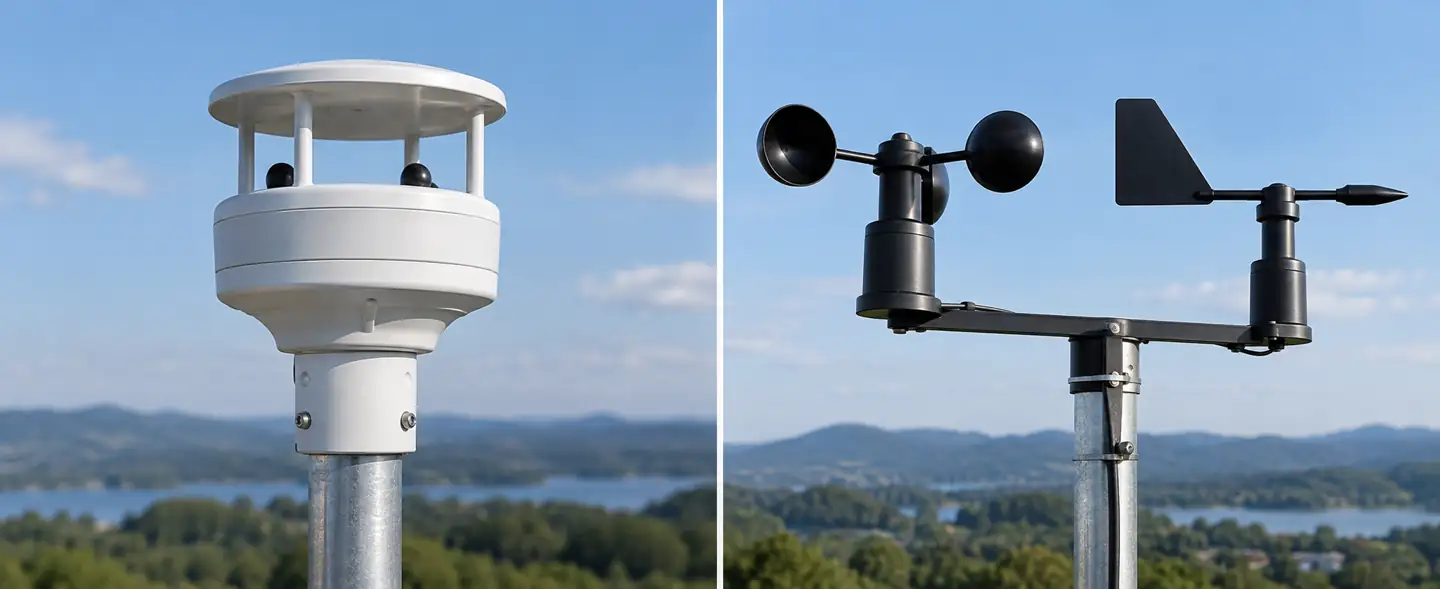
| Consideration | Ultrasonic instrument | Cup and vane |
|---|---|---|
| Moving parts | No rotating wind-sensing parts. | Bearings and moving components require condition monitoring. |
| Выход | Many devices provide calculated speed and direction; some provide components. | Speed and direction commonly come from separate elements. |
| Weather exposure | Acoustic paths and electronics can be affected by rain, snow or ice; heating is model-specific. | Bearings, cups and vane can be affected by wear, contamination and icing. |
| Data interpretation | Algorithm, alignment, averaging and diagnostic flags matter. | Rotor response, vane alignment and sensor condition matter. |
| Обслуживание | Inspect acoustic surfaces, electrical connections, mounting and heater where fitted. | Inspect moving parts, balance, bearings and alignment as specified. |
No moving parts does not mean maintenance-free or immune to severe weather. A Royal Netherlands Meteorological Institute field and wind-tunnel study provides useful context for comparing devices; its findings apply to the models and conditions studied. Evaluate whole-life cost, power and data availability as well as purchase price.
Read the datasheet at the operating point
The full wind-speed range tells you the instrument's stated measurement coverage, not necessarily its accuracy at the speeds that matter. Check whether accuracy is specified as an absolute value, a percentage of reading or a combination, and identify the wind range and environmental conditions behind the statement. Resolution is the output increment; it is not the same as measurement uncertainty.
Review direction accuracy and its minimum applicable wind speed, update rate, averaging options, response time and available raw components. For monitoring exposed equipment, include the full delay from measurement through logging, communications and control logic. A fast sensor can still feed a slow dashboard if the data system averages or transmits infrequently.
Ask how the instrument reports invalid measurements, diagnostics, heating status and power faults. Some instruments output a numeric substitute or repeat the last value; others flag a measurement as invalid. The integration must preserve that status. Record the output format, units, direction reference, sampling rate, firmware and any configured corrections.
Output rate, gusts and averages are different settings
An output rate of one value per second does not by itself define a one-second gust. The instrument may internally average over a different window, and the logger may apply another filter. Define the interval, statistic and treatment of missing samples before comparing two wind records. A maximum of averaged values is not necessarily the same statistic as a short-duration peak from raw samples.
Direction also requires care when averaging. Values near 359° and 1° are both close to north; their simple arithmetic mean of 180° is misleading. Use a documented circular or component-based method appropriate to the purpose, and distinguish the average of individual speed magnitudes from the magnitude of an average velocity vector. These quantities answer different questions when wind direction changes.
Preserve timing and data coverage
The meaning of an average depends on which samples were included. If a sensor reports invalid values for part of an interval, define a minimum acceptable coverage and mark the interval when that requirement is not met. A five-minute average from a few isolated valid samples should not be silently presented as equivalent to one from continuous valid data. Keep both the coverage information and the reason for invalid samples where the device provides it.
Synchronize clocks when comparing wind with rainfall, equipment operation or another sensor. A timestamp can indicate the start, midpoint or end of an averaging window; document which one the logger uses. Clock drift or communication delays can create an apparent disagreement during rapidly changing wind even when instruments were exposed to the same event. For gust records, the measurement window and timestamp convention are as important as the displayed peak.
Siting is part of accuracy
Trees, buildings, roof edges, towers and nearby equipment alter wind through sheltering, acceleration and turbulence. The sensor can measure the air at its location correctly while that location does not represent the wind needed for the decision. Choose the site, height and reference exposure before the mounting hardware. If a project uses a meteorological, aviation or energy-assessment program, follow that program's current siting and reporting requirements rather than relying on a generic distance rule.
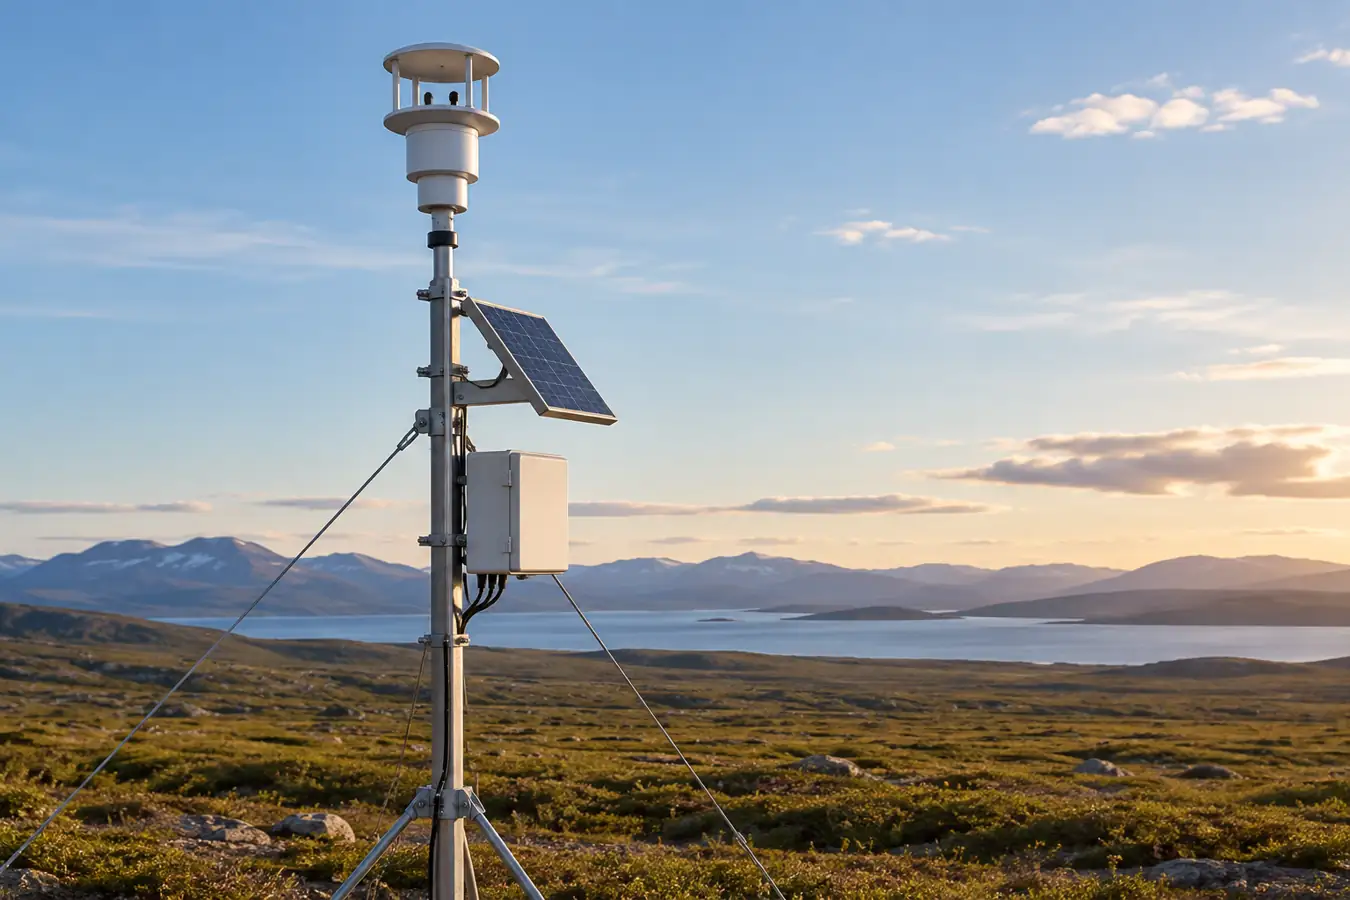
The mast and mounting arm can also produce a wake. A measurement may show direction-dependent bias when airflow passes the support before reaching the sensing path. Instrument geometry, boom orientation and prevailing wind conditions matter. Document the mast, boom, nearby obstacles and sensor position; a photograph and site sketch help future reviewers understand why a directional sector behaves differently.
The Vaisala WM80 setup guide emphasizes unobstructed airflow and a defined alignment for that device. Its specific distances and mounting instructions belong to that model. A rooftop sensor used to control a local ventilation system may intentionally measure a different exposure from a reference meteorological station; name the intended exposure in the data record.
Alignment and direction reference
Align the sensor's reference mark to the direction required by the data system and confirm whether that reference is true north, magnetic north or a local equipment axis. Magnetic declination and nearby metal can affect a compass-based alignment. Record the alignment method, offset applied in software and any later change to the mount.
The California Air Resources Board SOP for the RM Young 81000 describes true-north alignment for that instrument and program. Do not transfer its mounting hardware or tolerance to other devices without checking their instructions. After installation, verify that the logger applies the same convention; a correct physical alignment combined with an incorrect software offset can create a consistent direction error.
Rain, snow, ice and heating
Precipitation can affect ultrasonic measurements by wetting or obstructing transducers or the acoustic path. Ice and snow can accumulate on the head and supports. The effect depends on instrument construction, weather and processing; a sonic sensor should not be described as universally unaffected by rain or icing. A missing or flagged output during an event can be a useful diagnostic, not a zero-wind observation.
Some models offer heating for transducers or other parts. Verify which surfaces are heated, the operating conditions for the heater, required voltage and current, control method and diagnostic output. Heating capability varies by model and may not prevent all accumulation in severe conditions. For a remote station, include heater demand in the power budget, battery design and cable-voltage-drop calculation. A heater option without adequate power may not perform as expected.
The University of Manchester's sonic-anemometer description notes precipitation effects for some instruments. The KNMI evaluation provides field context. Interpret both in relation to the exact device and environment; neither creates a universal guarantee.
Install, inspect and verify the measurement chain
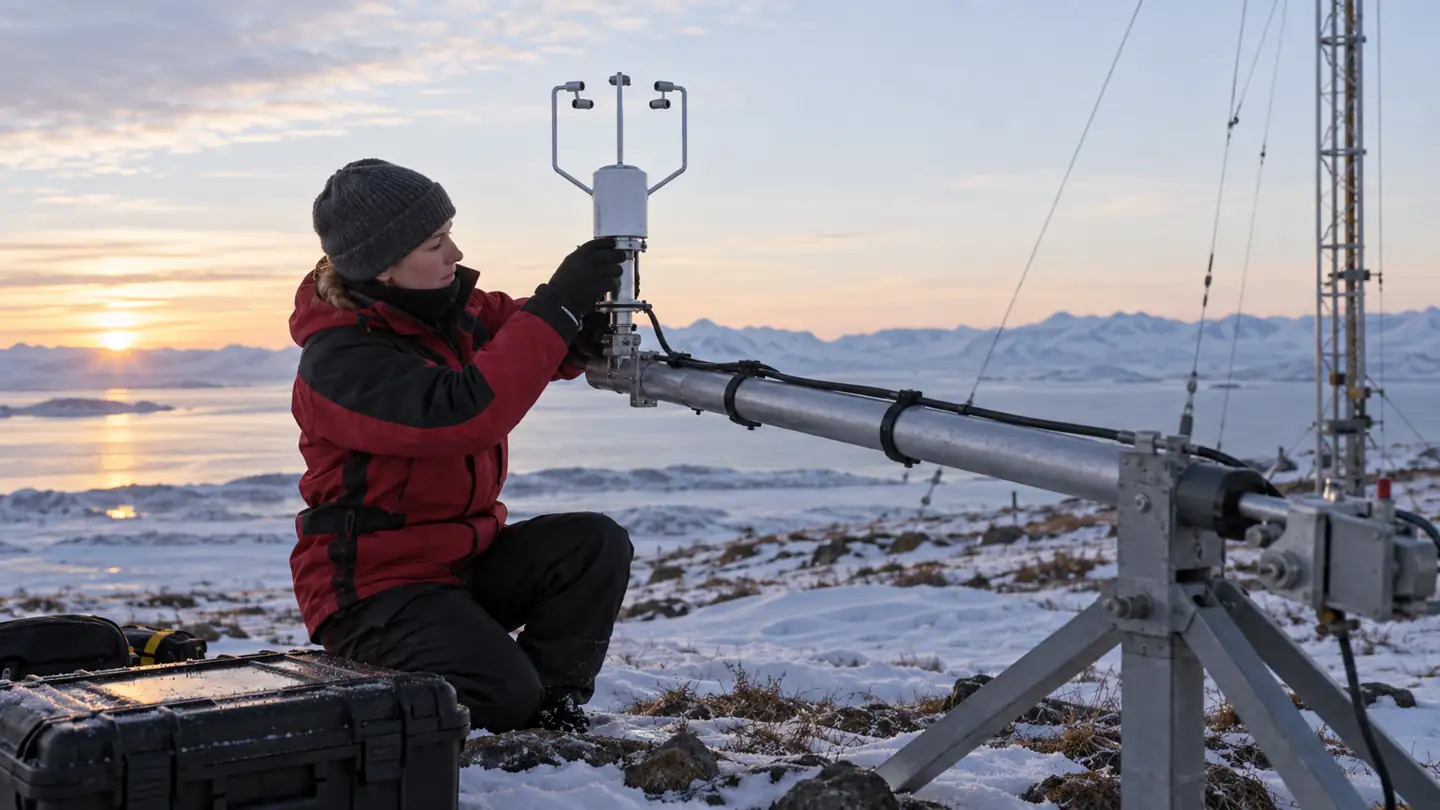
Follow the instrument manufacturer's mounting, electrical, grounding and maintenance instructions and the site's safe access procedure. Confirm the sensor's orientation, stable mounting, cable strain relief, connector protection and power supply. Ensure the mount does not block the acoustic path and that nearby equipment matches the site plan. A correct electrical connection does not establish that the wind exposure is representative.
At commissioning, record the sensor model and serial number, calibration information, installation height, coordinates, reference direction, firmware, output configuration and logger settings. Verify units and whether direction indicates wind from or wind toward. Check status flags and intentionally test how the data system displays missing or invalid inputs when this can be done safely under the system procedure.
Compare the output with a suitable reference or independent instrument when the monitoring program calls for it. Co-located sensors should observe as similar an airflow as practical without obstructing one another. Differences can arise from exposure, height, response time, averaging, alignment and calibration as well as an instrument fault. A single side-by-side reading is not enough to establish performance across all wind directions and weather.
| Наблюдение | Possible causes | First evidence to review |
|---|---|---|
| Direction consistently offset | Alignment, north reference, software offset or convention mismatch. | Installation record and logger configuration. |
| Zero or flat output in severe weather | True calm, iced path, power problem or invalid-value substitution. | Diagnostic flags, heater status and nearby weather observations. |
| Difference only from one wind sector | Mast wake, nearby obstruction or sensor geometry. | Site sketch and wind-direction-dependent comparison. |
| Spikes during rain | Precipitation effect, local turbulence, electrical noise or real gusts. | Raw data, quality flags and a reference measurement. |
| Missing records despite sensor power | Communications, timestamp, logger or supply interruption. | Data and power logs, wiring and device diagnostics. |
Routine inspection should cover contamination, damaged transducers, cables, connectors, mounting and heater operation where provided. Use the manufacturer's approved cleaning method; do not scrape or apply chemicals to a transducer without checking compatibility. Record maintenance and configuration changes so a later shift in data has context.
A practical purchase worksheet
Specify the measurement purpose and exposure, sensor height, 2D or 3D requirement, speed range, direction reference and uncertainty at the decision point. Add the required output rate, averaging interval, gust definition, communications interface, time synchronization and diagnostic flags. Describe expected precipitation, temperature, icing, supply and maintenance access.
Ask vendors which conditions support each performance statement, how invalid data are reported, and whether heating is included. Include the cost and power of the logger, heater, mounting hardware, cable and communications. Ask how the instrument is calibrated and what service is required after damage or replacement. Compare complete systems and data quality, not only the sensor headline range.
If the decision has operational consequences, test the entire chain with the responsible system owner: sensor, configuration, communications, quality flag, display and response to missing data. The appropriate response to invalid data is an application design decision and should be documented before deployment.
Three examples of selection decisions
An open-field weather station may prioritize a documented exposure, reliable horizontal wind and a clearly defined averaging interval. The buyer should identify the station program's siting requirements, power source, direction reference and maintenance plan. An inexpensive instrument on an obstructed mast may yield less representative data than a properly sited instrument with a modest laboratory specification.
A sensor on a large structure may need to describe local conditions at a particular work area. Wind at that point can differ from wind at a nearby weather station because of sheltering or acceleration around the structure. Specify the physical location and how the local signal relates to the operational rule; do not substitute a distant station's threshold without an engineering basis.
A research station may require velocity components rather than only a displayed speed and direction, along with high data availability and synchronized observations. Confirm that the selected instrument supplies the required components and diagnostic information at the necessary rate. Document coordinate transformations and calibration. More output channels are useful only when the site, processing and quality control support the question being studied.
These examples illustrate why an anemometer is selected as part of a measurement system. No single output interval, mast height or accuracy value is appropriate for every application.
Plan the data handover
Before a station changes operator, retain the site sketch, alignment method, instrument configuration, calibration records and maintenance history with the data. Note when an obstruction is built nearby or the mast is moved. A new sensor at the same nominal height may still have different exposure and response; where feasible, use an overlap period and document both instruments' averaging settings.
If a sensor is temporarily removed for inspection, mark the resulting gap as missing. Preserve corrections and raw observations separately so that a later reviewer can reconstruct the reported result. This small amount of context is often what makes a long wind record useful after the original installer is no longer available.
Review performance after a weather event
After a period of rain, snow or icing, compare the instrument's status and data availability with site observations before drawing conclusions from an unusual wind trace. A low reading could reflect real sheltering or calm conditions, but it could also coincide with an obstructed path or inadequate heater power. Look for the diagnostic evidence supported by the specific device and inspect it under the site's maintenance procedure.
Keep an event log that records power interruptions, communications problems and physical observations. Where a reference instrument is available, compare aligned intervals and document each sensor's averaging and position. A temporary difference is a reason to investigate; it is not automatically proof that one model is defective or that all ultrasonic instruments respond alike.
Часто задаваемые вопросы
Does an ultrasonic wind sensor measure direction as well as speed?
Many 2D and 3D instruments calculate horizontal speed and direction from measured components. Confirm the exact output and whether direction means wind from or wind toward for the model and logger.
Is a 3D sensor always more accurate than a 2D sensor?
No. Three-dimensional output supplies an additional component, but accuracy depends on the instrument, conditions and installation. Select the dimensionality required by the measurement task.
Are ultrasonic anemometers immune to ice?
No. Ice and snow can affect acoustic paths and supports. Some models have heating, whose effectiveness depends on design, power and weather conditions.
Why does wind direction jump when the reading is almost calm?
At very low horizontal speeds, small component changes or errors can cause large calculated angle changes. Check the instrument's low-speed direction specification and use a documented calm-handling rule.
Can I average directions as ordinary numbers?
Not reliably around the 0°/360° boundary. Use a documented circular or vector method appropriate to the statistic you want, and keep the averaging interval and data-quality rules with the result.
Does a calibrated sensor guarantee a representative wind measurement?
No. Calibration concerns performance under stated conditions; site exposure, mast wake, alignment and data processing can still make the installed reading unrepresentative for the intended use.
Технические ссылки
Как выбрать акселерометр для измерения вибрации, движения и наклона
Выберите акселерометр по диапазону, полосе пропускания, шуму, монтажу, выборке и движению, которое необходимо измерить.
Читать далее
Как выбрать датчик перепада давления: диапазон, статическое давление и установка
Выбирайте датчик перепада давления по диапазону измерения, общему давлению, пределам перегрузки, импульсным линиям и установленной проверке.
Читать далее
Датчики этилена для хранения фруктов: диапазон, размещение и проверка
Планируйте мониторинг этилена при хранении фруктов с учетом диапазона концентраций, перекрестной чувствительности, места отбора проб и проверки эталонных значений.
Читать далее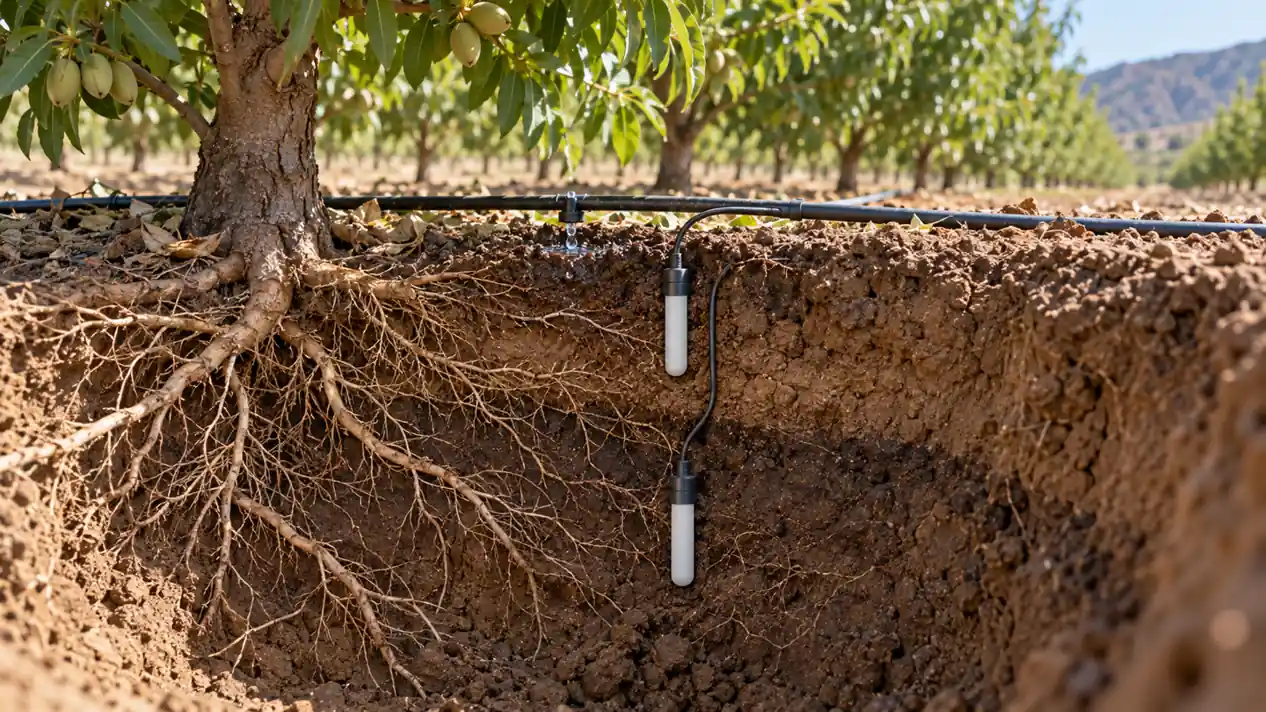
Как выбрать и установить датчики влажности почвы для полива
Сравните датчики объемного содержания воды и потенциала почвенной влаги, а затем спланируйте размещение корневой зоны, калибровку и решения по ирригации.
Читать далее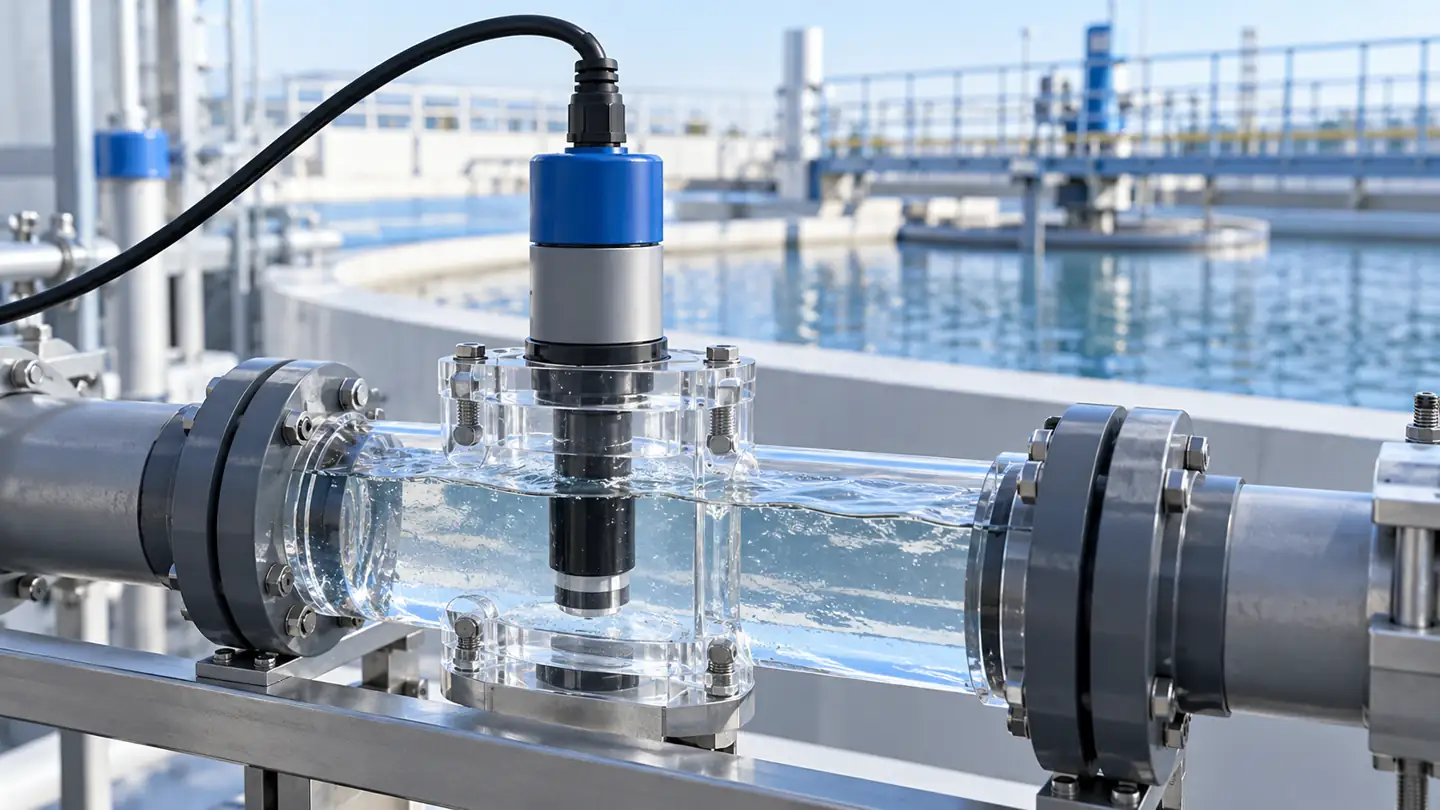
Как выбрать датчик мутности воды и интерпретировать NTU или FNU
Select and verify a turbidity sensor by optical method, particle conditions, installation and maintenance; understand why NTU and FNU are method-specific.
Читать далее
Что на самом деле говорит датчик ОВП о воде
Интерпретируйте показания ОВП воды с помощью эталонного электрода, pH, температуры, смешанного химического состава и условий отбора проб, а также знайте, когда необходим прямой тест аналита.
Читать далее
