
Choose a CO₂ sensor range from the concentrations the application is expected to encounter and the decisions made at those concentrations, not from the largest number a display can show. A ppm-range instrument may be appropriate for ordinary room-air trends, while a percent-range instrument may be needed for a concentrated process atmosphere. The labels do not define two different physical quantities: 1% CO₂ equals 10,000 ppm on the same gas-fraction basis. The important difference is where an instrument has documented accuracy, useful resolution and enough remaining signal.
A reliable selection starts with a concentration profile: normal values, expected excursions, any concentration at which a control decision changes, and the highest credible sample. Then check the manufacturer's specified accuracy interval, not only its digital output range. For a finished monitor, also check how the gas reaches the sensor and how the system handles overrange and invalid readings.
The First Question: What Gas Sample Are You Measuring?
“CO₂ in a building” can mean the air near a desk, air in a return duct, a greenhouse atmosphere, a fermentation vessel's headspace or the gas near a storage installation. These are not interchangeable samples. The same unit, ppm, does not make their sampling conditions or required instruments equivalent.
For occupied rooms, the aim may be to follow a change with occupancy and ventilation. A reading at one place describes that place and time; it is not a complete judgment of indoor air quality. ASHRAE's position document on indoor CO₂ explains why interpretation depends on application and measurement location. For a process, the concentration may be much higher, pressure and moisture may differ from room air, and the sample may be drawn through tubing. For any detection or alarm duty, evaluate the complete instrument and the applicable intended-use documentation, not just its optical range.
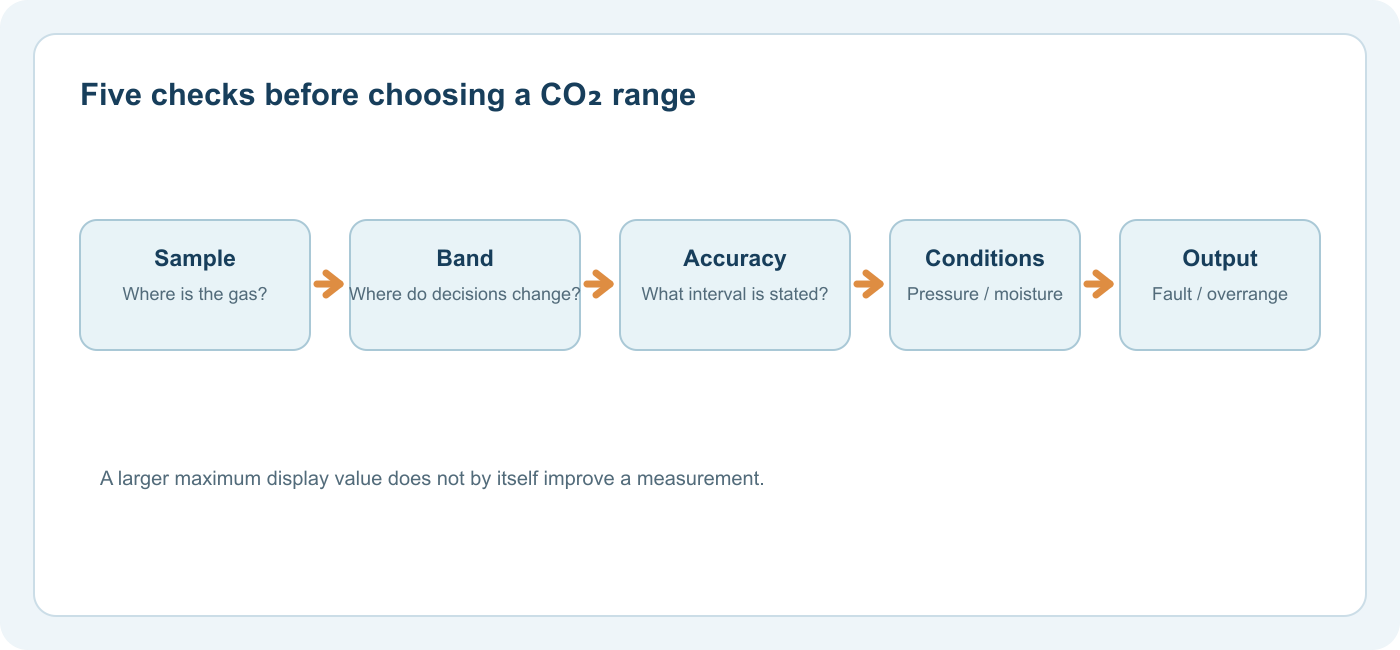
Write a short sample statement before looking at catalogs: “This instrument will measure [sample point] during [operating states], with expected CO₂ from [low] to [high], and the reading will be used for [decision].” Include temperature, pressure, humidity and possible condensation if they differ from ordinary ambient air. An unknown limit should be recorded as unknown rather than silently assumed away.
Ppm and Percent Are Different Scales of the Same Fraction
On the same fraction basis, 1 ppm is one part in a million and 1% is one part in a hundred. Therefore:
| CO₂ fraction | Equivalent concentration |
|---|---|
| 1,000 ppm | 0.1% |
| 5,000 ppm | 0.5% |
| 10,000 ppm | 1% |
| 20,000 ppm | 2% |
The arithmetic is useful, but a conversion does 不是 extend a sensor's validated range. A room-air sensor that digitally reports 20,000 ppm is not automatically accurate at 2%. Equally, a 0–2% probe is not automatically the better choice for resolving small changes near outdoor background.
Check the reporting basis. Mole fraction, volume fraction under an applicable convention, mass fraction and mg/m³ are different quantities. Humid and dry gas bases also differ. Our CO₂ ppm and percent explanation shows the conversion and why the basis must travel with the number.
Four Range Claims That Often Get Confused
Output range is what a digital interface or display can represent. Specified measurement range is the region a manufacturer says the product is designed to measure. Accuracy interval is where a stated error expression applies, often with conditions. Application range is where your actual sample will fall. These must overlap where decisions are made.
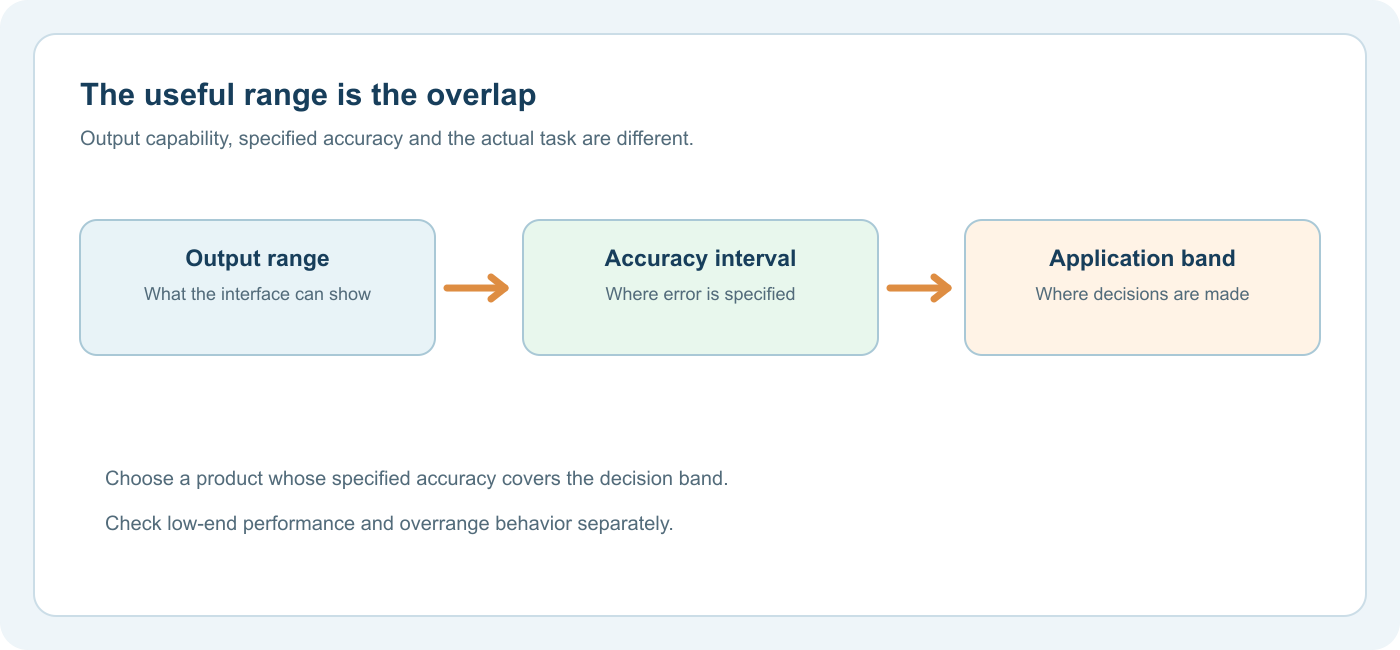
這 Sensirion SCD30 資料表 is a concrete example. It lists an I²C/UART output range of 0–40,000 ppm, but its published CO₂ accuracy is specified for 400–10,000 ppm under stated conditions. It would be a mistake to transfer the accuracy claim to 30,000 ppm merely because the interface can carry that number. The datasheet also describes calibration conditions that matter for long-term use.
For a different design, Vaisala's GMP343 datasheet offers selectable ranges from ppm levels up to 0–2% CO₂. The range choice carries its own accuracy expression and conditions; its documentation distinguishes diffusion and flow-through configurations. These examples illustrate how to read real data sheets, not which manufacturer to choose.
Read the Error Expression Beside the Range
“±3%” is incomplete by itself. Is it 3% of the reading, 3% of full scale, or three percentage points of CO₂? These are very different. A specification such as ±(30 ppm + 3% of measured value) combines a fixed ppm term with a relative term. At a hypothetical reading of 1,000 ppm, the expression evaluates to ±60 ppm. That arithmetic is an illustration of interpreting the stated expression; the manufacturer's environmental and calibration conditions still apply.
Likewise, a percent-range display with a 0.01% step has 100 ppm display increments on the same fraction basis, but display resolution is not accuracy. Noise, repeatability and calibration uncertainty determine whether changes smaller or larger than one displayed step can be trusted.
Match the Low End, Decision Band and High End
A useful specification request identifies three zones.
- Low end: the smallest meaningful change and the background from which it must be distinguished.
- Decision band: concentrations where a ventilation, process or investigation decision changes.
- High end: the largest expected sample, including a credible excursion and how overrange should be represented.
For an occupied-room trend, good performance in the ordinary indoor range may matter more than a theoretical maximum far above it. For an incubator or controlled-atmosphere process, the normal operating band can be at a percentage level; performance at that band matters more than low-ppm resolution. A greenhouse may occupy a different middle ground depending on its control setpoint, outdoor exchange and operational phases. These are application descriptions, not universal target thresholds.
Where a process can exceed the sensor's range, ask whether the device reports a clear overrange or fault condition. A value frozen at the upper display limit, a saturated optical signal and a valid stable concentration must not be treated as the same evidence.
Why Optical Design and Range Are Connected
In an NDIR sensor, CO₂ absorbs some infrared light along a gas path. At low concentration, the change from baseline can be small relative to optical noise or drift. At high concentration, too little transmitted light may remain for a useful measurement. Source strength, filter band, optical path length, detector and calibration are designed together for the target range. See our NDIR 測量鏈指南 和 optical path-length explanation for the underlying tradeoff.
That physics explains why the highest output value should not dominate selection. It does not mean all short-path sensors are percent-range devices or all long-path sensors are low-ppm devices; the whole optical system matters. Nor does “NDIR” itself certify the finished monitor for a particular process or alarm use.
Environmental Conditions Can Change the Answer
Pressure and temperature influence gas density in an optical cell. A module may include compensation, accept an external pressure input or assume a default. Sensirion's SCD30介面文檔 provides pressure and altitude configuration for that specific module. The SCD30設計導入指南 describes why local airflow pressure and nearby heat can affect performance.
For a humid process stream, consider whether water may condense in the sample route, whether the instrument measures the wet or conditioned gas, and how the reported basis is defined. A filter that protects the optics can alter response or require maintenance. If the sensing element sees one pressure and the displayed value is interpreted as though it saw another, even the correct range label is insufficient. For the denominator change caused by water removal, see our 濕二氧化碳與乾二氧化碳讀數指南。
Sampling also affects response. A bare module's response test may use direct exposure, while a completed instrument has a case, inlet, possible tubing and firmware averaging. The GMP343 documentation lists different response conditions for its diffusion and flow-through configurations, showing why a single response number needs its test setup beside it.
A Selection Matrix for Three Measurement Tasks
| Task | What range evidence matters most | What else must be checked |
|---|---|---|
| Occupied-room trend | Accuracy and repeatability across the normal room-air interval | Representative placement, logging, calibration assumptions and finished-device airflow |
| Enriched or controlled atmosphere | Validated performance around the controlled band and excursions | Sample pressure, moisture, baseline calibration conditions and overrange |
| Process or investigative sample | Accuracy across expected sample states, including transitions | Sample route, flow, pressure, conditioning, traceability and data record |
This matrix is a way to ask better questions, not a replacement for the specific instrument manual. One facility may need two measurements: a process analyzer for a high-concentration line and a separate ambient monitor for the surrounding space. The process result does not tell you the room concentration, and the room result does not tell you the process composition.
A Worked Specification Brief
Suppose an engineer needs to follow an occupied room during ordinary use and also investigate occasional unexpected high readings. The first task is to define the room locations and the range in which a ventilation decision changes. The engineer can then request accuracy and repeatability evidence across that band, ask how a high or invalid result is flagged, and document outdoor context and logging interval. A very high advertised maximum should not substitute for these facts. This example describes a decision process, not a claim that one device fits every building.
Now consider an enriched chamber with a normal operating point near 2% CO₂. The same arithmetic converts that to 20,000 ppm, but the procurement question is whether the exact configured instrument has a stated error and sampling method around that point and through expected transitions. A room sensor whose accuracy claim ends at 10,000 ppm should not be assigned an accuracy at 20,000 ppm. A percent-range probe still needs the correct pressure, moisture and calibration assumptions. This contrast explains why the application band matters more than the unit printed on a display.
我們的 CO₂ measurement overview sets out the complete sample-to-output chain. For the distinction between module claims and finished equipment, read CO₂ sensor modules versus complete monitors. To compare different sampling and data tasks, read CO₂ monitors versus gas analyzers。
Questions to Put in a Specification Request
Ask the supplier or equipment engineer for the following evidence for the exact model and configuration:
- Which gas sample, concentration fraction and range are being specified?
- Which interval is covered by the accuracy expression, and under which temperature, pressure and humidity conditions?
- Is the error stated in ppm, percent of reading or percent of full scale?
- What happens when the gas is below or above that interval? Are fault and overrange states explicit?
- What calibration or automatic baseline assumptions are required by the operating pattern?
- Was response measured at the component, probe or finished monitor, and with what gas exchange or flow?
- Does the complete device provide the output, record, alarm or communications function the application needs?
These questions expose a mismatch before purchase or installation. They are more useful than asking for “the widest-range NDIR sensor.” Gasnose's NDIR sensor guide provides a deeper review of optical selection and target-gas limits.
Common Range Mistakes
Mistake: converting 2% to 20,000 ppm and treating it as a validated measurement. The unit conversion is correct, but the accuracy interval may stop lower.
Mistake: choosing a 0–100% scale because it is “future proof.” That scale does not establish low-end resolution, repeatability or suitability for room-air trends.
Mistake: treating display resolution as detection limit. A display may show individual ppm digits while the sensor's uncertainty is much larger.
Mistake: assuming calibration works for every duty cycle. Automatic baseline methods can depend on recurring exposure to a suitable low concentration; a continuously enriched atmosphere may violate that assumption.
Mistake: confusing the sensor range with the whole instrument's intended use. Sampling, enclosure, controls and documentation determine whether a finished product fits the job.
A Practical Selection Rule
Select the smallest set of instrument capabilities that covers the actual sample and decision band with a documented error under the conditions of use. Check the high end and fault behavior, but do not let an impressive maximum value substitute for verified performance where your measurement matters.
常見問題
Is 1% CO₂ the same as 10,000 ppm? Yes, on the same gas-fraction basis. That mathematical equivalence does not make two instruments interchangeable.
Can a ppm sensor measure percent-level CO₂? Only if its exact model is specified and calibrated for that concentration. A displayed number outside its accuracy interval is insufficient evidence.
Is a percent-range sensor too coarse for room air? It may be, but the answer depends on its resolution, noise and accuracy at the relevant low concentration. Read the specific data sheet.
Which specification should I compare first? The accuracy interval and conditions that cover the concentrations where your decision changes. Then examine sample handling, response, calibration and overrange behavior.
CO2 Data Logger or Live Display? Choose the Record Your Decision Needs
Choose a CO2 logger, live display or both by comparing sensor response, update and record intervals, timestamps, data gaps, retention and use.
閱讀更多
Single-Gas vs Multiparameter Monitors: Compare the Channels, Not the Screen
Compare single-gas and multiparameter monitors by the evidence for each channel, sample location, data quality, maintenance and intended use.
閱讀更多
A CO2 Measurement Requirements Worksheet: Define the Job Before Choosing a Sensor
Build a practical CO2 measurement brief covering purpose, sample, range, timing, data, faults, maintenance and acceptance evidence before selecting an instrument.
閱讀更多

評論 (1)
[…] ppm equals 1% on the same fraction basis, but conversion does not make instruments interchangeable. Our ppm-versus-percent range guide separates output range, accuracy interval and application […]