

CO₂, temperature and relative humidity describe different properties of the same indoor air. Use CO₂ to look for patterns associated with human generation and dilution, temperature to track sensible heating and cooling, and relative humidity together with temperature to understand moisture conditions. A synchronized plot can show when those patterns coincide. It cannot establish a common cause without occupancy, equipment mode, outdoor conditions and representative measurements.

Co-located channels help align observations, but each channel answers a different question.
Give each reading a separate job
In an ordinary occupied room where people dominate the CO₂ source, concentration can build as people enter and fall as low-CO₂ air dilutes it or generation stops. Volume, occupancy and activity, outdoor concentration, outdoor airflow, air from other spaces and elapsed time all affect the trajectory. An isolated high reading does not establish outdoor air delivered per person. A low reading from an empty room or beside a supply diffuser does not establish that the ventilation is adequate when the room is full. Combustion or another important CO₂ source changes the interpretation.
Temperature indicates the local thermal condition at the probe. It responds to the HVAC system, room gains and air movement, including solar radiation, adjacent equipment or enclosure heating. It helps interpret occupant reports and equipment operation, but a single dry-bulb temperature cannot characterize thermal comfort. Radiant conditions, air speed, clothing and activity can matter even when an office sensor is within the building's normal band.
Relative humidity (RH) compares the water vapor present with the amount corresponding to saturation at the measured temperature. Its response includes both a moisture term and a temperature term. A percentage decrease can occur without removing water vapor, and a percentage increase can occur without adding it. Dew point, derived from temperature and RH at the same place and time, often makes the moisture pattern easier to read.
| Channel or derived value | Typical units | Evidence it can contribute | Important limitation |
|---|---|---|---|
| Directly measured CO₂ | ppm | Changes in generation and dilution during occupancy | Does not measure other pollutants or directly establish outdoor flow |
| Dry-bulb temperature | °C or °F | Heating, cooling, room gains and local thermal conditions | Affected by site, radiation and enclosure heating |
| Relative humidity | % RH | Proximity to saturation at the sensor temperature | Changes when temperature changes even at constant vapor pressure |
| Calculated dew point | °C or °F | Changes in vapor pressure and condensation potential | Depends on both input measurements and says nothing about an unmeasured surface temperature |
The channels can change at different speeds and in opposite directions. People in a meeting release CO₂, heat and water vapor, but the HVAC system can remove sensible heat and moisture at different rates. A cooling coil might be cold enough to remove moisture in one operating mode and only change temperature in another. The pattern on the plot reflects the net balance at the sensor location. ASHRAE's position document on indoor carbon dioxide

Occupancy can change several room loads at once. Equipment and outdoor conditions determine how each measured channel responds.
Distinguish warming from drying with dew point
At a given air temperature T, write relative humidity as RH = 100 × e/eₛ(T), where e is the water vapor partial pressure and eₛ(T) is saturation vapor pressure at T. Dew point Tᵈ satisfies eₛ(Tᵈ) = e. Because eₛ increases with temperature in the usual indoor range, heating raises the denominator of the RH expression. If vapor pressure is approximately constant, dew point remains approximately constant while RH falls. This is a useful interpretation for air heated without appreciable moisture addition or removal at nearly constant total pressure. ASHRAE Fundamentals chapter on psychrometrics
Consider a hypothetical room at 20 °C and 50% RH. Saturation vapor pressure is about 2.34 kPa, giving e ≈ 1.17 kPa and dew point near 9.3 °C. If the room air is heated to 24 °C while vapor pressure remains 1.17 kPa, saturation vapor pressure rises to about 2.98 kPa and RH drops to about 39%. The moisture indicator derived from vapor pressure still gives a dew point near 9.3 °C. An RH-only report would show an 11 percentage point decrease and could mistakenly call it drying.
| Hypothetical air condition | Temperature | RH | Dew point |
|---|---|---|---|
| Initial room air | 20 °C | 50% | About 9.3 °C |
| Same vapor pressure after heating | 24 °C | About 39% | About 9.3 °C |
| Higher vapor pressure at same final temperature | 24 °C | 50% | About 12.9 °C |
Compare surface temperature with the local air dew point when investigating condensation. If air near a pane or duct surface has a dew point near 9.3 °C and the exposed surface is at 7 °C, condensation is physically possible at that interface. The relevant quantities are the surface temperature and nearby vapor pressure, which can differ from the conditions at a wall transmitter across the room. Visible water can have other sources such as leakage. Pair the moisture trend with inspection rather than inferring a source from an RH threshold alone. US EPA guide to mold and moisture
Dew point is useful for comparing vapor pressure. When estimating how outdoor air changes the room's water content, humidity ratio is the mass of water vapor per mass of dry air and depends on pressure as well as vapor pressure. An outdoor RH percentage cannot tell you whether ventilation will dry or moisten the space. Cool outdoor air at a high relative humidity can carry less water vapor than warm indoor air at a lower relative humidity. Compare dew point or appropriately calculated humidity ratio, then account for coil operation, humidification and other moisture sources.
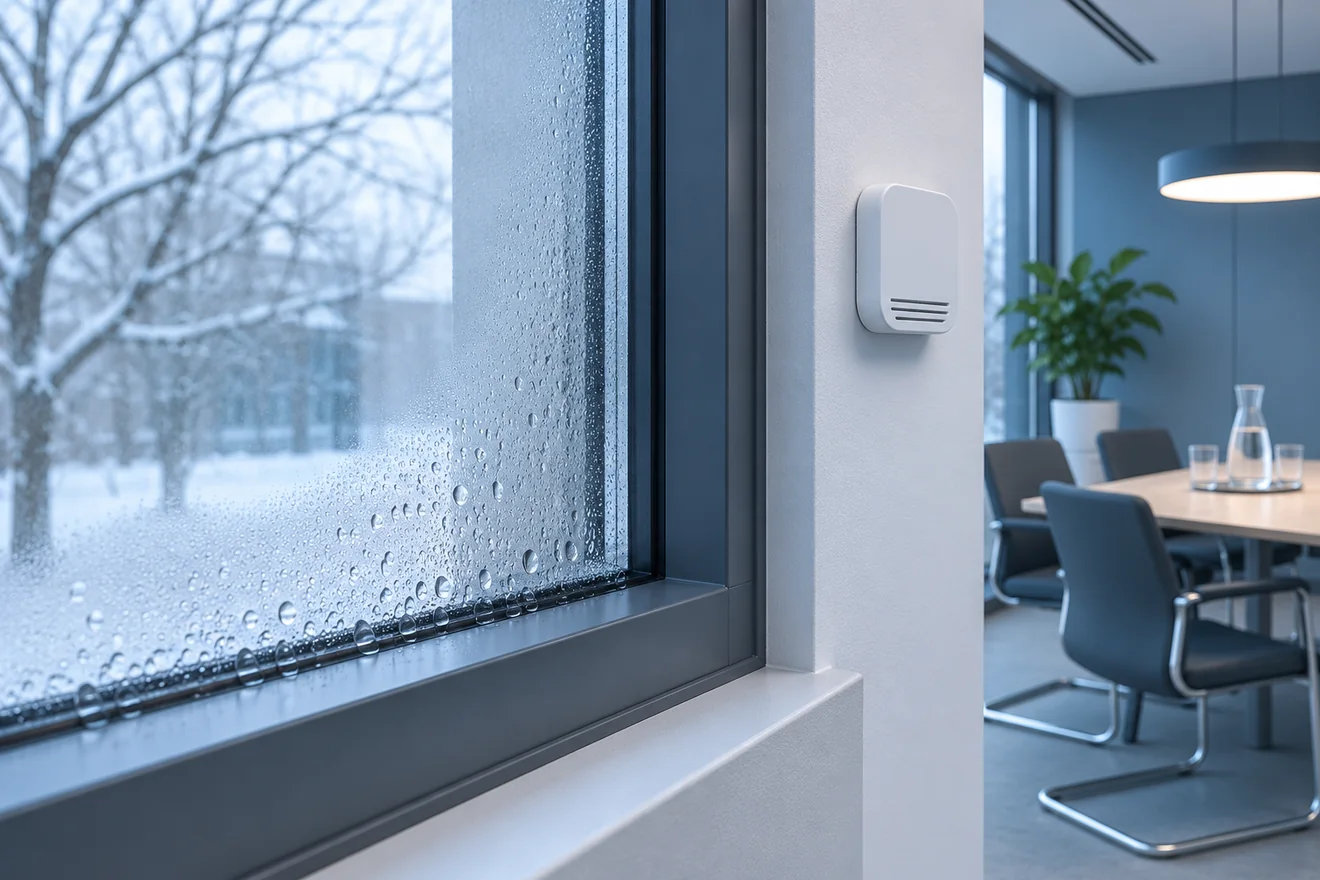
The condition at the cold surface governs local condensation. A wall measurement supplies context for the investigation.
Select a location for the question being asked
A wall-mounted multi-channel unit saves wiring and can pair observations at one site. Choose a location representative of the occupied zone for the primary purpose. A convenient wall behind a hot display, next to a door or beside a supply diffuser can bias one or more channels. A crowded seat can put the CO₂ inlet repeatedly in exhaled breath. Sun on the housing can raise the indicated temperature and depress the indicated RH. A cool external wall or a draft from a conduit opening can make the enclosure read differently from the air occupants experience.
The UK Health and Safety Executive advises workplace monitor users to check representative locations, avoid supply openings, doors and windows, and record occupancy and ventilation context. In a large, open or divided space, temporary measurements at several positions can reveal whether one permanent location is defensible. Use representative breathing-zone conditions for occupancy-related CO₂ questions. Use a separate relevant location for a cold window, a supply duct or other specific moisture or HVAC diagnostic target. Name each point according to what it actually measures. HSE workplace CO₂ monitor guidance
Co-location inside a product does not guarantee that the temperature and RH sensing elements are exposed to the same air or thermal field as a CO₂ cell. A printed circuit board and housing can produce temperature offsets, and different inlets or thermal masses create different settling behavior. Read the finished transmitter's documentation for the environmental performance you need. A combined module datasheet provides separate specifications for each channel. It cannot determine the heat rise of the complete installed housing. The Sensirion SCD30 datasheet illustrates a combined CO₂, humidity and temperature module with separately defined channel specifications. Sensirion SCD30 datasheet
A channel used internally to compensate a gas measurement may have a different purpose from the ambient temperature channel an operator sees. Verify which values the BAS receives and which corrections the device has already applied. Adding a site correction based on nearby RH or temperature can duplicate compensation or apply an unrelated model. Sensor behavior and the composition of humid sampled air are separate questions. How Humidity Affects Gas Sensor Readings
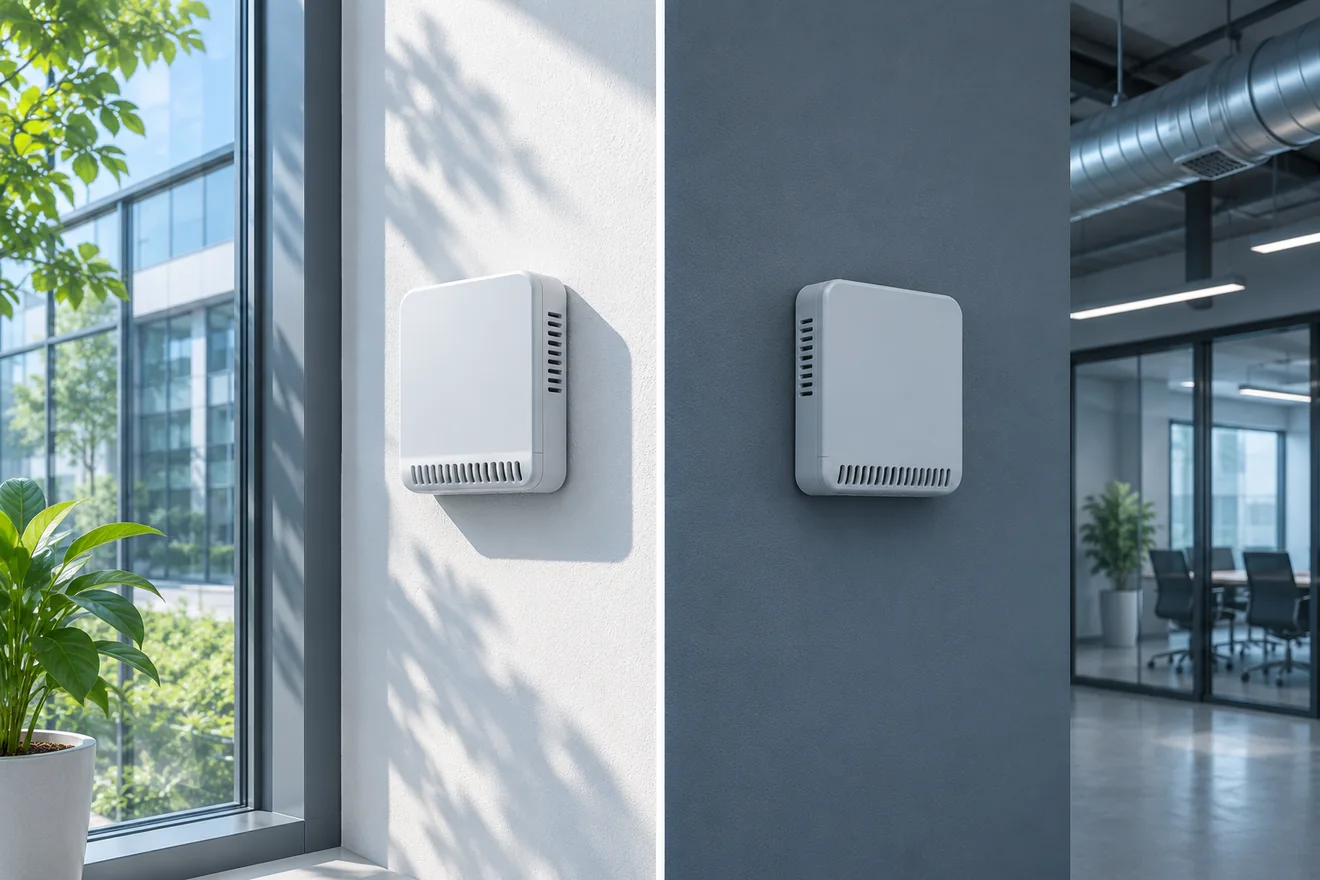
Compare candidate positions under conditions that can produce placement bias, including direct solar exposure.
Collect synchronized evidence without treating it as identical evidence
Set an observation window that covers the room's occupancy cycle and relevant HVAC events. Record how each channel is acquired, its update interval, the source of timestamps and any onboard averaging. Check clocks before comparing the apparent order of changes. A temperature rise stored every minute and a CO₂ value acquired every five minutes can seem to lead or lag each other purely because of acquisition timing. If the source values are not simultaneous, state how they were aligned and how far apart they can be before a calculated dew point is withheld.
Trend readings with their quality states and units. An intermittent wireless device might retransmit a held value, and the RH channel might recover later than the temperature channel after a restart. Keep gaps explicit. If computing dew point, use valid values from the same location and a compatible time window. Record the formula or calculation service and the rounding policy. A small shift in dew point should be interpreted in light of both sensor uncertainties rather than displayed as a precise moisture change.
Collect context at the same time. Occupancy count or schedule, outdoor temperature and moisture, window state, fan proof, operating mode, damper or airflow evidence and nearby activities can distinguish plausible explanations. Record any changes to the monitor position, firmware, offsets, enclosure or power mode. If the room underwent a meeting or housekeeping event, preserve the event time as an annotation. This kind of context makes comparison possible on a later day when the people who observed the event are unavailable.
| Pattern in valid readings | Possible explanation | Useful next evidence |
|---|---|---|
| CO₂ and temperature rise while RH falls | Occupant generation and sensible warming without a comparable moisture rise | Occupancy, calculated dew point and fan or heating mode |
| CO₂ falls while dew point rises | Dilution and increased vapor pressure occur together | Outdoor dew point, airflow mode and local moisture sources |
| Temperature falls, RH rises, dew point is stable | Sensible cooling dominates over the observed period | Coil or supply state, paired reference and local surfaces |
| All points jump or freeze together | Real event, shared acquisition issue or device restart | Status, timestamps, uptime and independent reference |
| CO₂ spikes only close to a seat | Local breath plume may be influencing the inlet | A second site away from direct breath, with matching timestamps |

The three traces can be aligned to events while preserving their separate units and interpretations. The display is conceptual.
Read three contrasting hypothetical building events
An occupied winter meeting. Occupants enter a room at 09:00. CO₂ gradually rises. The room warms from 20 °C to 24 °C, and RH drops from 50% to about 39%. The calculated dew point is almost unchanged. Under those stated conditions, the data support a sensible warming interpretation for the RH change. They do not establish whether occupant moisture release balanced drier incoming air or whether another process held vapor pressure steady. Check occupancy and mechanical state before changing ventilation or humidification.
A humid outdoor-air event. In warm weather, occupants leave, a scheduled outside-air mode continues and indoor CO₂ falls. Indoor dew point rises while dry-bulb temperature barely changes. More outdoor air could be introducing moisture if the outdoor dew point is higher and the conditioning system does not remove the additional vapor. The same pattern could also result from a separate moisture source or reduced latent removal after a mode change. Compare outdoor dew point, fan and outdoor-air evidence, cooling coil condition and timing. A lower CO₂ value can coexist with a moisture problem.
A biased wall installation. In the afternoon, a monitor near glass warms relative to a temporary comparison on an interior wall. It reports lower RH at the same time. The two locations have similar dew point estimates, and the CO₂ readings are comparable within the agreed comparison method. That pattern is consistent with local heating affecting the two thermal quantities. Repeat the comparison with a documented reference during sun and shade, allowing for response and instrument uncertainty. If the reference also shows a true spatial temperature difference, moving the transmitter changes the monitored location as well as its exposure. Record the reason and effective date.
These are three different questions with different supporting evidence. The first asks which part of an RH trend is temperature-related. The second asks whether an observed moisture change can be linked to outdoor conditions and equipment operation. The third asks whether the fixed point characterizes the room or a local microclimate. A generic combined score can hide those differences and make it harder to investigate.
Keep interpretation separate from control authority
A monitor can support several diagnostic tasks while only one or none of its channels is approved to drive HVAC control. Specify which point is authoritative for each sequence and which points are contextual. A room CO₂ point may support a demand calculation while a separate room temperature sensor supplies comfort control. An equipment or space humidity sensor may participate in a separate control sequence. Each needs its own valid range, fallback behavior, configuration and commissioning evidence.
Avoid encoding three observed thresholds into a single inference about adequate ventilation or comfort. Adequate CO₂ dilution under one occupancy condition leaves open humidity, temperature, particles and other pollutant questions. A stable RH trace at one location leaves open moisture conditions at cold surfaces, inside assemblies or in unmonitored spaces. A favorable temperature trend leaves open outdoor-air quantity. Operational criteria should come from the building's approved requirements and use rather than from applying one general number across building types.
For a monitor-only pilot, decide how staff should respond to each kind of event. A recurring occupancy-related CO₂ rise may lead to a schedule and airflow investigation. A repeatable rise in dew point may trigger a moisture or coil review. A disagreement among nearby temperature readings may require a siting or sensor comparison. Route these observations to the people able to verify the associated mechanism. The trend window and supporting evidence can be common without making the action common.
Establish a comparison that separates sensor bias from room variation
For a room survey, compare the fixed monitor with a suitable independent instrument in comparable air. Document the reference, its condition and the relevant specifications for each channel. Keep the instruments far enough apart to avoid blocking inlets, with comparable radiation exposure and local airflow. Let the devices stabilize under their own instructions, then compare readings using an agreed time window and method. A brief side-by-side spot reading while a wall device is warming up can overstate a disagreement.
Where temperature and RH differ, calculate dew point using each instrument's own paired values. A warmer device reporting lower RH at similar dew point can indicate that the two probes are sampling air of similar vapor pressure at different temperatures. If both probes are supposed to represent the same room location, investigate enclosure heating, wall influence and airflow. If the dew points also differ substantially, check sensor offsets, placement, actual moisture gradients and timing before assigning a cause. CO₂ agreement does not resolve the thermal question.
Repeat at another representative site if room gradients are likely. Measurements on a sunny wall and at a shaded central desk cannot distinguish device bias from a real temperature difference without further observations. Swap suitable temporary devices or colocate them in each environment while recording changes in sun, HVAC state and occupancy. Where the permanent sensor cannot be moved, compare a portable reference at both sites and state the uncertainty introduced by sequential measurements. A shared transition can be useful, but only if its timing is captured well enough to align observations.
| Comparison condition | What to document | How it helps |
|---|---|---|
| Co-located during stable conditions | Position, reference and stabilization time | Helps establish channel agreement |
| Similar humidity, different temperatures | Both T/RH pairs and dew points | Helps distinguish sensible heating and moisture |
| Room comparison at several positions | Source distance, occupancy and air path | Helps identify persistent spatial gradients |
| Morning start or sunny period | Equipment status and exposure timing | Helps uncover mode-related or enclosure bias |
| Monitor restart or missing samples | Quality transitions and each channel's recovery | Prevents misleading calculated values |
Accuracy and representativeness are separate. A monitor can accurately measure air near an external wall that differs from the occupied space. A representative site can still use an instrument with an offset. The acceptance record should preserve both findings. If the intended diagnostic question changes, reassess where the relevant air is. An outdoor-air intake check, a window-condensation investigation and an occupied-zone assessment may each require a different observation point.
Build a reporting view that preserves the physical distinctions
Use a common timeline with separate units and clearly labeled vertical axes. It can be useful to put CO₂, temperature, RH and calculated dew point in adjacent panels, then show occupancy and fan mode as event annotations. Avoid dual-axis presentation that makes unrelated magnitudes look interchangeable. If a common graphical scale is used to compare direction, disclose the normalization and retain access to original units and values.
Suppose an analyst receives a daily report showing 900 ppm mean CO₂, 22 °C mean temperature and 50% mean RH. Those three summaries might come from different valid portions of the day. The temperature-RH pair needed to compute dew point can be obscured, and a busy meeting can disappear into a daily mean. Calculate paired quantities from sufficiently aligned source values first, apply a clearly defined completeness rule, and summarize over a window that fits the question. If one channel has a gap, include the count or duration of usable paired samples.
Mark changes that can alter interpretation across weeks. A sensor moved away from a diffuser, a room reconfigured with partitions, a changed cooling schedule or a new correction in firmware can each change the observed series. A stable point label should not make the periods appear equivalent without a note. Document date, reason, changed settings, location and the validation used to resume reporting.
A reporting view can include a practical decision note for each observed pattern. When room CO₂ follows occupancy despite a steady temperature, review ventilation timing and delivery. When dew point rises with no corresponding CO₂ change, review moisture sources and conditioning. When temperature and RH diverge but dew point stays steady, compare sensible gains and placement. When all channels change at the same timestamp as a restart, verify acquisition quality first. These are investigation routes. Determine the actual cause with context appropriate to each channel.
Account for uncertainty in calculated dew point
An estimate of dew point inherits errors from both inputs and from the degree of time and location alignment. For example, at 22 °C, 50% RH gives a dew point near 11.1 °C. At the same temperature, 48% and 52% RH correspond to about 10.5 °C and 11.7 °C. These values illustrate the local sensitivity to RH alone using typical saturation behavior. A temperature error can shift the estimate as well, and an installed product's errors may be correlated. The arithmetic is not an uncertainty claim for any particular monitor.
Interpret a small change in dew point alongside the stability and agreement of the inputs. A constant half-degree difference across two instruments can reflect rounding, thermal offset or humidity accuracy. A repeated larger difference under a certain condition can justify checking a nearby moisture source or the operating system. If the decision depends on a surface close to the estimated dew point, obtain an appropriate surface temperature measurement and consider the combined uncertainty. A result a few tenths of a degree apart may leave the condensation diagnosis open.
Use like-for-like comparisons for outdoor and indoor air. A sheltered outdoor probe measures a different environment from an intake affected by hot roofing or nearby exhaust. For moisture-loading questions, select the outdoor observation that best represents the entering air under the operating condition. Document that measurement basis before interpreting a dew point difference as the effect of outdoor ventilation.
Frequently asked questions
Does a CO₂ increase mean humidity should increase?
No. Occupancy can introduce both CO₂ and moisture, but ventilation, dehumidification, temperature and other sources determine the two trends. Compare dew point and operating context before interpreting the RH direction.
Can I use outdoor RH alone to decide whether fresh air will dry a room?
No. RH is relative to saturation at the outdoor temperature. Compare indoor and outdoor dew point or humidity ratio and consider the effect of equipment conditioning and other moisture sources.
Should dew point be measured or calculated?
For many monitoring tasks a documented calculation from paired valid temperature and RH observations is useful. Its accuracy depends on both inputs and the calculation. An application requiring tighter moisture evidence may need a suitable independent reference and an explicit comparison method.
Can all three channels be checked with a single reference?
An integrated reference may supply all three, but verify its range, current condition, response and uncertainty separately for each channel. Similar placement and simultaneous observations help. Agreement in CO₂ does not establish agreement in temperature or RH.
How can I tell whether a low RH reading is real?
Check the temperature, exposure and enclosure conditions. Compare paired temperature and RH with a suitable reference in comparable air and calculate dew point from both valid pairs. The result can separate a real moisture difference from local heating or channel bias.






Leave a Reply