
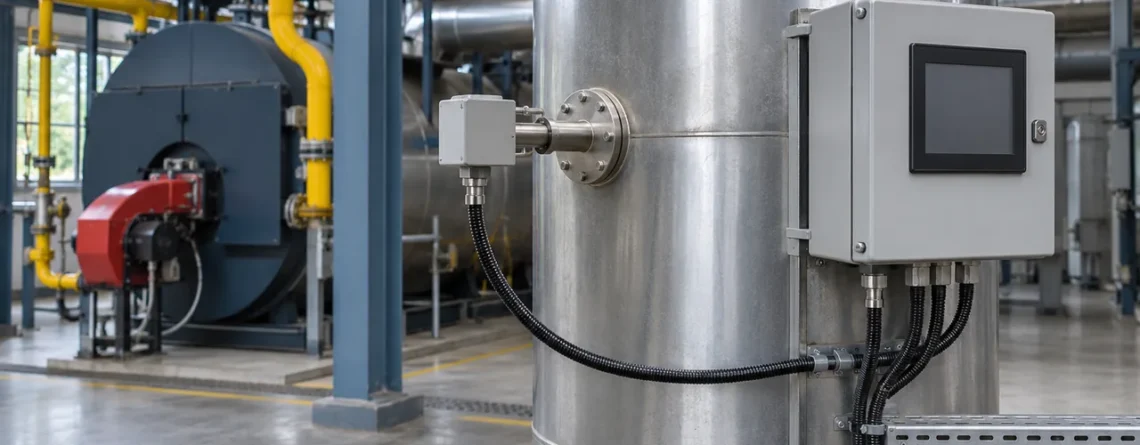
Flue gas oxygen is the oxygen in combustion exhaust at a defined sampling point. Room oxygen is the oxygen in the air at a defined location where people may work or enter. Both instruments may show percent O₂. The flue value describes a process stream, often on a stated wet or dry basis. The room value describes a sample of the ambient atmosphere and can support a specific workplace decision when the instrument and sampling strategy are suitable.
Comparing flue analyzers calls for the same sample boundary, operating period and concentration basis. Comparing a room monitor with a flue analyzer generally answers a different question. One instrument might sample heated exhaust inside a duct and use room air as a reference. The other samples the air itself. Even when the reference gas is ambient air, a flue probe’s measurement is still the exhaust at the sensing element.
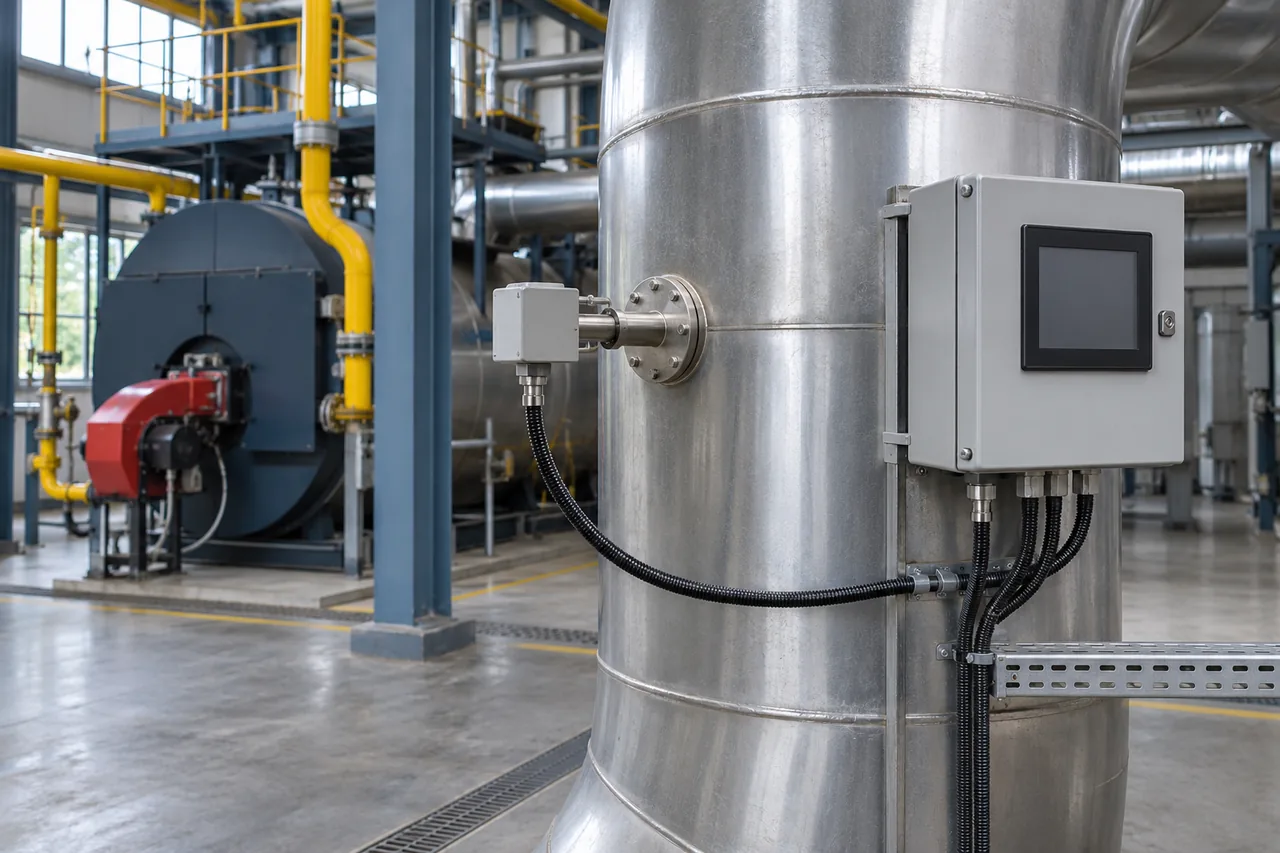
A flue is the process sample boundary, distinct from occupied air.
The two oxygen readings refer to different gas populations
Oxygen remaining in a flue is affected by combustion, fuel and air supply, and any dilution or leakage upstream of the measurement point. Exhaust can contain water vapor, carbon dioxide, residual oxygen and other constituents depending on the process. Its temperature, pressure, velocity and particulate loading can change with equipment state. An exhaust reading at one point describes what the analyzer sampled there, under those conditions. A point upstream of an air leak or downstream of a mixing junction can report a different value even if both instruments are working properly.
Room oxygen describes the air that reaches an ambient detector. Outdoor air supply, local displacement, ventilation patterns, enclosure geometry and worker movement can affect the sample. A fixed point characterizes its own location over time. A portable instrument can follow a person or a defined sampling plan. A remote pump and tube add a transport step. Each arrangement needs an explicit statement of what air it samples and when.
| Comparison | Flue oxygen | Room oxygen |
|---|---|---|
| Sample boundary | Hot gas in a duct or a conditioned exhaust sample | Ambient air at a detector or remote sample point |
| Primary question | What oxygen fraction is present in this exhaust under the stated conditions? | What oxygen fraction or indicated oxygen level is present in this atmosphere under the defined method? |
| Common configurations | In-situ point probe, optical path or extractive analyzer | Fixed ambient detector or portable direct-reading instrument |
| Information that changes interpretation | Wet or dry basis, measurement location, operating load, sampling integrity, time alignment | Location, work activity, airflow, pressure conditions, instrument mode and validity |
| Relevant verification | Analyzer calibration and applicable sample-path or regulatory performance checks | Instrument and sample-path checks defined by the manufacturer and workplace or fixed-system procedure |
Two readings may be synchronized without becoming comparable. A process system may log flue oxygen every few seconds, while a safety system records room oxygen and local alarm status on an independent clock. Correlating the records can help investigate when events occurred. A rise or fall in the flue value cannot by itself establish the room concentration or its cause. Investigators need the source, path and appropriate ambient readings for that inference.
How a flue analyzer gets its oxygen reading
In-situ zirconia probes
A zirconia concentration cell compares oxygen partial pressures at two sides of a heated ceramic element. A sample-facing side sees the process gas. The reference side sees a known oxygen environment defined by the design. The voltage and the element temperature are used to infer the oxygen content. The manufacturer’s zirconia technology description explains the solid electrolyte, catalytic electrodes and reference side.
An in-situ probe places the measurement at the process without transporting the main sample through a long external line. This can avoid the delay and water handling introduced by an extractive system, while exposing the probe assembly to process temperature, contamination and material constraints. Where water vapor remains in the gas and the instrument reports the as-sampled fraction, the measurement is on a wet basis. The Preferred Utilities ZP product documentation identifies that basis for its model. Other instruments can offer different processing or display options, so check the selected channel and data output.
Hot zirconia cells can give biased results if combustible species react in the sensing region. A small amount of oxygen consumed locally changes what the cell sees relative to the incoming gas. The actual applicability depends on the design and sample. Verify the manufacturer’s permitted sample composition rather than using a general assertion that a zirconia probe is suitable for every combustion condition. Reference-side obstruction, heater faults and leaks may also change the indicated value or invalidate it. A status point and calibration record help separate a process change from an instrument change.
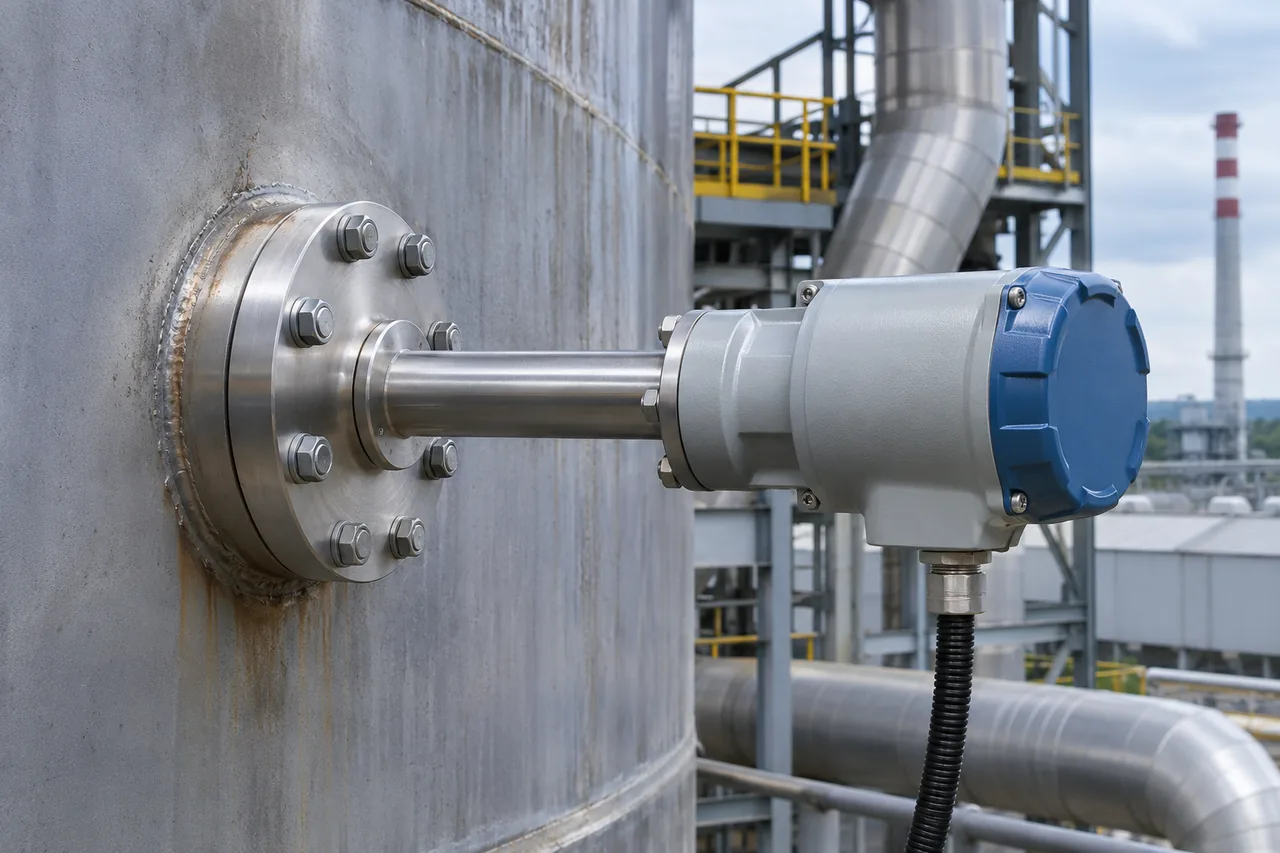
An in-situ measurement observes the gas at the probe or sensing path.
Extractive paramagnetic and other analyzer configurations
An extractive system draws gas from a selected point and carries it to the analyzer. Its design can include a heated line, particle filtration, a sample pump, a cooler or dryer, pressure or flow control and a drain. The presence and position of these components determine what reaches the detector. Water may be intentionally removed for dry-basis measurement. A heated system may instead preserve moisture through the measurement, if the analyzer and method support it. The analyzer technology alone does not determine the result’s basis.
A paramagnetic analyzer uses oxygen’s attraction to a magnetic field. The exact mechanism differs by design. Sample conditioning, pressure, flow, vibration, background gases and contamination can affect specific instruments. A manufacturer's published suitability depends on the gas properties and the installed configuration. Other extractive analyzers may use an electrochemical cell or a different oxygen measurement technology. A portable service analyzer is an example of a specialized extractive arrangement when a probe, tubing and pump take the sample to the instrument.
A tunable diode laser analyzer measures absorption along an optical path using an oxygen absorption feature where the design supports it. A path across a duct represents the gas along that path. A point probe represents a smaller region. A path average and point measurement can differ across a stratified flow. Light attenuation, optical alignment, temperature and pressure handling are relevant to the exact instrument. Yokogawa’s oxygen analyzer technology comparison describes zirconia, magnetic and laser arrangements and their application considerations.
| Arrangement | What to establish | What can make comparison difficult |
|---|---|---|
| In-situ zirconia probe | Actual insertion, reference condition, process limits, reported basis and fault status | Local gradients, reference faults, combustible interference or probe fouling |
| Extractive analyzer | Sample point, leak integrity, flow, conditioning and analyzer reporting basis | Transport delay, unwanted condensation, ambient air ingress or changed water content |
| In-situ optical path | Beam path, optical access, alignment and compensation | Path average versus local point, changing gas or optical conditions |
| Portable combustion analyzer | Correct mode, probe location, sample handling and appliance conditions | Different port, service test duration, probe leakage or an output that is calculated rather than directly measured |
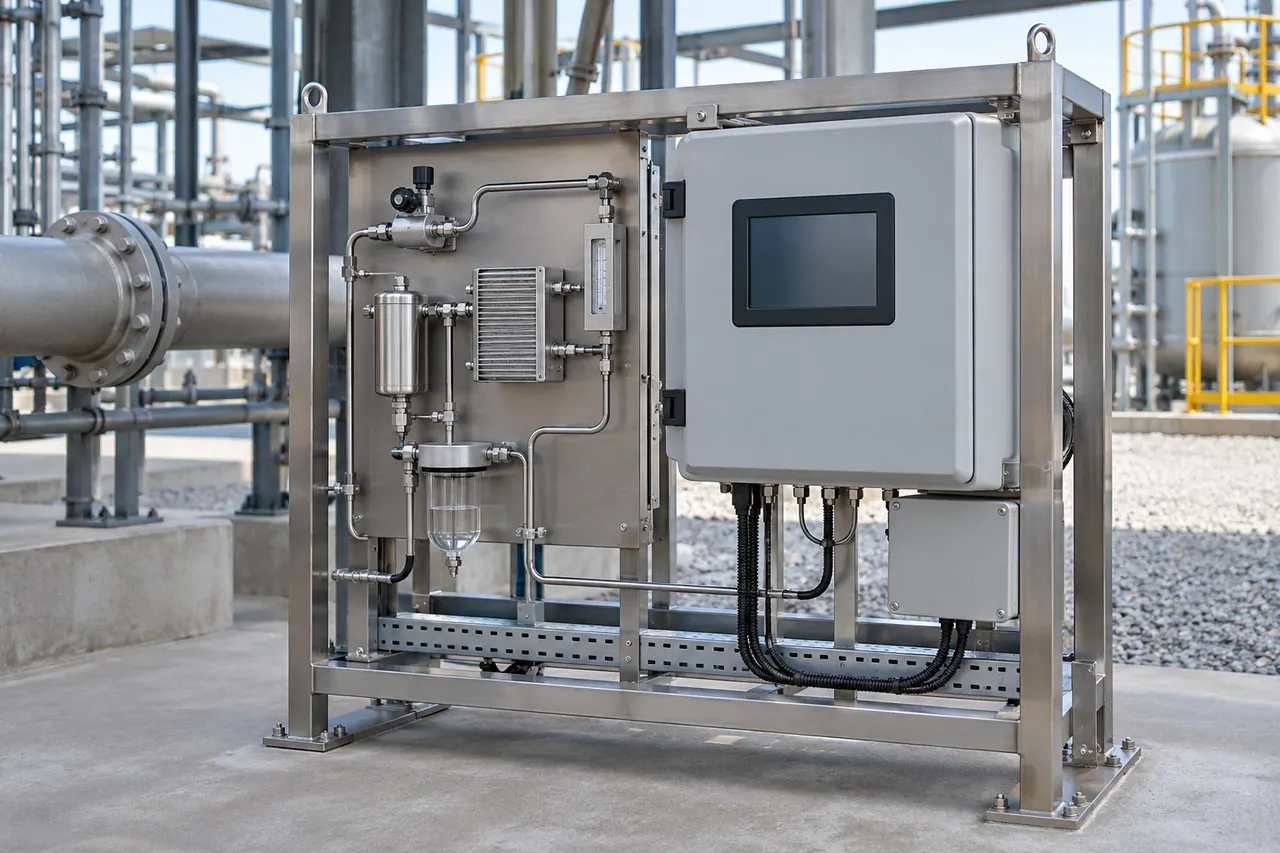
An extractive path can condition gas before the detector sees it.
Why an upstream port and a downstream analyzer can disagree
Imagine a fixed probe upstream of a dilution junction and a portable instrument at a downstream service opening. Some external air enters between the ports during the observation. The downstream value can move toward the oxygen fraction of that external air. The upstream and downstream results may be correct for their own locations. Converting both to the same moisture basis cannot remove a real difference in gas composition. Check the piping and duct drawings, actual port positions and any nearby branches before using the two results to evaluate instrument error.
An extractive analyzer adds another possible explanation. If its sample line or fitting admits surrounding air under suction, the analyzer may see a diluted sample even when both probes are nominally in the same section. The right comparison starts with the design or test procedure, where qualified personnel determine how to evaluate sample integrity. A higher oxygen reading alone cannot distinguish duct dilution from a sample-system leak or true process change. Preserve other readings and system status so those possibilities can be evaluated.
Wet and dry basis can make the same sample look different
A concentration is a fraction of the gas mixture. A wet-basis result uses the entire gas mixture, including water vapor. A dry-basis result uses the mixture after excluding water from the denominator. If only water is excluded, the same oxygen amount is divided by a smaller total, so the reported dry fraction is larger than the wet fraction whenever the water fraction is positive.
Let x be the wet oxygen mole fraction and w the wet water vapor mole fraction in the same sample. The corresponding dry oxygen mole fraction is x divided by (1 − w). Use fractions consistently. A water content of 10% corresponds to w = 0.10. Converting back to wet basis multiplies the dry fraction by (1 − w). When a specific measurement method defines its own calculation, correction or reporting conventions, use those definitions.
Hypothetical same-sample comparison
Suppose a gas mixture contains 3.60% O₂ on a wet basis and 10.0% water vapor by mole on the same basis. Removing the water leaves 90.0% of the original gas amount for the dry denominator. The resulting oxygen concentration is 3.60% divided by 0.900, or 4.00% dry O₂. The two values differ by 0.40 percentage points and describe the same original mixture under the assumptions.
| Hypothetical quantity | Reported value |
|---|---|
| Wet O₂ fraction | 3.60% |
| Wet water vapor fraction | 10.0% |
| Fraction remaining after water is excluded | 90.0% |
| Equivalent dry O₂ fraction | 4.00% |
| Difference between reported values | 0.40 percentage points |
The example is arithmetic and supplies no operating target for a boiler. To apply a conversion to real data, establish whether moisture was measured or otherwise determined under the applicable method, whether it represents the same gas and time, and whether the oxygen display was already converted. A cold sample trap does not automatically prove that a published number is on the desired basis. A dry-basis instrument can have residual water effects or a manufacturer-defined condition that must be accounted for. Follow the instrument and method definitions.
Air-free or reference-oxygen results answer another question
A report may also correct a pollutant concentration to a reference oxygen basis. Such a correction uses oxygen to standardize reporting under a defined procedure. It is different from removing water from the denominator, and it is different from reporting the actual oxygen in the gas. A comparison of two CO results, for example, needs the same definitions for moisture and any oxygen correction. Keep the directly measured value, oxygen reading, applicable basis and reported result available together when the procedure requires them.
EPA Method 3A illustrates these measurement boundaries. It is an instrumental method for oxygen and carbon dioxide in stationary-source emissions when required by the governing US rule or permit. It refers to performance and sampling provisions, including when dry gases or dry-basis systems can use different sample line arrangements. A regulatory method is selected by the actual measurement obligation. A boiler service reading, process trend and emissions result each have their own purpose and evidence requirements.
Room oxygen belongs to the workplace atmosphere being assessed
Ambient oxygen measurement may be relevant where the hazard assessment identifies displacement, enrichment or oxygen consumption. A worker entering a restricted space and an operator viewing a fixed room transmitter have different coverage. A fixed monitor measures the gas at its inlet. A portable pumped unit samples at its probe and adds transport delay and possible line restrictions. A diffusion unit measures gas arriving at the instrument. The selected arrangement must be suited to the task and used under the applicable workplace procedure.
Atmospheric pressure matters to certain technologies and to human exposure. Some ambient oxygen sensing elements respond to oxygen partial pressure and the instrument’s behavior depends on its design and compensation. A device’s displayed oxygen percentage and its environmental limits should be interpreted using its instructions and the relevant safety program. Elevation and pressure changes can affect the interpretation even when a numerical concentration comparison looks straightforward. A flue analyzer’s partial-pressure principle is therefore useful for understanding instruments, while the process reading has no direct role in declaring an ambient atmosphere suitable.
In US federal general industry, OSHA 29 CFR 1910.146 defines oxygen deficiency below 19.5% by volume and oxygen enrichment above 23.5% by volume for its permit-required confined-space framework. That scope matters. These are definitions in a specific regulation, with employer evaluation and entry provisions that depend on the work and space. They do not serve as universal building detector setpoints or authorizations to enter. Other countries, states and industry contexts can have their own governing requirements.
A reading near the ordinary oxygen concentration cannot establish the absence of toxic or flammable gases. An oxygen channel answers a question about oxygen under its measurement conditions. The site’s hazard assessment identifies which other channels and decisions are relevant. For example, a workplace can need carbon monoxide information even when oxygen changes very little. The operator’s trend or work record should retain the status of each channel rather than compressing them into an unexplained overall reading.
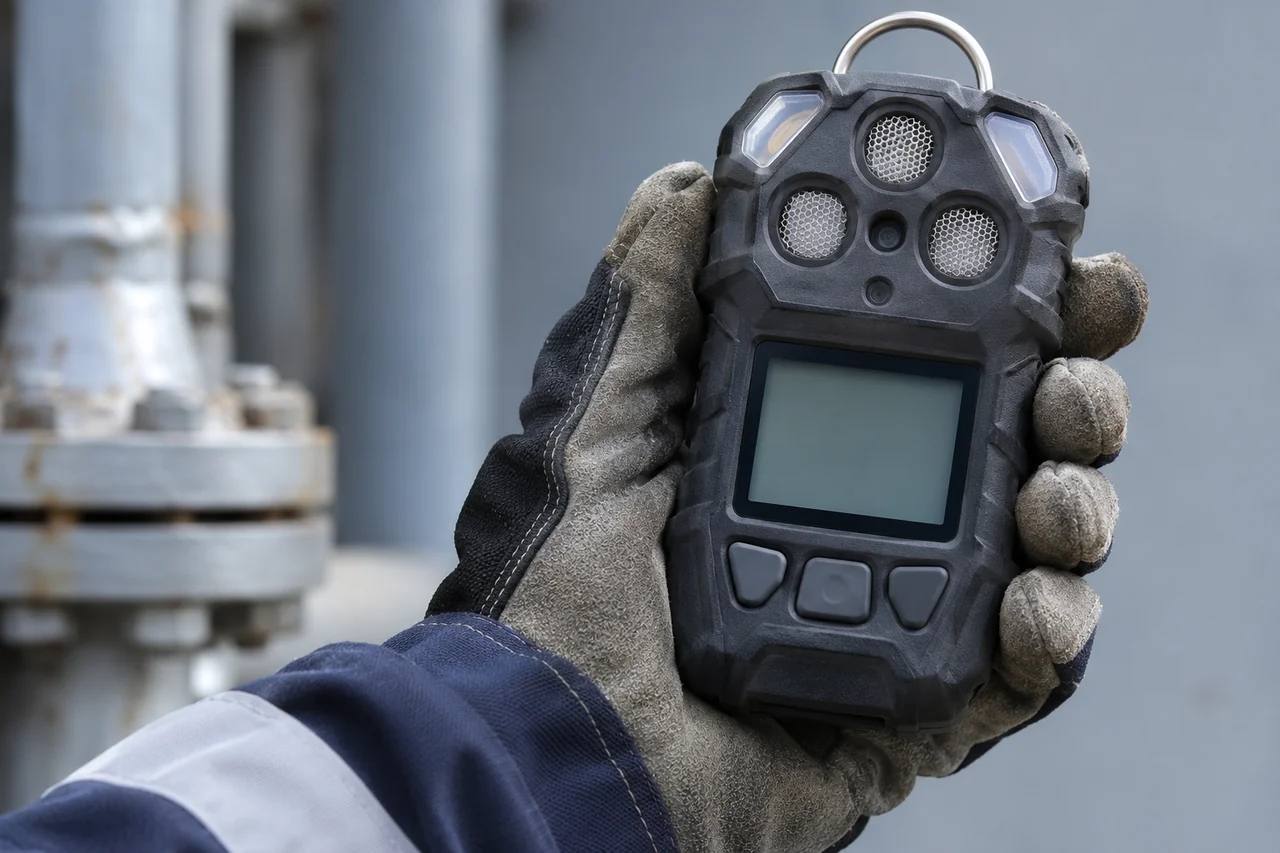
An ambient monitor samples air at its own inlet or designated probe.
Verify the path that produced the value
A flue sample can be validated at several boundaries. An analyzer check examines the sensing and indication under defined test conditions. A system check can include the probe, transport and conditioning path. A method can require additional evidence about sampling location, analyzer response or interference. Describe which part of the path the check included. If calibration gas reaches an analyzer downstream of the sample conditioning, that exercise cannot by itself establish the integrity of a remote probe and line.
For an ambient direct-reading instrument, a response check and a calibration check answer different questions. A functional check can show that the instrument responds and its warning works as intended under the test. A calibration check assesses indication against a suitable known concentration within the prescribed tolerance. OSHA’s direct-reading portable monitor bulletin explains these distinctions and the role of manufacturer procedures. The bump-test explanation provides related background. Fixed instruments have their own installed checks and project requirements. Pumped configurations also depend on sample-path condition and time delay.
When comparing records, bring the equipment identity and instrument state into the comparison. A reading after maintenance can be affected by a changed range, dry-basis conversion, probe replacement or location change. A historian may preserve an old point name even when the engineering units or signal scaling have changed. A valid calibration and a correct trend label are both necessary for reliable interpretation.
| Record item | Flue result | Ambient result |
|---|---|---|
| Measurement identity | Equipment tag, port or path, analyzer and intended method | Space or person, sample point and monitor identity |
| Time and operating state | Collection interval, process load, equipment transitions and sample delay | Work activity, ventilation, sample delay and observation interval |
| Data definition | O₂ unit, moisture basis, directly measured or derived and output configuration | O₂ unit, instrument mode, environmental conditions and validity |
| Sample evidence | Line or probe integrity, conditioning, calibration and applicable system check | Inlet or probe, flow if applicable, instrument check and task procedure |
| Disposition | Accept, hold or review for the stated process or reporting purpose | Interpret under the responsible workplace or fixed monitoring procedure |
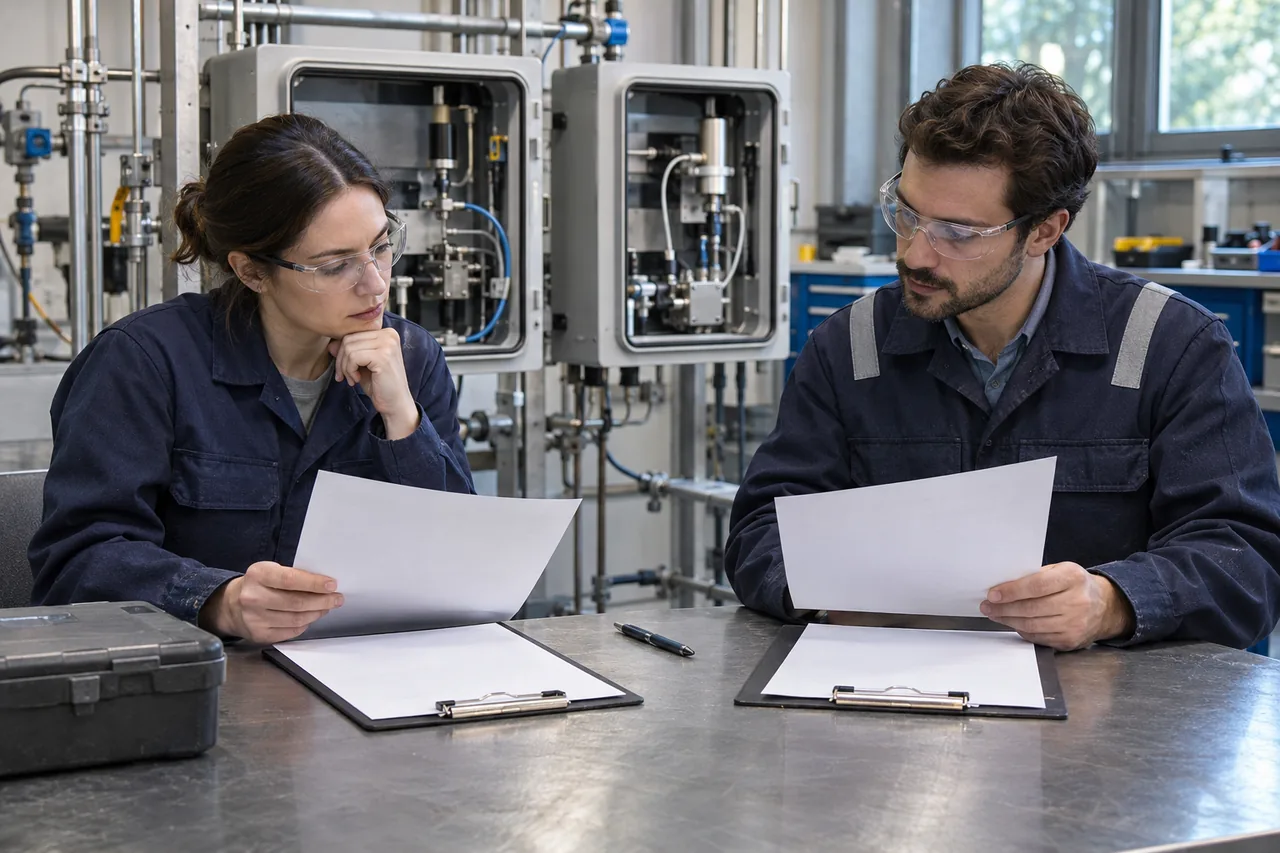
A useful review preserves instrument, sample and reporting identity.
Hypothetical review of three traces
A plant operator reviews a fixed flue trend, a portable combustion service result and a room oxygen trend. The fixed probe reports a wet result. The portable analyzer reports a dry result at a different port. The ambient trend is recorded near a service entrance. Before comparing the two flue values, establish whether their sampling times and equipment loads match. Then check sample location and conditioning and see whether a reliable moisture conversion is available. A residual difference can still reflect a gradient or a transport problem.
The ambient trend remains a separate record. If the building team is investigating a workplace event, the entrance monitor’s status and coverage are useful facts. They cannot establish the atmosphere at another location by themselves. Record any applicable worker or area observations separately, identify how the instruments were verified and avoid overwriting the original times or units while combining reports.
If the portable value has no stated basis, keep its measurement definition unresolved. A vendor description that the instrument can report dry results does not identify the mode used on that job. The original record, configuration or qualified testing under the defined method can close that gap. This is often more informative than applying a generic assumed moisture value to force agreement.
Read the timeline as part of the sample path
Two instruments can sample comparable gas and report on different clocks. In-situ sensing, extractive transport, detector filtering and historian averaging each contribute a distinct time scale. A service technician might write down a stabilized display after waiting under the appliance procedure. The plant historian might store an average over the preceding reporting interval. An extractive monitor might show a change after the duct process has already moved on. If the comparison concerns a transition, ask what instant or interval each value actually represents and where timestamps are assigned.
In a hypothetical trend review, a process point changes at the duct while an extractive system has a documented 18-second transport time before any analyzer or historian delay. Suppose a recorder labels a value at the end of its collection window. The duct sample underlying that label is older than the display time by at least the transport contribution, with any averaging and instrument response still to be accounted for. Subtracting a guessed constant from an averaged value does not reconstruct the original transient. Compare stable intervals where permitted by the investigation, or preserve sufficient time-resolved information and approved delay evidence to compare the transient correctly.
A room safety record may have yet another logging path. A local instrument can process an event before a supervisory system polls it. A historian may suppress repeated values or skip missing records. Preserve the local event time, alarm state and validity if those records are available. For a pumped ambient sample, the relevant delay starts where the sample entered the line. The interval is an instrument and procedure issue, independent of the flue analyzer’s delay.
Consider the limits of a clean-looking overlay. Curves can appear to line up because both respond to a broad change in building operation even when they observe different gas populations. A time shift that visually aligns the curves does not identify a common source. Verify point location, equipment and ventilation states and the actual sample path before drawing a connection. The central question remains whether the recorded evidence supports the process or workplace decision at hand.
Choose a result that can be reproduced by another reviewer
A reviewer should be able to identify the instrument, retrieve the point configuration and understand why the comparison was made. For a flue result, record whether oxygen was measured directly or computed from another reading, and whether the value was observed live, copied from a report or taken from a trend. Preserve the moisture and correction information that went into any conversion. For an ambient result, keep the intended work or area boundary, the method and the device’s operating status alongside the concentration. When a source leaves the basis or sample location unknown, record the gap directly. It may be possible to use the value as supporting context while holding it out of a numerical agreement decision.
Frequently asked questions
Is in-situ oxygen always wet and extractive oxygen always dry?
A probe that sees the wet gas and reports the as-sampled fraction gives a wet-basis value. An extractive instrument can remove or preserve moisture, depending on its design. Either system can use a derived output if configured and supported. Verify the reporting basis from the exact instrument and method.
Can room air be used as a calibration or reference gas?
Some instruments use ambient air as a reference or provide a manufacturer-defined fresh-air procedure. A regulatory method may specify when a suitable air source can serve a calibration purpose. The actual use depends on the analyzer design and applicable procedure. Reference gas also has a different role from the flue sample being measured.
Why did the flue value change when the room reading did not?
Process gas composition and dilution can change with equipment conditions while the monitored room sample stays similar. Compare the instrument locations, operating records and status. An investigation of a possible ambient hazard needs evidence from the relevant area or workplace sample.
Does a higher dry-basis value mean the flue contains more oxygen?
For the same original gas, a dry-basis percentage can be higher solely because water was removed from the denominator. A statement about how much oxygen is flowing would need gas flow and a defined mass or molar basis as well as concentration.
How should a chart label the two traces?
Use distinct point names such as flue O₂ at the named equipment and port, and ambient O₂ at the named room point. Include percent, wet or dry basis for the flue result, timestamps and validity where the application needs them. Keep separate status and history when combining displays.







Leave a Reply