

Un sensor de CO₂ está listo para integrarse cuando el sistema de automatización de edificios (BAS) puede identificar su ubicación y significado, adquirir el valor de ingeniería correcto, reconocer datos no válidos o obsoletos y retener evidencia con la resolución requerida. Especifique esos comportamientos en un contrato de puntos antes de elegir una puerta de enlace o importar una lista de objetos. Un número de ppm mostrado verifica solo una pequeña parte del camino desde el sensor hasta las decisiones de construcción que dependen de él.
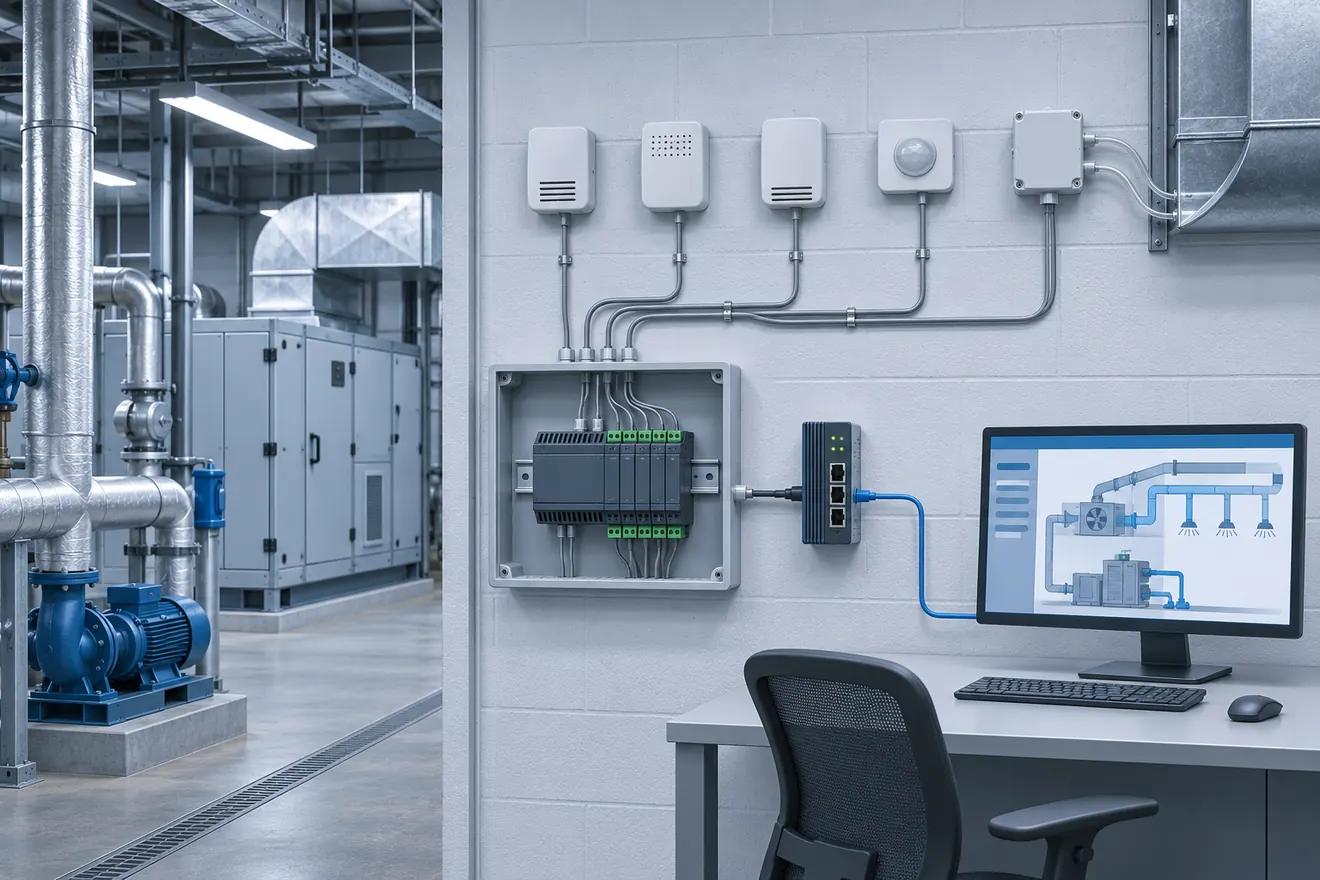
Un contrato de integración describe lo que sobrevive a cada transferencia entre el dispositivo de campo y sus consumidores.
Dale al punto un contrato con un consumidor real.
Begin by stating the consumer's purpose. An operator might review weekly occupancy-related CO₂ patterns. A building engineer might use recent samples in a diagnostic comparison. A local controller might use a verified CO₂ input in an approved ventilation sequence. The same physical sensor can serve more than one purpose, but each consumer has different tolerance for latency, unavailable history and unreliable values. Decide which use is supported and where the authoritative measurement resides.
El contrato de puntos combina identidad, interfaz, semántica, tiempo, calidad y verificación. Defina un identificador estable que pueda sobrevivir a un cambio de nombre de gráficos o un reemplazo de controlador. Asócielo con su habitación, zona, equipo y sensor según corresponda. La ubicación física del muestreo y la zona de control son campos separados. Una concentración de aire de retorno puede pertenecer a una unidad central sin representar cada habitación a la que sirve. Si se comparte una ubicación o se reubica el sensor, registre la fecha de vigencia y brinde a los usuarios del historial suficiente información para reconocer el cambio.
| Artículo del contrato | que grabar | Prueba de aceptación |
|---|---|---|
| Identidad | ID de punto estable, sensor físico, habitación, zona atendida y propietario | El mapa construido y la etiqueta del campo coinciden con el punto en vivo |
| Valor | Gas, unidad de ingeniería, escala, rango, cantidad, función y precisión. | La entrada o comparación conocida es rastreable a través de todas las asignaciones |
| Adquisición | Interfaz, dirección de origen, ruta de lectura, modo de actualización y cadencia | Los datos se reciben a la cadencia esperada bajo carga. |
| Calidad | Validez, falla, no disponible, calentamiento, anulación y semántica obsoleta | Los estados simulados u observados llegan correctamente a cada consumidor |
| Tiempo | Hora de origen versus hora de recepción, zona horaria, sincronización y política de brechas | Los eventos de secuencia se pueden ordenar entre dispositivos |
| Historia | Modo de muestreo, intervalo o banda muerta, retención y exportación | La exportación conserva significado, calidad e intervalos. |
| Usar | Monitorear, valor derivado o entrada de control aprobada con respaldo | Pérdida, restauración y uso previsto verificado con el propietario. |
| Ciclo vital | Proceso de revisión, reemplazo y revisión de firmware y mapeo | Handoff incluye artefactos editables e identificadores de evidencia. |
Una etiqueta BAS que dice "CO2" no garantiza que represente una concentración medida directamente. Un sensor de habitación, un valor mínimo promedio, un máximo seleccionado, un punto de ajuste de supervisión y una señal de aviso deben tener identificadores y funciones distintos. Si un monitor informa CO₂ estimado inferido de otro canal, conserve ese método y manténgalo distinto del CO₂ medido directamente. Una estadística derivada necesita el cálculo, las entradas de origen, el comportamiento de las entradas faltantes y la versión registrada. Dos puntos mostrados con la misma unidad pueden tener diferentes significados y diferentes permisos.
Project Haystack's point documentation ilustra una distinción semántica entre sensores, comandos y puntos de ajuste. También documenta referencias a equipos y espacios, unidades para datos numéricos y etiquetas para zona horaria, modo de historial y estado del historial. Las etiquetas ayudan a compartir significado entre sistemas. No pueden establecer que un punto en particular fue asignado a la terminal física o sala correcta.
Distinguir el módulo de gas de la interfaz BAS
A gas module's connector is often designed for a short local link to a host circuit. UART describes serial signaling at one layer and does not guarantee a BACnet or Modbus interface. An I²C output may be useful inside an instrument, but a field system needs a host or transmitter designed to translate the value, maintain its validity and survive the installation conditions. Even when two devices use an RS-485 physical layer, their protocol framing and addressing can be incompatible.
El transmisor instalado puede convertir un valor del módulo de detección a un voltaje o corriente analógico, publicar objetos de red o hacer ambas cosas. La salida eléctrica introduce un límite de escala; la salida digital introduce límites de tipificación y mapeo de datos. La pantalla local puede recibir una señal filtrada diferente de cualquiera de las salidas. Confirme la documentación y el firmware del modelo instalado, no de un producto hermano o de una placa de comunicaciones con un nombre similar.
Una puerta de enlace puede adquirir un punto de habitación de una red serie y exponerlo en BACnet/IP, reenviar datos a un historiador o transformar el punto en un esquema de nomenclatura de proyecto. Cada función puede cambiar de significado. Por ejemplo, una puerta de enlace podría repetir el último valor válido durante una interrupción de la red de campo. El cliente podría entonces recibir una respuesta aparentemente nueva que contenga una lectura antigua. Un proyecto que utilice una puerta de enlace de este tipo necesita una actualización de la fuente o un indicador de antigüedad además del estado de las comunicaciones en la interfaz externa.
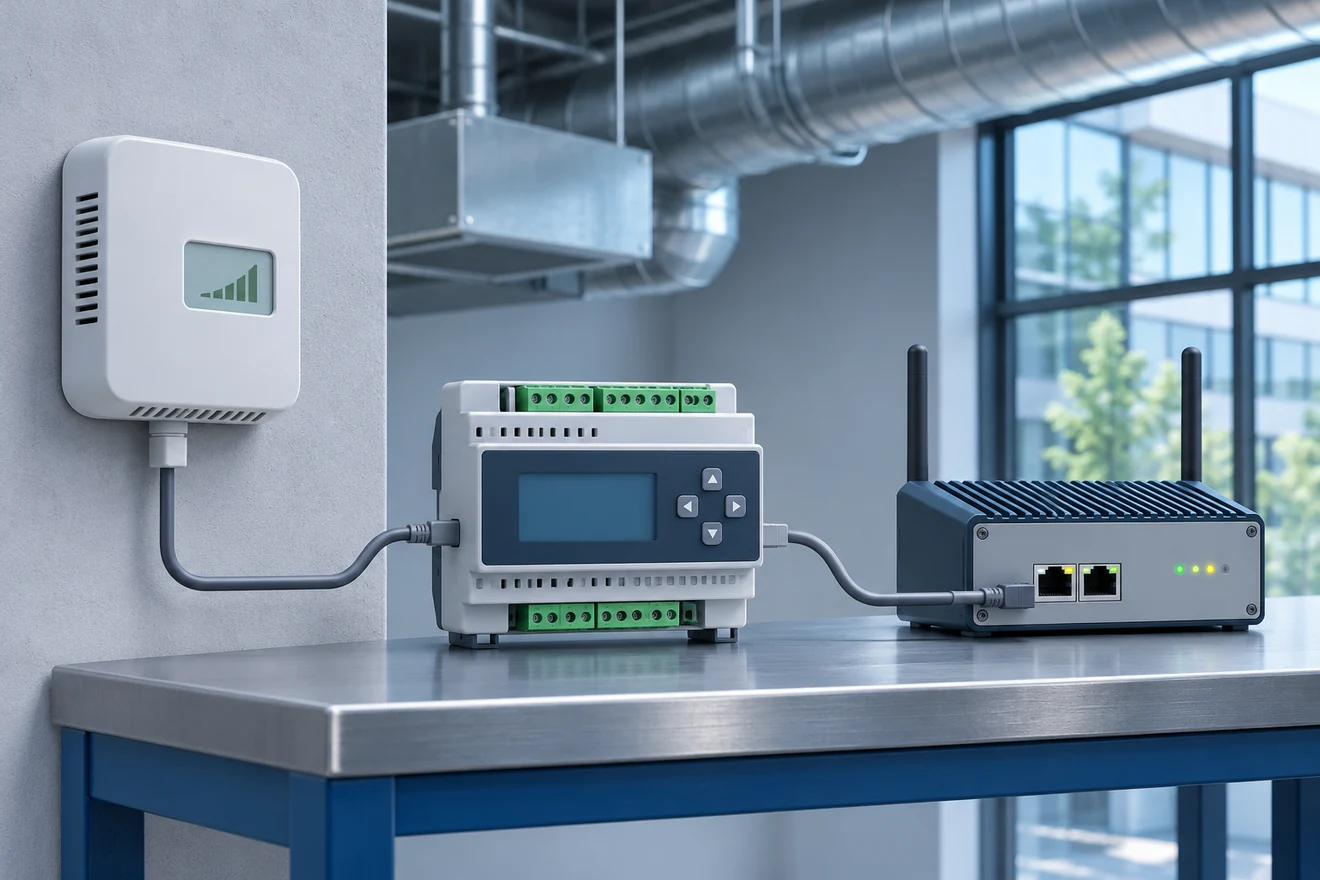
El sensor, la interfaz de campo y la puerta de enlace BAS tienen diferentes responsabilidades para el mismo valor.
Verificar el escalado analógico y la decodificación digital.
Para un transmisor hipotético configurado para una salida lineal de 4 a 20 mA que abarca de 0 a 2000 ppm, la conversión es ppm = (mA − 4) × 125. Los valores esperados son 0 ppm a 4 mA, 500 ppm a 8 mA, 1000 ppm a 12 mA y 2000 ppm a 20 mA. Estos son ejemplos de escala en lugar de rangos de transmisor recomendados o niveles de prueba de campo. Un receptor configurado en 0–20 mA y 0–2000 ppm mostraría 1200 ppm con los mismos 12 mA. El error resultante proviene de puntos finales incompatibles.
Check both ends of an analog path. Record the transmitter's configured range, selected output mode and fault behavior. Record the receiver terminal, input type, configured endpoints, engineering unit, expected accuracy contribution and applied filtering. A high or low fault current might be meaningful for one device and unsupported by another. Define what the controller does outside the expected range from the approved documents. A controller that clamps every low signal to the minimum ppm value may hide wiring faults or warm-up states.
Para un punto digital, obtenga la revisión del mapeo del fabricante y documente el registro o identificador del objeto. Para Modbus, verifique el tipo o función de registro, la convención de numeración de direcciones, el tipo de datos, el signo, el orden de bytes y palabras para valores de registros múltiples, la escala, el desplazamiento y la codificación de valores no válidos. La representación depende del modelo. En una codificación entera hipotética con 0,1 ppm por conteo, un valor bruto de 8350 representa 835 ppm. Leer la dirección correcta con el factor incorrecto arrojaría 8350 ppm, incluso aunque la pila de comunicaciones informe una transacción exitosa.
Keep the number used in the vendor manual and the address used in the integration tool when they follow different conventions. Also keep a decoded example and a raw value example with the map revision. The person replacing a gateway should be able to tell whether a displayed "40001" is a label or an address already interpreted by software. Johnson Controls' Metasys point-mapping documentation illustrates a vendor-specific commissioning workflow; the field device documentation supplies the actual interpretation.
For BACnet, identify the device and object type/instance together with the property read and the engineering units used by the project. Confirm whether the point represents a physical input, a derived value, a communicated proxy or a setpoint. The manufacturer's Protocol Implementation Conformance Statement (PICS) helps identify supported BACnet functionality. It does not establish project point mappings, actual device configuration or the application behavior under a fault. BACnet International glossary
A real equipment example is Trane's Symbio integration guide, which distinguishes local and communicated points and documents an arbitrated result for applicable inputs. The lesson is to name the exact exposed quantity before trend or control users infer a physical origin from the label. The project's observed source should be checked through mode changes and loss or restoration of the communicated input. Guía de integración de Trane Symbio BACnet y Modbus

Una entrada eléctrica verificada ayuda a separar el escalado de la interfaz de la medición de concentración subyacente.
Mantenga visible el valor, la calidad y el modo del equipo.
Una lectura exitosa puede devolver un valor que debería excluirse del control o la interpretación. Es posible que el sensor se esté calentando, que el valor de una lectura anterior se haya mantenido, que el punto esté anulado o que el transmisor esté fuera de su rango especificado. Preservar el estado de origen y mantener una decisión de usabilidad específica del consumidor. Para un objeto BACnet, verifique qué propiedades de confiabilidad y estado aplicables se implementan y se transmiten a través de la interfaz. Para obtener un punto de registro, consulte la fuente de diagnóstico documentada. Una bandera de protocolo faltante no necesariamente indica datos válidos.
Separate measurement health from equipment operating mode. A reading may be valid during a fan shutdown but may belong to a different operating context than a reading made during normal occupied operation. Conversely, a fan may be running normally while the CO₂ input is invalid. Store both when analysis depends on the distinction. If the sensor is intentionally simulated or the point is out of service during an approved test, preserve that state along with the values in the export.
A last-known value can be useful on an operator display if accompanied by its age and status. It can be misleading on a chart that draws a line across a gap or a control loop that assumes every poll retrieves a new sample. Define whether stale data is excluded from computation, annotated in the display, logged as a gap or passed with a separate flag. For a permitted control use, document the approved fallback separately and verify that it engages when the actual input becomes unusable.
Distinga un instrumento que informa una concentración válida y estable de una puerta de enlace que está congelada. La igualdad de valores no puede establecer frescura. Una marca de tiempo, una secuencia de adquisición, un latido definido explícitamente o un registro de fallas pueden proporcionar la evidencia necesaria. Si la integración no puede distinguir esos estados, registre la limitación en el contrato y decida qué consumidores pueden usar el punto dada esa evidencia.
Separar los relojes de las políticas de muestreo.
Anote la actualización de la medición del sensor, el escaneo o sondeo del controlador, la actualización de la puerta de enlace y el intervalo de registro del historial. Estos períodos pueden diferir y no definen el tiempo de respuesta del sensor. Una actualización BAS de cinco segundos puede mostrar diez valores idénticos de un sensor que produce una nueva medición cada 50 segundos. Un archivo de un minuto puede omitir actualizaciones intermedias incluso cuando el controlador las usa en una secuencia válida.
Decide what each timestamp means. The time the sensor measured an observation, the time a controller read it and the time a historian inserted it are different. A device that does not supply source timestamps can still be useful if the gateway labels receipt time accurately. For multi-point diagnostics, measure clock error, preserve UTC or an explicit offset and document display-local time. A repeated clock hour at a daylight-saving transition can make two different events appear simultaneous if the export keeps only local strings.
Select interval or change-of-value history according to the question being answered. Periodic history gives a regular grid, but can create repeated stale-looking values without quality context. Change-of-value history can reveal transitions and reduce storage, but a flat or missing interval can be ambiguous if no heartbeat, status transition or periodic confirmation is included. Averages may suit summaries while hiding brief changes needed for troubleshooting. Retain sufficiently detailed data for the verification window and state how raw and summarized records relate.
The archive configuration deserves its own checkout, even when its points carry a shared semantic model. Brick's point documentation shows how a point can be related to equipment and given an explicit unit such as ppm. Those relationships describe a series. The integrator still needs to verify that the historical consumer can retrieve the series, that it uses the intended time source and that its retained evidence covers the agreed use. Brick documentation on modeling data sources

Record which clock timestamps each stream and what the archive does between changes.
Accept the point by comparing both sides of each boundary
Begin by verifying the physical sensor against the installed asset list. Use a project-approved comparison with a suitable reference and comparable air conditions. If the objective is analog or register scaling, a controlled signal simulation can test the interface boundary without proving that the sensing element itself is accurate. Keep the comparison and the signal simulation separate in the record.
At the field interface, capture the sensor display or manufacturer diagnostic value, raw voltage or current if relevant, or returned register and status. Then compare the controller's raw and engineering readings, the BAS graphics, the stored history and the external consumer if present. An exact match of rounded values is rarely the right criterion. Use the project's specified tolerance, input resolution and method uncertainty. Record whether sequential readings were taken while the environment was stable or whether observations were synchronized.
Acceptance should include adverse cases. A disconnected field path tests one type of loss. A gateway that can still answer with a held value tests another. An actual quality flag, data timeout, sensor restart and override each carry a different meaning. Exercise relevant states under an approved procedure and verify that status travels through every consumer. A control consumer needs a separate review of its behavior in normal, unavailable and recovered modes.
| Hypothetical event | Field evidence | Intended downstream result |
|---|---|---|
| Stable comparison near 835 ppm | Source value and condition documented | BAS reading agrees within project tolerance and uses ppm |
| Sensor remains level | Device reports current valid observations | Trend policy distinguishes unchanged from unavailable |
| Field link drops but gateway stays up | Source update stops and gateway reports old cache | Value becomes stale according to defined policy |
| Controller placed in a supervised test state | Simulated value and test flag recorded | Operator can identify the test and its scope |
| Field link returns | New valid observations and age recorded | Display and authorized controls recover according to verified rules |
These rows are proposed verification cases, not real test results. Define the expected timing, pass criteria and source behavior before tests so a surprising result can remain open as evidence. Restore approved operating conditions after testing and note who verified the restoration.

Field communications failure and gateway availability can occur at the same time.
Preserve enough information to replace a device
A handoff needs the native point schedule, as-built identifiers, configuration and test evidence. Include the protocol document, exact address, version, unit mapping, timestamps, quality states and control dependencies. A device replacement can preserve the room name while changing output range or firmware behavior. Require a targeted point check and a review of adjacent history so later users know where continuity is reliable.
Separate human display names from stable integration identifiers. A room can be renumbered without altering historic ownership of the observations. Conversely, retaining an identifier after physically moving a sensor could silently merge two spaces. Document such transitions in the project system rather than treating every name change as an asset change or every asset change as a mere label update.
An owner also needs a way to identify failing integration before analysts discover it. Review how the BAS signals an increasing age, partial network loss, a missing historian point or a controller under override. Define which team receives each condition and where the operating record lives. The commissioning evidence is most useful when a later operator can repeat the checks with the documentation available to them.
Write a point schedule entry the next integrator can use
For a hypothetical monitor-only installation, the CO₂ transmitter serves meeting room M210 and has asset identifier IAQ-M210-01. The stable BAS point name is M210.RoomAir.CO2 and its unit is ppm. Its role is a direct room measurement used for diagnostics. The local controller is the authoritative BAS source. The point schedule references the transmitter's configured range and field interface, records the exact source address or terminal, and separately identifies the historian tag. If room naming changes, a metadata revision links the former display label and the same physical measurement history.
The site uses an acquisition period chosen to match the sensor's supported update behavior and the intended diagnostic window. History is sampled periodically, includes quality, and reports time in UTC with a separate display-local time setting. A successful outer network poll is insufficient for freshness; the controller tracks the most recent completed acquisition from the transmitter. If the site defines a stale interval, the project records how the timer behaves on startup, network recovery and repeated reads of unchanged values. The operator can distinguish these states without checking the polling driver.
For contrast, a proposed floor-level aggregate would need a second entry even if it shares the ppm unit. The entry would identify the population of room inputs and the statistic, such as a maximum of usable sources. It would state how the calculation behaves with a failed room point, whether the number of contributing points is reported and how long an individual sample remains eligible. If all inputs are unavailable, the output should reflect the agreed missing state. A floor maximum with six rooms contributing and one with only one room contributing carry different diagnostic context.
| Schedule entry | Room point example | Aggregate example |
|---|---|---|
| Role | Directly measured room concentration | Derived maximum of eligible room readings |
| Source identity | One named field asset | Versioned list of room point IDs |
| Usability | Source reports valid and fresh | Eligibility rule and contributor count |
| Timestamp | Defined acquisition or receipt time | Calculation time plus source age policy |
| Aceptación | Field comparison and mapping checks | Test changed values and loss of contributors |
| Control use | None in this example | None in this example |
These names illustrate how to record meaning. They are not a standardized BAS naming convention. The project can follow its own names provided the location, quantity and relationship are recoverable independently of the graphics.
Test two failures that can look alike on a dashboard
In a hypothetical overnight trend, a conference room reports a level concentration near outdoor background for hours. The first explanation is ordinary. The room is vacant, the point receives new valid observations, and rounding makes small variations invisible. The second explanation is a gateway replaying its last sample. The rendered line can look the same. Inspect source observations or freshness evidence, upstream and downstream communications and the latest quality update. A graphical flat line establishes neither fault nor health by itself.
Now consider a value that returns to normal after a service visit, while the export shows an unexplained gap. The display may have recovered immediately but the historian might have been disabled or its source tag renamed. Check the enabled status and start time for the correct archive. If the gateway did backfill observations, verify whether source timestamps and original quality were preserved. Backfilled receipt times can make a past event appear to happen at recovery. Preserve actual gaps and mark transformed records clearly rather than visually joining every segment.
Two clocks can further confuse diagnosis. Suppose the sensor itself has no timestamp, the controller receives a new reading at 09:00:25, and the history service stores the latest reading at 09:01:00. If the exported timestamp is the logging time, pairing this row with a 09:01:00 damper event does not establish that the room concentration changed at the same instant. If the system preserves both timestamps, the reader can distinguish the last confirmed receipt from the archive record. Neither clock can establish the precise instant of the concentration change at the inlet.
Check units at conversions and exports
Standardize ppm representation at each receiving boundary and document any conversion from the transmitted form. A point labeled percent, ppm or a raw integer should never be interpreted from value magnitude alone. One percent of a volume or mole fraction corresponds to 10,000 parts per million on the same basis. Changing from a volumetric concentration to mass per volume involves additional physical assumptions and should be explicit. Sensor1stop’s explanation of CO₂ ppm describes the concentration unit used for typical monitor displays.
Make sure the engineering unit persists in CSV headers, API metadata, dashboards and derived calculations. A graphics label can be right while the export field is unlabeled. Reconcile displayed precision with source resolution, accuracy and project tolerance. Adding decimal places after converting an integer point to a floating-point representation does not create new measurement information.
Include a documented data access check for a user with the normal operator role. Can the operator export the point with units and quality and identify the associated equipment? Can they retrieve data across a date boundary without losing offsets or gaps? A system with a correct field map but inaccessible history may still fail its diagnostics purpose. Record any authorized access dependencies and keep the acceptance record useful when responsibilities change.
Preguntas frecuentes
Is RS-485 enough information to select a BAS input?
No. RS-485 defines electrical characteristics. Confirm the protocol, supported roles, settings, device address and point map. A compatible electrical connection can still fail to provide usable information.
Does BACnet discovery verify the point?
Discovery establishes visibility of a device or object under the observed conditions. Confirm the object's identity, units, quality and relationship to the real sensor. Then check what the controller and historian use.
Is 0 ppm a good code for missing CO₂?
Use a distinct missing state, or an explicitly defined sentinel kept separate from valid engineering values. Reporting a missing reading as zero can mislead plots, diagnostics or decisions.
Can a gateway timestamp substitute for the sensor clock?
It can record receipt time if labeled accordingly. It cannot establish precisely when the sensor measured the value or how long the value was cached upstream. Confirm the available timing evidence matches the application.
Why does the chart show a gap if the live display looks normal?
Live acquisition and history collection are separate. Check that the trend is enabled, that it reads the intended source, and that data quality, retention and exports are behaving as specified. A recovered live point does not recreate missing observations.







Deja una respuesta