
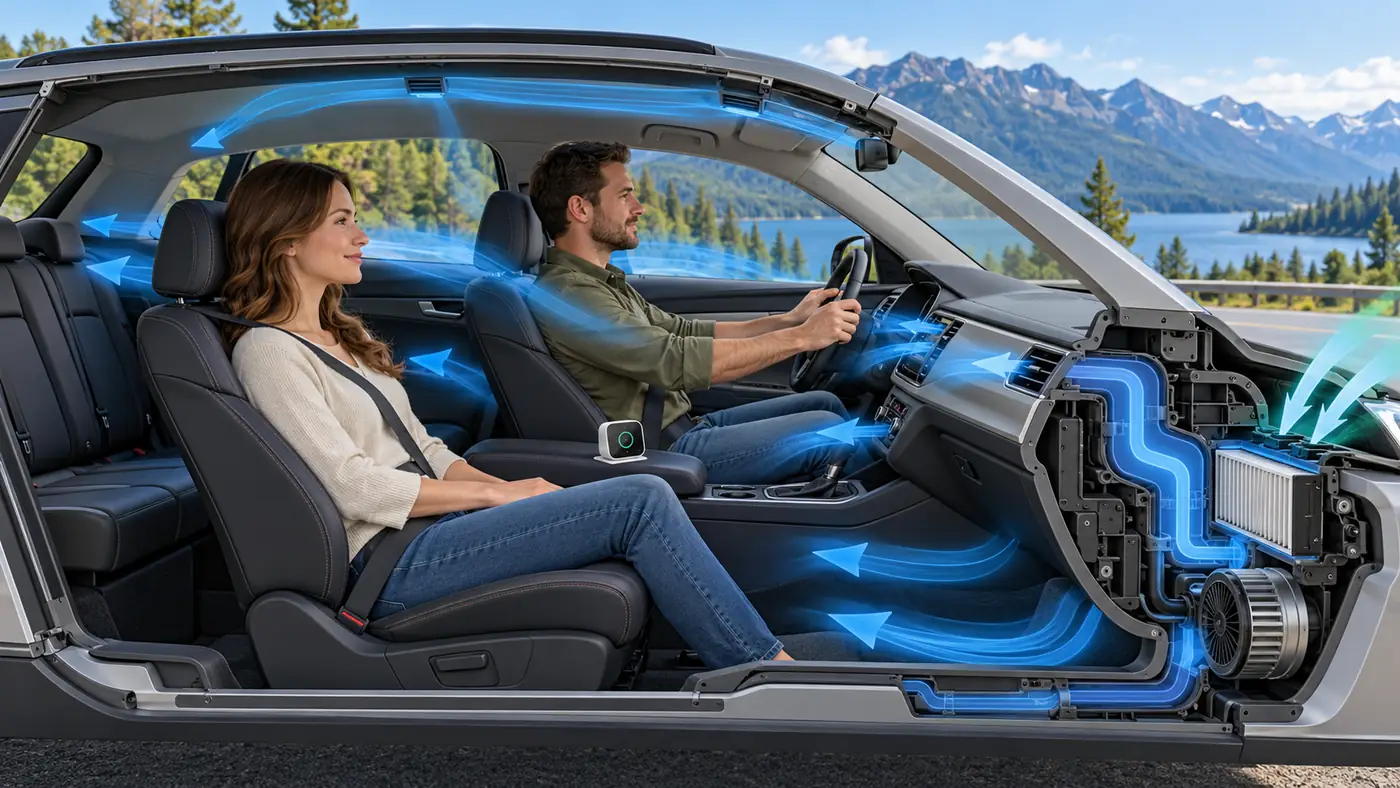
Read cabin CO₂ as a time series shaped by the people inside, the vehicle's fresh-air/recirculation setting, leakage, fan and window state, and the monitor's position and response. A rising value during a closed, occupied trip can indicate that exhaled CO₂ is accumulating faster than it is removed, but one number cannot diagnose a vehicle fault, establish a universal health threshold or describe traffic-particle exposure. Record when the mode changes and how many people are inside, then compare similar stretches of a journey. Use a separate relevant measurement if the question is about particles or exhaust gases.
The small cabin changes faster than a large room. People exhale CO₂ continuously, while outside-air intake, recirculation, open windows and leakage change how that gas is diluted. Cabin filters can reduce some incoming particles, yet they do not normally remove appreciable exhaled CO₂. That creates a real trade-off: a mode that limits traffic particles can allow cabin CO₂ to rise. Original field research across 92 vehicle models observed this trade-off under its routes and vehicles; its numerical results are not specifications for every car. Other fractional-recirculation experiments explored balancing the two channels under particular test conditions.
First identify what the display measures
A direct CO₂ monitor measures carbon dioxide reaching its inlet, commonly with an NDIR sensing method. A product that reports an “eCO₂” number inferred from VOC response is not directly measuring the same quantity. Check the finished product's method, range, stated accuracy, warm-up, power and logging behavior before interpreting a trip. The direct CO₂ versus eCO₂ guide explains the difference in the sensing chain. A component's favorable laboratory specification does not automatically transfer to a portable monitor bouncing in a warm, sunlit vehicle.
CO₂ is also not carbon monoxide (CO). CO may enter a vehicle through an exhaust fault or from another combustion source, and a cabin CO₂ monitor cannot serve as a CO safety alarm. The CO versus CO₂ channel guide details the distinction. Nor does CO₂ detect nitrogen oxides, ultrafine particles, PM₂.₅, odors or all VOCs. A colored car “air quality” icon might be based on a particulate or VOC channel rather than measured CO₂; read the vehicle manual before attributing a change to one gas.
| Question | Relevant evidence | What a CO₂ display alone cannot establish |
|---|---|---|
| Are occupants' exhalations accumulating during recirculation? | Direct cabin CO₂ trend, passenger count and HVAC mode/time. | An exact air-change rate or a fault diagnosis from one slope. |
| Are traffic particles entering the cabin? | Suitable particle measurement inside and, when useful, outside; filter and route context. | CO₂ can be low while particles are high. |
| Is the cabin filter effective? | Particle-specific comparison under controlled conditions and the filter's instructions. | A falling CO₂ line does not prove particle removal. |
| Is there a combustion/exhaust problem? | Appropriate safety response and professional inspection. | CO₂ is not a CO detector or exhaust test. |
| Is a driver impaired or unsafe? | Driver condition, symptoms and appropriate safety action; never a single ppm formula. | A cabin monitor cannot diagnose alertness. |
The distinction is practical. A driver may see CO₂ rise after selecting recirculation while outside particle levels fall. Neither reading proves the other channel is safe. A person may also see low CO₂ with the outside-air intake open while driving behind a diesel vehicle; that says little about the actual particle exposure without a particle measurement. Researchers studying cabin air often measure both channels to understand this balance, rather than asking one gas to stand for the whole exposure.
Why recirculation changes the trace
In recirculation mode, the HVAC system reuses a larger share of cabin air instead of continually introducing the same amount of outside air. The setting is not necessarily a perfect seal: vehicles leak air, automatic climate control may change fresh-air fraction, and speed or pressure conditions matter. But with occupants breathing in a small volume, less outside-air replacement generally favors a rise in cabin CO₂. In outside-air mode, the direction and speed of change depend on intake rate, fan, windows, passenger count, route and prior concentration. A dashboard symbol is a mode request, not a measured outdoor-air flow rate.
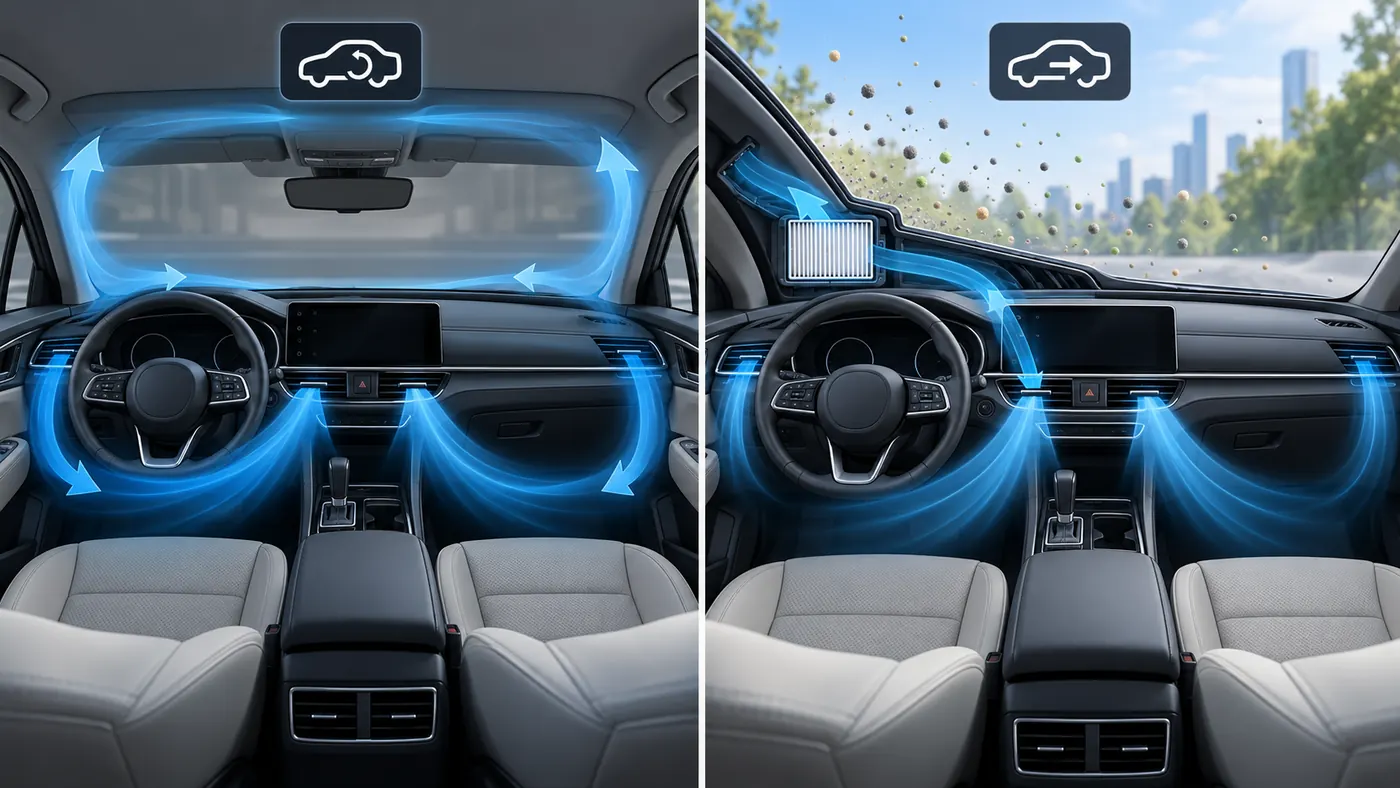
The image shows two conceptual air paths, without implying a specific vehicle's flap position or calibrated flow. Research is conditional. The 92-vehicle field study found lower ultrafine-particle concentrations in recirculation than in outside-air mode under its test route, alongside cabin CO₂ accumulation. A vehicle-cabin simulation study varied climate, passenger number, filtration and recirculation degree; its conclusions depended on the modeled vehicle and conditions. A Bangkok commuting-car field study likewise reported mode-dependent CO₂ behavior. Those studies justify checking the mode and conditions, not copying one car's rise rate or a particular control setting into all vehicles.
Some vehicles automatically change their air-intake strategy to manage defogging, temperature, battery demand or air quality. A driver may believe “recirculation” stayed constant while the system partially admitted outside air. Conversely, a partially blocked intake, different fan speed or open window can alter the result even when the icon appears unchanged. If a repeatable difference matters, consult the vehicle's operating documentation and have the system inspected rather than inferring a stuck flap from a handheld CO₂ chart alone.
There is no general rule that the lowest CO₂ reading is always the best overall cabin-air choice. On a heavily polluted road, opening the intake can increase particle exposure if the filter and conditions are not adequate. Keeping recirculation indefinitely may accumulate exhaled CO₂. The relevant balance varies with outside air, traffic, cabin filter, occupancy and climate. A controlled partial-recirculation experiment demonstrates why simultaneous particle and CO₂ observation is more informative than optimizing either in isolation, but its tested fractions are not user instructions for an arbitrary model.
Passenger count and trip phases matter
One person in an empty car after a short stop creates a different CO₂ pattern from four people entering a closed car that was already occupied. The starting point, number of occupants, their activity, cabin volume, mixing and duration all affect the trace. A larger rise with more passengers does not by itself mean the HVAC performed worse. If the purpose is to compare modes or cars, hold occupancy, route and observation period as similar as practical and explain what could not be held constant.
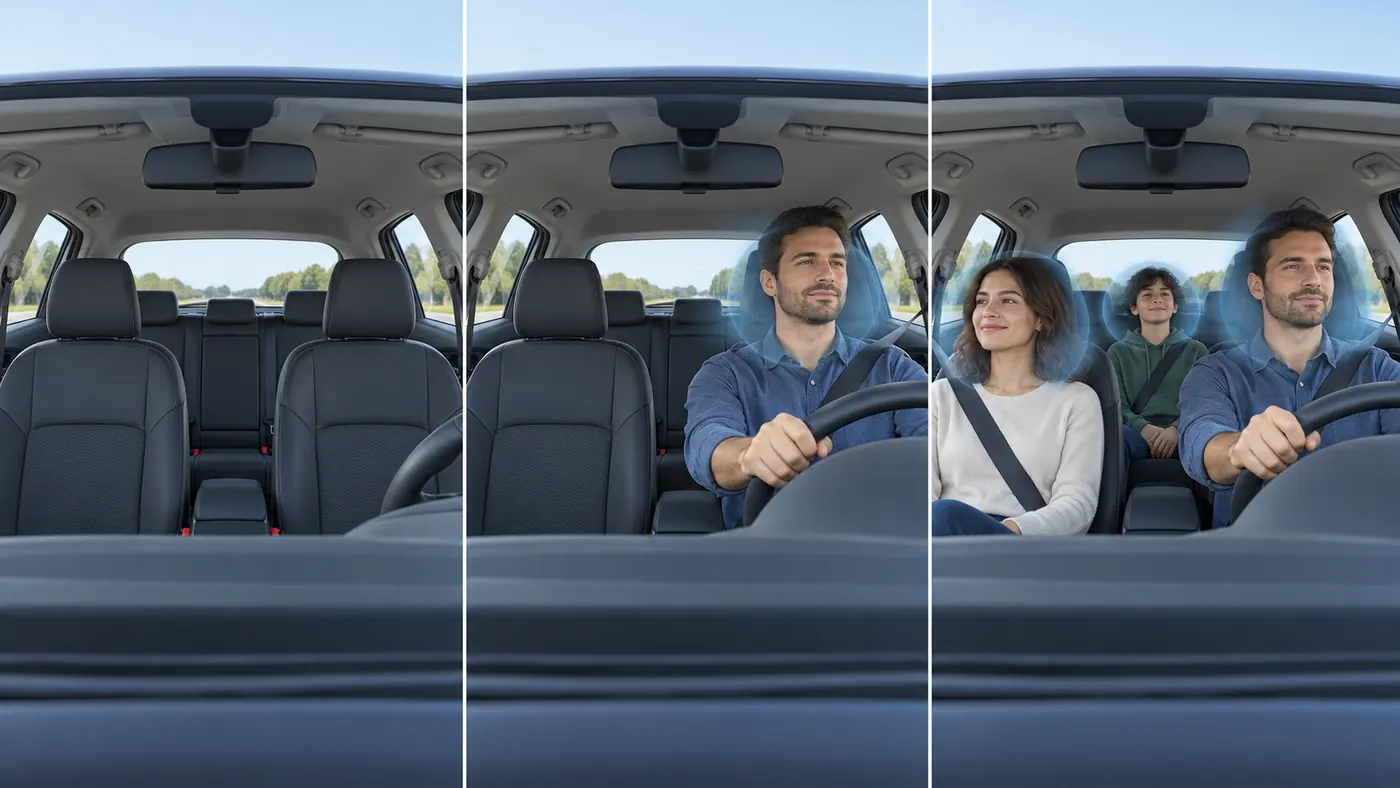
The illustration contains no ppm axis because a real trace requires an instrument and documented conditions. Mark the events that change interpretation: doors closed after boarding; recirculation engaged; fan speed changed; window opened; passenger added; outside-air mode resumed; car stopped. A brief door opening can introduce a pulse of outside air and reset a small cabin's local conditions. An instrument with a slow response or rolling average may show that event after a delay. Without event times, the analyst may mistake a device lag for a ventilation lag.
A parked, occupied vehicle with the climate system off is another scenario. The concentration at the beginning of the next trip may not resemble outdoor background. Record the starting condition and whether the car was occupied during the stop. Do not interpret a slow decline after everyone exits as a direct measure of fresh-air flow unless a suitable tracer-gas method and its assumptions are satisfied. Cabin leakage and mixing can vary with weather and vehicle state. A model of one car or a research test does not automatically transfer to a different vehicle.
Place a portable monitor so it samples cabin air safely
The ideal sampling point depends on the question, but it should not be directly in a passenger's exhaled plume, pressed against a supply vent, exposed to windshield sun or trapped behind fabric. Sun-heated electronics can alter instrument temperature beyond the intended conditions; a cold air jet can sample locally different air. A monitor held in one person's hand measures a moving local environment, not a stable cabin point. Read the device's specified operating temperature and mounting instructions.
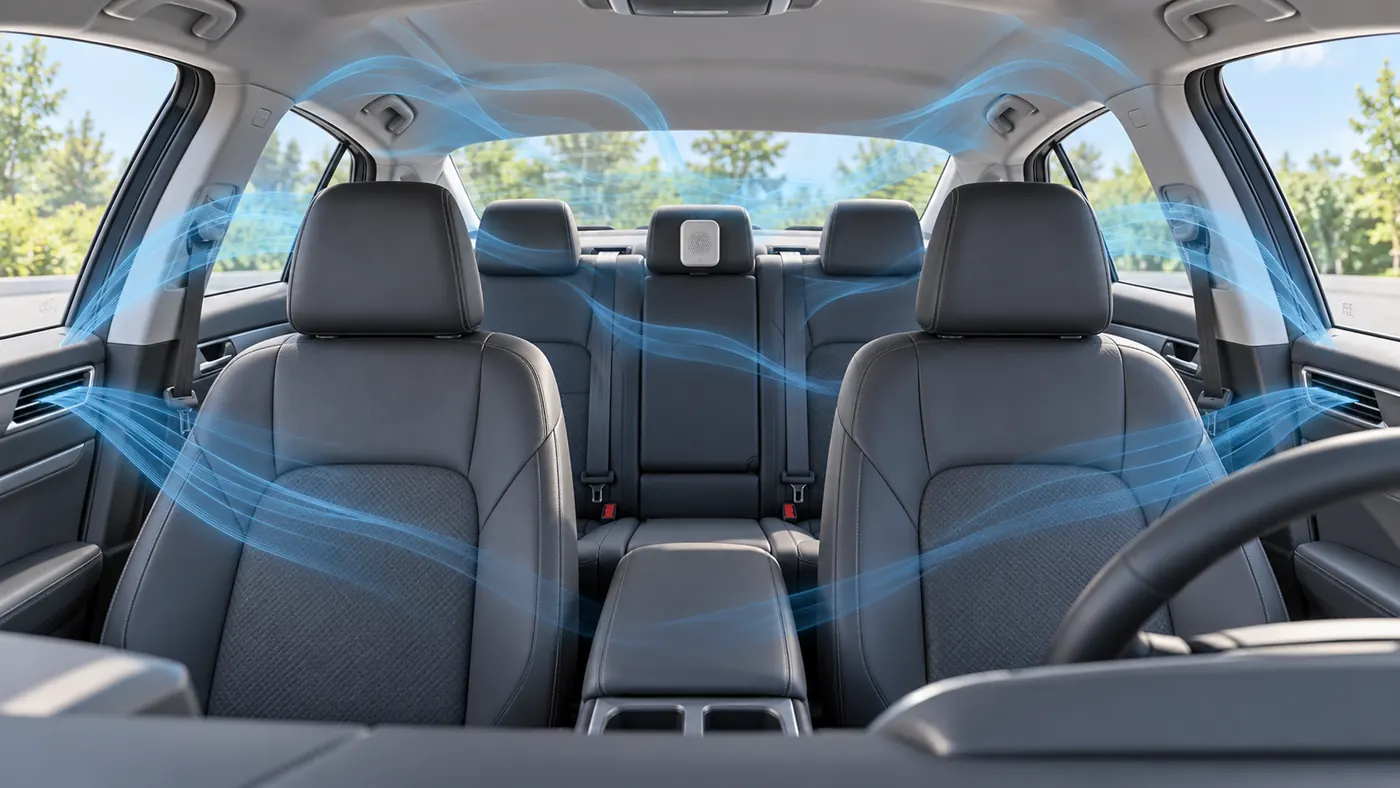
Secure the monitor so it cannot become a projectile or obstruct driver controls, visibility, airbags or seat-belt use. Do not manipulate a logger while driving; set up the device before the trip and review data after stopping safely. If the device needs a cable, route it according to vehicle safety needs. The image is illustrative, not a mounting specification for a particular dashboard or model. A vehicle manufacturer may provide a built-in sensor and its own control logic; a portable display does not override the vehicle's operating instructions.
If two sensors are compared, co-locate them briefly to check agreement, clocks and averaging before deciding that two cabin seats have different air quality. A discrepancy between devices can resemble a spatial difference. The CO₂ monitor accuracy specification guide explains why a one-ppm display step is not one-ppm accuracy. Automatic baseline correction can also depend on the device seeing appropriate low-concentration periods; a sensor continually kept in a car or used under unusual conditions needs the manufacturer's recommendations. Never recalibrate simply to make a reading look desirable.
Cabin air is not perfectly uniform. Direct vents, breath streams and window openings can produce gradients. For a formal design or exposure study, the required sampling positions and methods should be specified beforehand. For a personal trend comparison, a repeatable secure position, correct instrument and honest event log are more useful than a handheld display moved repeatedly to find the highest or lowest number.
Keep a short drive-event log
An explanatory log can be brief. Capture the measurement interval and changes that could plausibly affect it. A time-series logger helps preserve the sequence; a live display can still be used if someone records timed observations while not driving. Our logger versus display guide helps choose between those records.
| Field | What to write down | Why it matters |
|---|---|---|
| Vehicle and monitor | Vehicle model/year if known; CO₂ monitor make/model, serial, direct method and position. | Separates instrument differences from vehicle differences. |
| Clock and sampling | Date, time zone, logging interval and any smoothing setting. | Allows event alignment. |
| Occupants | Number and when people boarded or left; no names needed. | Describes the major CO₂ source. |
| HVAC mode | Recirculation/outside air, automatic mode, fan setting and when changed. | Describes intended air path, though not actual flow. |
| Windows/doors | Openings and duration. | Explains abrupt changes and local samples. |
| Trip context | Parked or moving, broad route type, traffic and outdoor pollution/weather if relevant. | Makes comparisons more interpretable. |
| Data quality | Warm-up, sunlight, vent proximity, missing log or moved unit. | Prevents false attribution. |
| Other channels | PM₂.₅ or particle number only if actually measured with a suitable device. | Separates traffic-particle and CO₂ questions. |
The table intentionally has no example concentration. Invented readings would be especially misleading when the true result varies across vehicles, passengers and routes. Store the original log when possible and annotate a copy. If a chart changes after a mode switch, note the sensor response and whether the vehicle's automatic system may have changed another variable. A change in CO₂ alone shows an association with that interval; it does not prove exactly how much outside air entered or that one button caused the entire change.

To compare two modes, use similar trip stretches, the same monitor position and the same people where feasible. An A/B comparison on different days may be confounded by traffic, outdoor pollution, weather, fan setting and initial cabin conditions. A before-and-after plot can still be informative if its conditions are made explicit. Do not discard inconvenient segments merely because they interrupt a tidy trend; label a door opening, lost signal or moved device so the next reader can understand it.
Design a comparison that survives the obvious confounders
A practical comparison begins with a narrowly worded question, such as whether one occupied vehicle shows a repeatable CO₂ difference between two HVAC modes during similar stretches. Record the initial concentration and allow for the instrument's warm-up and response time. If the first mode always follows a long parked interval and the second follows a window opening, the result cannot be attributed to the mode alone. Alternating the order on comparable runs may help, but road, weather and traffic will still vary. Report the conditions along with any observed difference, and avoid presenting a single trial as a performance specification.
Vehicle speed and pressure can change leakage and intake behavior. Automatic climate control can alter the outside-air fraction even when the button position looks fixed. Passenger count changes the CO₂ source strength, while conversation, door openings and monitor relocation change the local trace. For a useful informal comparison, keep the monitor in one secure position and the same occupants on board, mark every mode or window change, and compare sustained periods after the monitor has responded. If those conditions cannot be kept similar, the log can still describe what happened on that trip; it simply cannot isolate one cause.
Do not combine particle channels without defining them. PM₂.₅ is typically a mass concentration estimate for a size fraction, while ultrafine-particle studies may count particles by number in a different size range. A reduction in one does not prove the same reduction in the other. Consumer optical PM measurements may also respond to particle composition and humidity. When researching a filter or recirculation trade-off, note the study's measured size range, route, vehicle, filter and sampling position before applying its insight to a different car. A filter product claim and an independent cabin exposure measurement are not the same evidence.
Keep the decision proportional to the evidence. A driver can use a cabin trend to ask whether a setting produces recurring accumulation in that car, then consult the vehicle manual or seek service if the behavior is unexpected. A workplace fleet making exposure or purchasing claims needs a stronger protocol, comparable vehicles and suitable measurement methods. Neither use case should invent a universal “safe” cabin CO₂ cutoff from an anecdotal trace. The right next step may be particle measurement, an HVAC inspection or simply a better-recorded repeat trip. None of these replaces stopping safely when a driver feels unwell or impaired.
Interpret common trace shapes cautiously
Rising during recirculation: occupant emissions are a plausible cause, particularly if the cabin is occupied and outside-air replacement is limited. Check passenger count, mode, position and whether the monitor had stabilized. The rate is not a stand-alone measure of mechanical ventilation or personal performance.
Falling after outside-air selection: increased dilution is plausible, but a concurrent window opening, passenger exit or device move could contribute. If the comparison matters, repeat under similar conditions and note what changed. A falling CO₂ line says nothing direct about whether outside roadway particles rose.
Different readings in front and rear seats: local breath, supply vents and airflow can contribute; so can differences between instruments. Compare devices side by side and maintain a repeatable sampling method before declaring a cabin zone problem.
High number immediately after boarding: the cabin may have started above outdoor background, or the device may have been carried in from another environment. Establish the starting point and response time. A single initial value is less informative than the subsequent mode- and occupancy-labeled trace.
Flat-looking line: the room may be in approximate balance, the device may average slowly, or the logger may be stale. Check data quality. A flat line is not proof that filtration works, CO is absent or the driver's alertness is safe.
The ASHRAE position on indoor CO₂ emphasizes the limits of turning concentration into ventilation or health conclusions without proper assumptions. Research on cabin exposures is informative but does not supply a universal “safe to drive” CO₂ number. Sleepiness, headache or other symptoms deserve appropriate attention regardless of a monitor's value. If a driver feels impaired, they should stop safely and address the condition; a ppm display cannot diagnose the cause.
CO₂ and particle control may pull in different directions
The cabin filter's job is largely different from outdoor-air exchange. A high-efficiency particle filter may reduce incoming particles when outside air is admitted, but the actual performance depends on filter type, condition, leakage, fan setting and the particle mix. Recirculation can reduce some roadway pollution exposure yet allow CO₂ to rise. A field study of 12 vehicles using high-efficiency cabin filtration investigated a particular way to reduce ultrafine particles while admitting outside air; its results are not a blanket promise for every filter sold as “premium.”
Field studies capture real traffic but cannot hold every condition fixed. Controlled experiments can isolate an air-path change but may not reproduce a dirty filter, a different vehicle body or seasonal traffic. Simulations can explore many combinations efficiently, provided their assumed airflows and particle behavior are understood. Read these approaches together: they establish why a trade-off is plausible and worth measuring, while leaving the best setting for a particular trip dependent on conditions and the vehicle's design.
Do not use CO₂ alone to choose a mode during a wildfire or behind a high-emitting vehicle. Nor should a particle reading alone prove that enough outdoor air reaches occupants. If an automated system optimizes both, its sensors, control algorithm and operating limits should be assessed together. A cabin “air quality” badge may refer to VOC or particles and may not mean CO₂ was measured. Ask what channel the car actually uses and what condition the display represents.
If a smell of exhaust or an urgent safety concern occurs, follow the vehicle's safety guidance and seek appropriate inspection rather than using a CO₂ monitor to reassure yourself. A separate CO hazard is possible; the CO₂ channel cannot rule it out. Ordinary cabin monitoring is an aid to understanding ventilation and exposure patterns, not a substitute for vehicle maintenance or emergency judgment.
Frequently asked questions
Why does CO₂ rise even when the fan is on?
The fan can move or recirculate cabin air without adding much outside air. Occupants continue to exhale CO₂. Check the intake mode and the vehicle documentation, then interpret the trend with passenger count and sensor position. A fan icon alone is not a measured fresh-air rate.
Does a cabin filter remove CO₂?
Ordinary cabin particle filters do not remove appreciable CO₂. They target particles, sometimes with additional media for selected odors or gases. Lower particles after changing a filter do not establish lower CO₂. Outdoor-air exchange and occupant generation remain relevant to CO₂.
Is 1,000 ppm a universal vehicle safety limit?
No. A number copied from a building guide or one vehicle study cannot serve as a universal driving or health threshold. The relevant evidence depends on measurement quality, duration, occupants and other exposures. Use the trend to understand air exchange; do not infer an individual's impairment or a vehicle's legal compliance from one concentration.
Can I compare two cars using their highest trip readings?
Only with great caution. Passenger count, trip duration, starting CO₂, mode, leakage, fan, windows, route, climate and monitor differences can dominate the comparison. A matched protocol and synchronized instruments are needed before attributing a difference to vehicle design. Even then, a CO₂ result does not describe particles or all pollutants.
Can a low CO₂ value prove there is no exhaust leak?
No. CO₂ is not a CO alarm or an exhaust system check. Suspected exhaust intrusion requires appropriate safety response and professional inspection. Do not remain in a vehicle because a CO₂ screen looks normal.
What should I record if automatic climate control changes modes?
Record the user-selected setting, visible mode changes, fan behavior, defogging events and anything the vehicle manual says about automatic intake. If the actual fresh-air fraction is unknown, label it unknown. A chart should not be used to invent flap position or airflow that was never measured.
Use a time series to ask a better question
Cabin CO₂ monitoring is most useful when it connects the concentration trace to a known trip sequence. It can show a repeatable difference between occupied recirculation and outside-air periods in a particular vehicle, while leaving uncertainty about exact airflow, particles and health effects. Recording that uncertainty is a strength. It directs the next check toward the right channel or professional method instead of making one number carry a claim it cannot support.
Technical sources
- Field study of ultrafine particles and CO₂ in 92 vehicle models
- Simultaneous CO₂ and particle mitigation through fractional recirculation
- Vehicle cabin simulation of recirculation, climate, particles and CO₂
- In-vehicle CO₂ field experiments in Bangkok commuting cars
- Carbon dioxide accumulation inside vehicles under ventilation and driving conditions
- ASHRAE Position Document on Indoor Carbon Dioxide
Gas Heater Monitoring at Home: Which Alarm and Sensor Does What?
Understand the separate roles of a household CO alarm, fuel-gas detector, CO2 monitor and qualified heater service, including what to do after a warning.
Read More
How to Plan IAQ Monitoring in Shared Indoor Spaces
Plan indoor-air-quality monitoring for libraries, waiting areas and shared rooms by matching CO2, particles and other channels to a defined decision.
Read More
How to Build a School IAQ Monitoring Record That Leads to Action
Use linked room, occupied-event and issue logs to turn school CO2 observations into reliable ventilation follow-up.
Read More
Where to Place CO2 Monitors in School Classrooms
Choose representative school classroom CO2 monitor positions by occupancy and air paths, then verify, document and maintain the installation.
Read More
How to Interpret Classroom CO2 Readings for Ventilation
Interpret classroom CO2 readings as occupied ventilation clues with context, local guidance, monitor checks and repeatable follow-up.
Read More
How to Compare CO2 Readings Across Open-Plan Office Zones
Compare synchronized office-zone CO2 logs after checking monitor agreement, location, occupancy and air-system events; learn when a zone difference warrants investigation.
Read More