
Air quality is a pressing concern worldwide, particularly in industrialized and urban areas where pollutants affect millions daily. To provide a standardized measure of air quality, countries employ the Air Quality Index (AQI). This article examines the US-EPA, their primary pollutants, health impacts, and the differences between the two equations used to calculate AQI.
The US-EPA monitors the following key pollutants within the AQI framework, each with its own concentration thresholds and health impacts:
1. Particulate Matter (PM10 and PM2.5)
PM10
Particles with diameters of 10 micrometers or smaller.
PM2.5
Fine particles with diameters of 2.5 micrometers or smaller.
Impact
Both PM10 and PM2.5 can penetrate respiratory passages, entering the lungs and potentially causing respiratory issues, cardiovascular problems, and worsening asthma and other lung conditions.
Health Implications by AQI Range:
- 0-50 (Good): No health impacts expected.
- 51-100 (Moderate): Sensitive individuals may experience mild symptoms.
- 101-150 (Unhealthy for Sensitive Groups): Sensitive groups may experience respiratory irritation.
- 151-200 (Unhealthy): General population may experience breathing discomfort; serious impact on sensitive groups.
- 201-300 (Very Unhealthy): Increased respiratory symptoms; public advised to avoid outdoor activities.
- 301-500 (Hazardous): Emergency health alert; everyone may experience serious health effects.
2. Carbon Monoxide (CO)
Source
Emissions from vehicles, industrial activities, and combustion processes.
Impact
CO reduces oxygen delivery in the body, causing headaches, dizziness, and potentially fatal outcomes in high concentrations.
Health Implications by AQI Range
Low Levels: Minor discomfort for sensitive groups.
Moderate to High Levels: Breathing difficulty, especially for those with heart conditions.
Hazardous Levels: Risk of life-threatening exposure if sustained.
3. Ozone (O3)
Source
Chemical reactions between nitrogen oxides (NOx) and volatile organic compounds (VOCs) in sunlight.
Impact
Ozone irritates the respiratory system, causing coughing, throat irritation, and exacerbating asthma.
Health Implications by AQI Range
Moderate to High: Respiratory symptoms in sensitive groups.
Very High: Serious health risks for everyone.
4. Nitrogen Dioxide (NO2)
Source
Emissions from vehicles and industrial activities.
Impact
NO2 can irritate airways, potentially worsening asthma and decreasing lung function.
Health Implications
Moderate to Very High: Respiratory discomfort, with severe exposure possibly affecting the entire respiratory system.
5. Sulfur Dioxide (SO2)
Source
Industrial activities, particularly from fossil fuel combustion
Impact
SO2 irritates the respiratory system, affecting lung function and aggravating conditions like asthma.
Health Implications
High Levels: Immediate respiratory irritation and potential long-term lung issues.
6. Ammonia (NH3)
Source
Agricultural activities, industrial processes, and waste.
Impact
Short-term exposure can cause eye and throat irritation, while long-term exposure affects lung function.
Health Implications
Higher AQI Ranges: Exposure may lead to respiratory and skin irritation.
7. Lead (Pb)
Source
Industrial emissions, particularly from lead-based paint and contaminated soil.
Impact
Lead exposure is highly toxic, affecting cognitive development in children and causing cardiovascular and renal issues in adults.
Health Implications
High AQI Levels: Immediate risks, especially for children.
Choosing the Right AQI System for Health Safety
Portable vs Fixed Refrigerant Detection: How Their Jobs Differ
Compare handheld leak locators, fixed-point monitors and aspirating systems by sample location, response chain and commissioning needs.
Read MoreRefrigerant Identification vs Concentration Measurement: Which Test Do You Need?
Distinguish a sealed-charge identifier from ambient concentration monitoring, handheld leak location and formal refrigerant purity testing.
Read MoreHow Humidity Affects Optical PM2.5 Sensor Readings

Learn why humidity, water uptake, fog and condensation can affect optical PM2.5 estimates and how to investigate and validate a humid-air spike.
Read MoreHow to Interpret CO2 Readings in a Vehicle Cabin

Read vehicle-cabin CO2 trends alongside passengers, HVAC mode and route conditions while separating ventilation clues from particle and exhaust safety questions.
Read MoreGas Heater Monitoring at Home: Which Alarm and Sensor Does What?
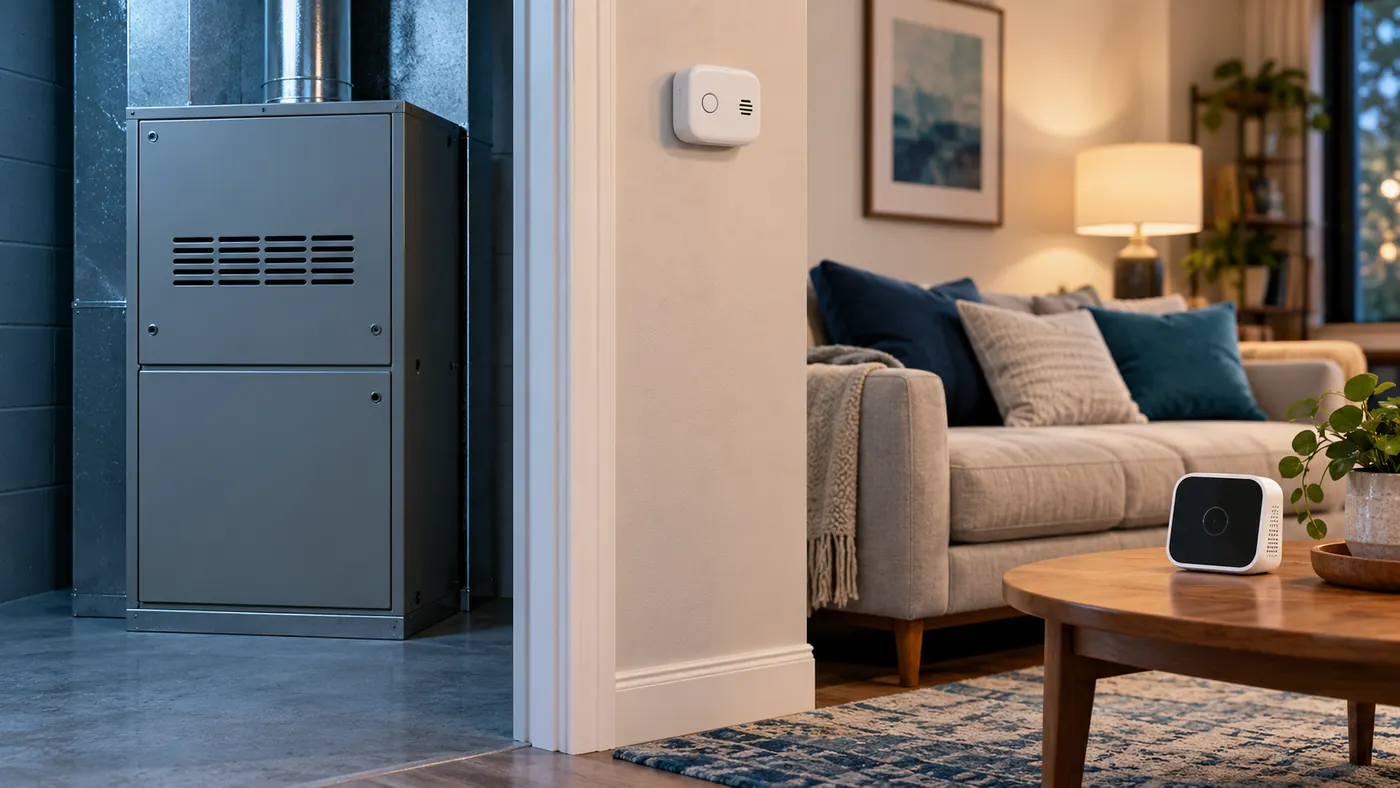
Understand the separate roles of a household CO alarm, fuel-gas detector, CO2 monitor and qualified heater service, including what to do after a warning.
Read MoreHow to Plan IAQ Monitoring in Shared Indoor Spaces

Plan indoor-air-quality monitoring for libraries, waiting areas and shared rooms by matching CO2, particles and other channels to a defined decision.
Read More


